. 2019 Sep;573(7773):281-286.
doi: 10.1038/s41586-019-1534-3. Epub 2019 Sep 4.

The histone mark H3K36me2 recruits DNMT3A and shapes the intergenic DNA methylation landscape

Affiliations

The histone mark H3K36me2 recruits DNMT3A and shapes the intergenic DNA methylation landscape

Daniel N Weinberg et al. Nature. 2019 Sep.

Abstract

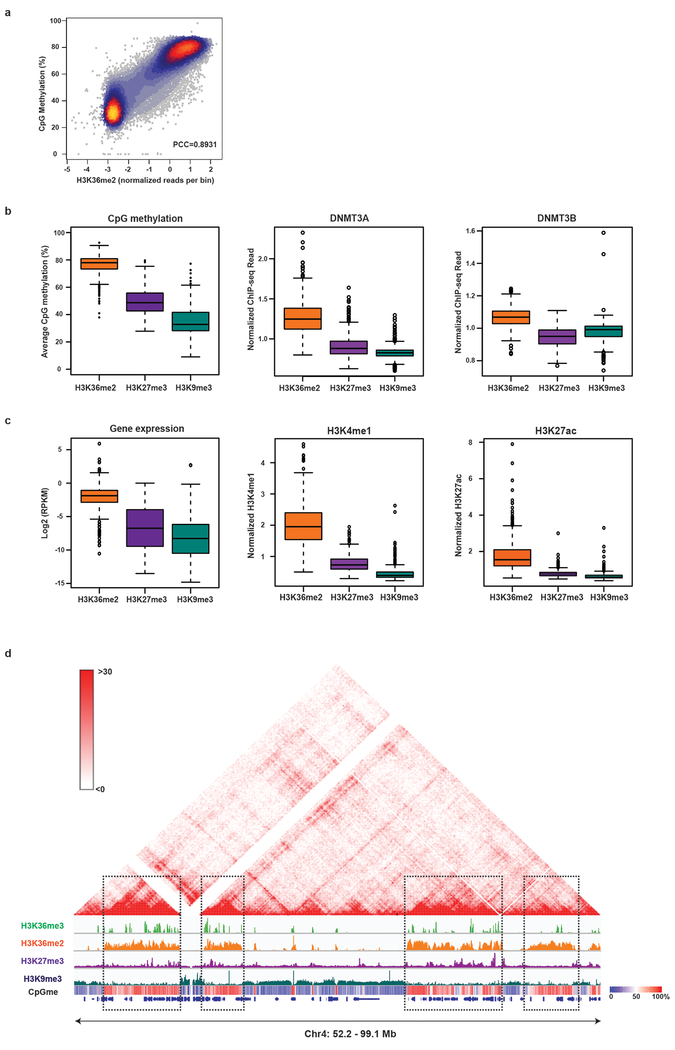
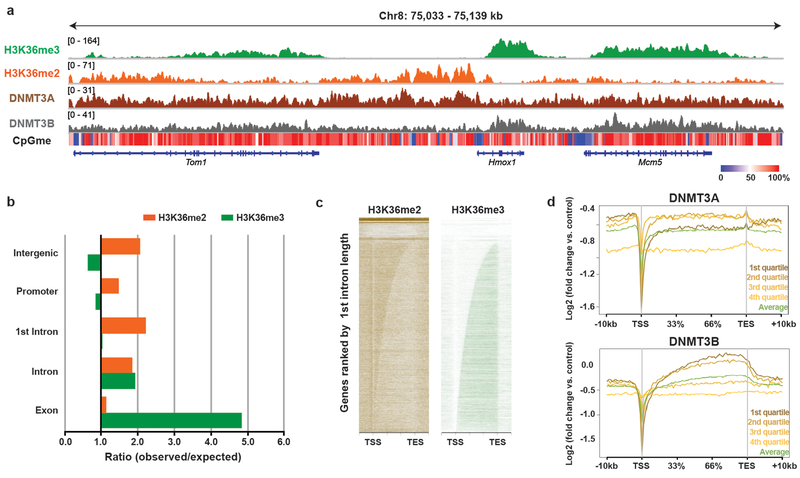
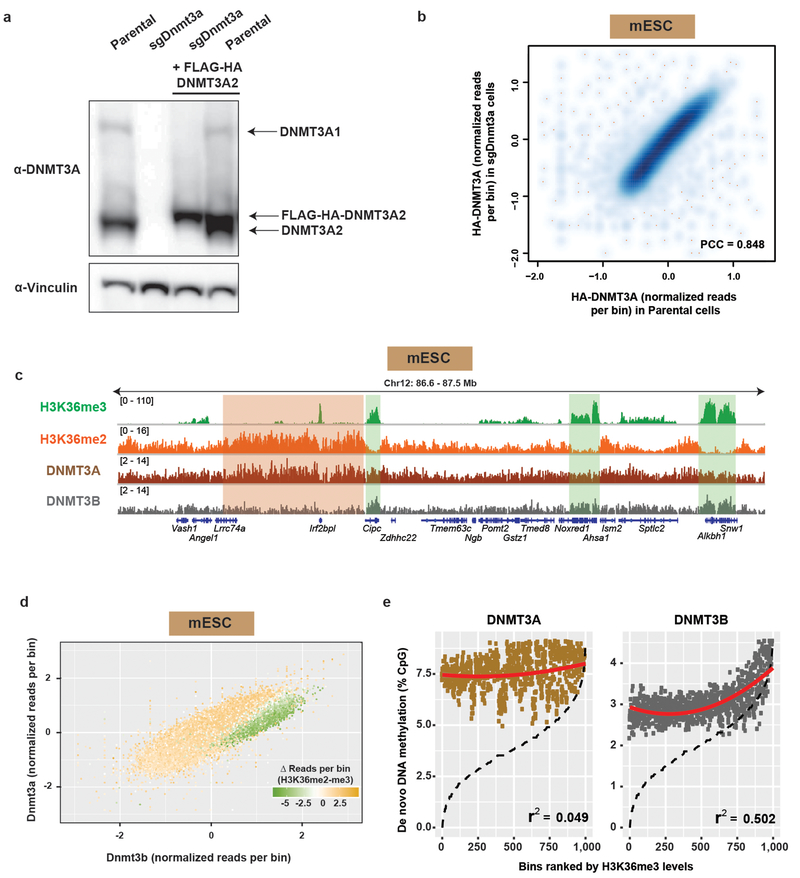
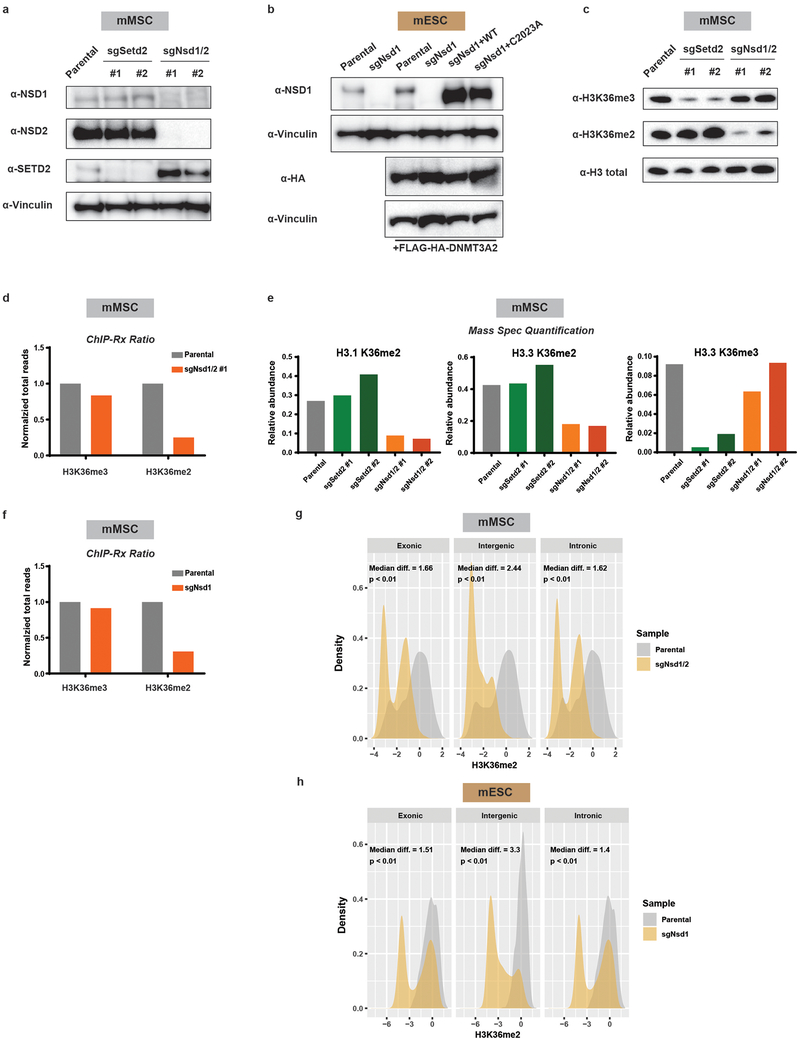
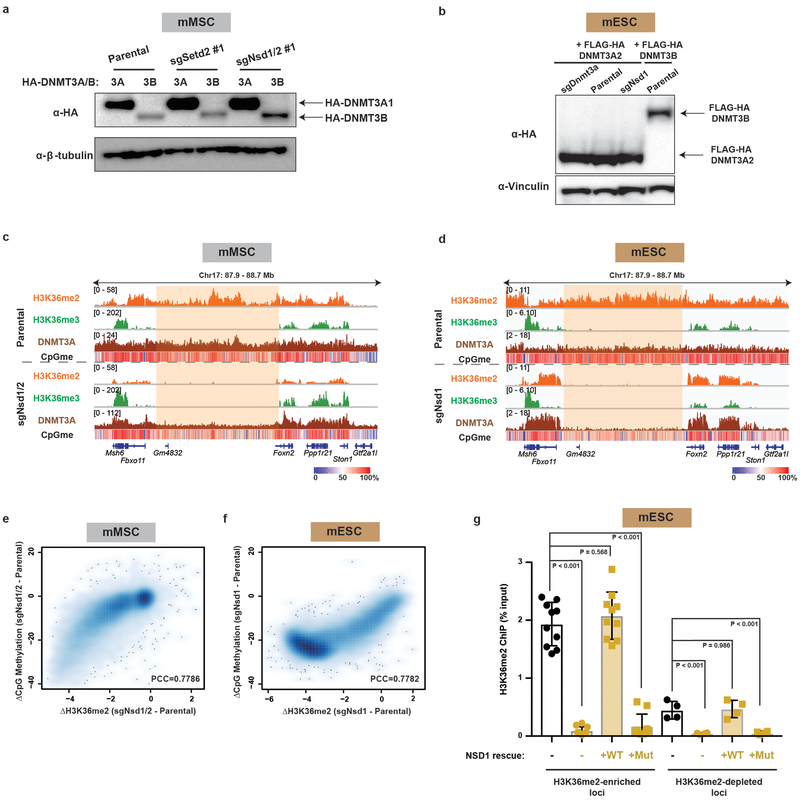
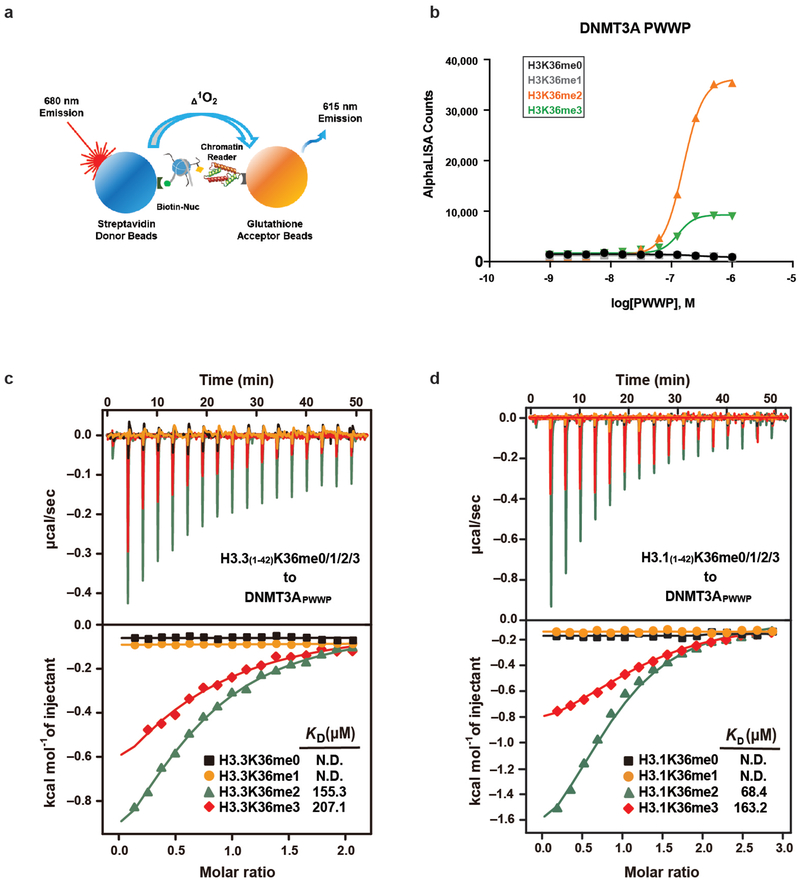
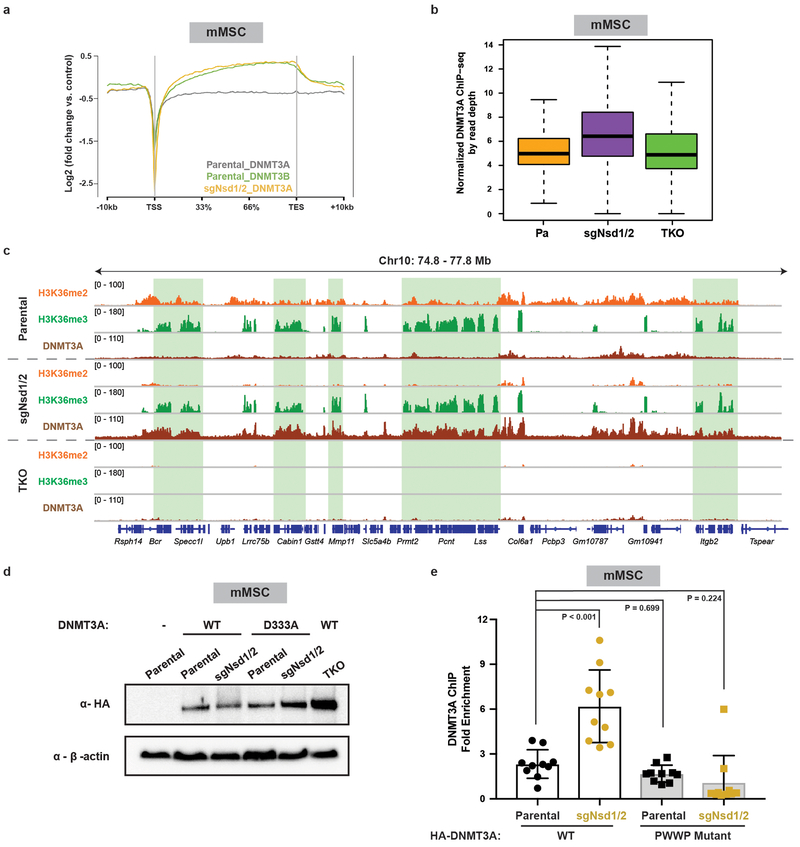
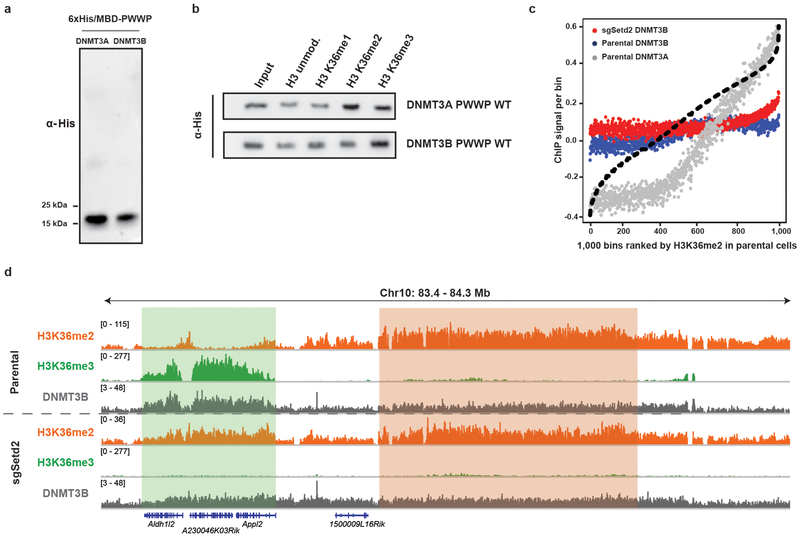
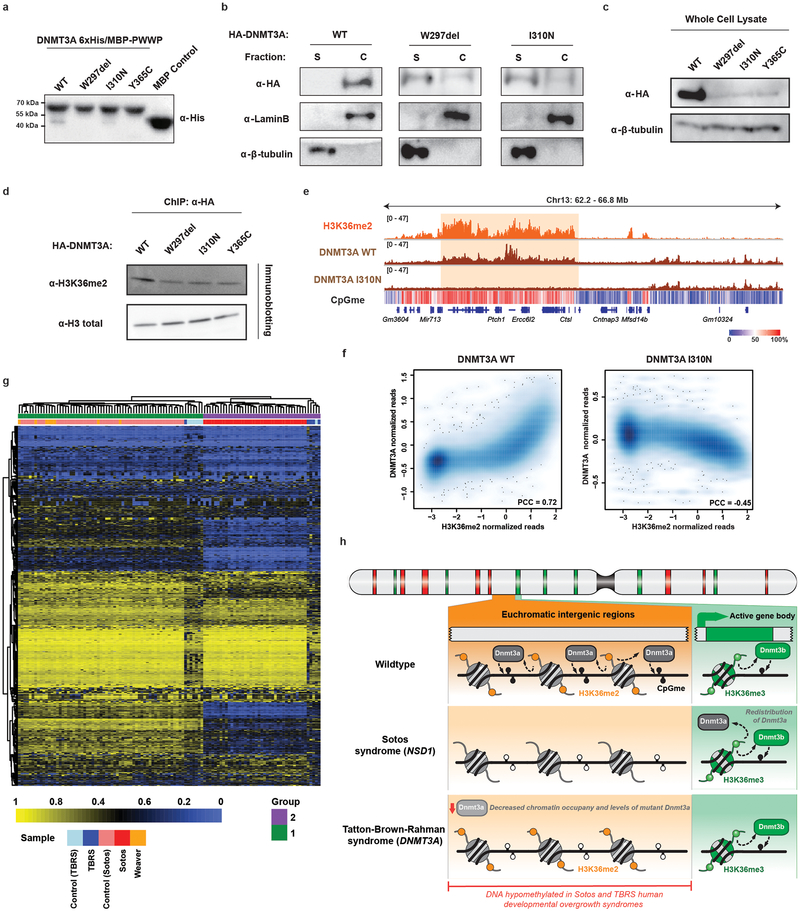
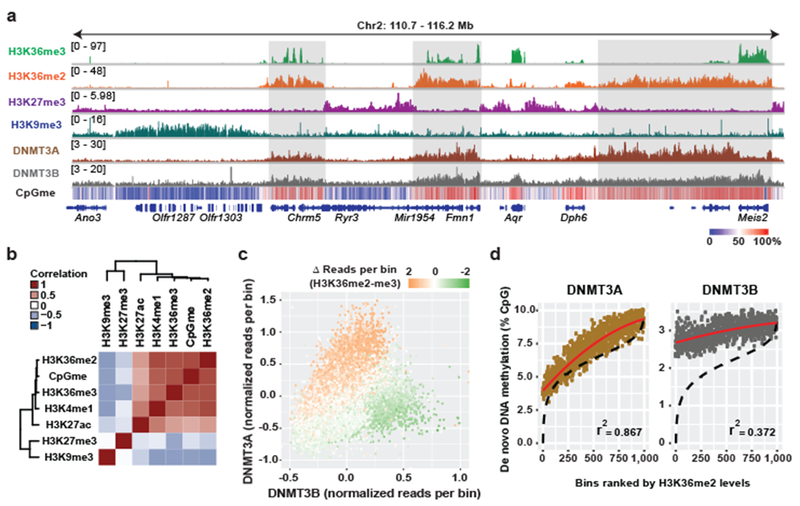
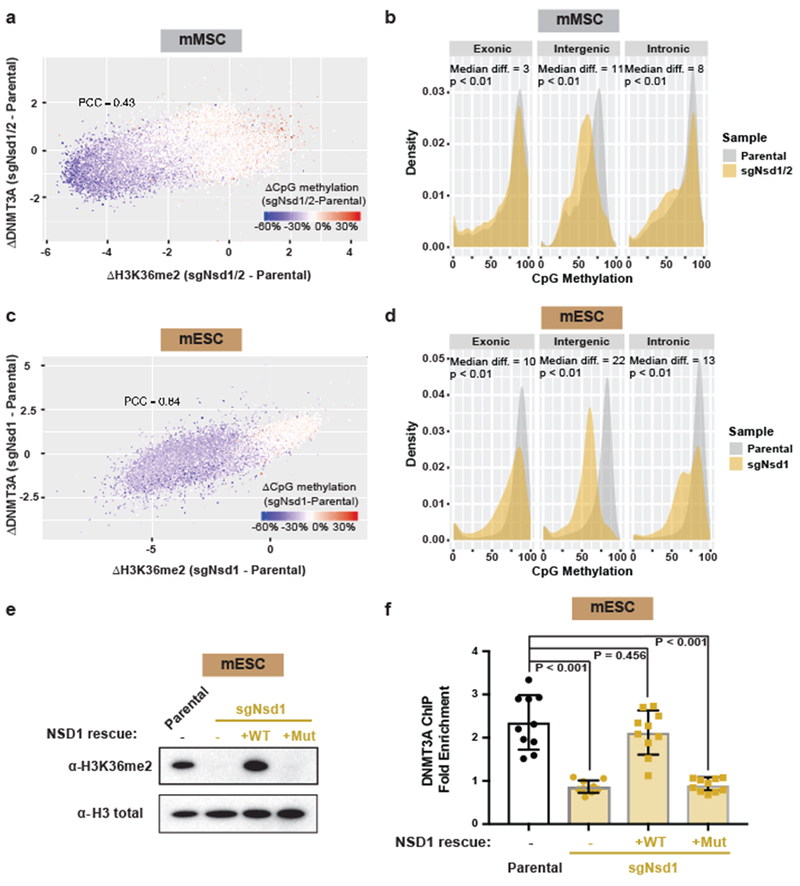
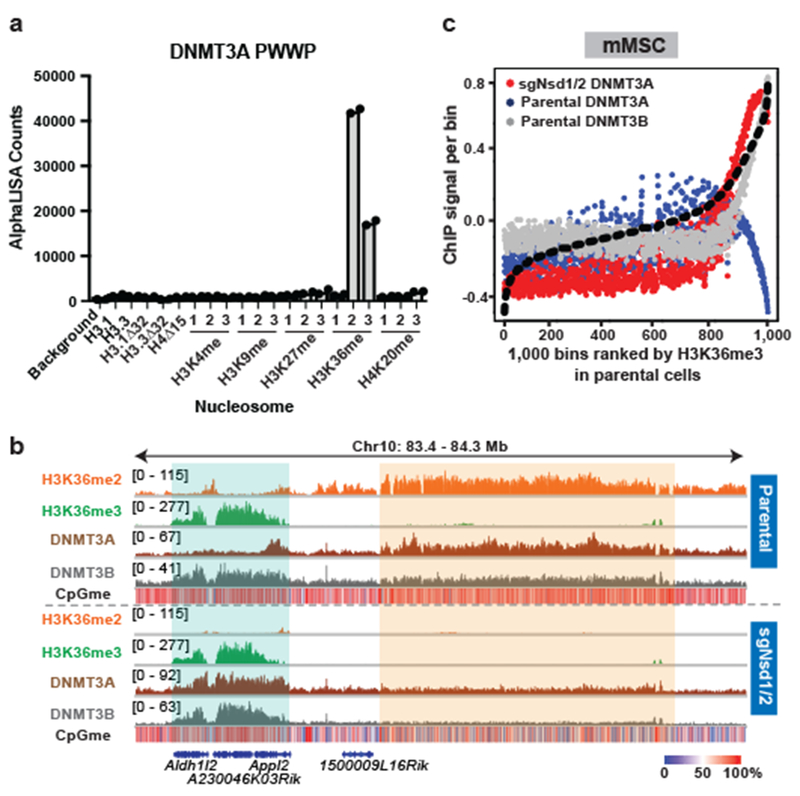
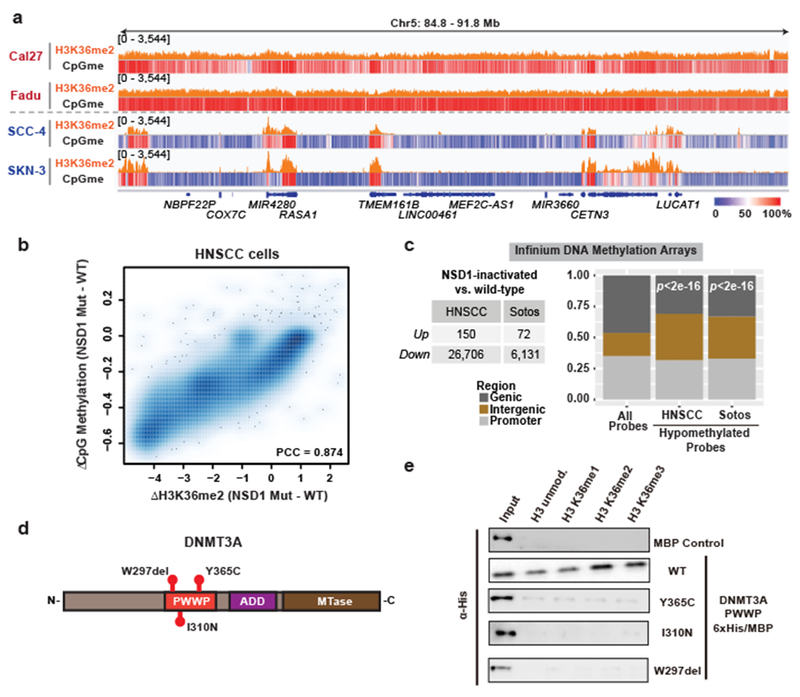
Enzymes that catalyse CpG methylation in DNA, including the DNA methyltransferases 1 (DNMT1), 3A (DNMT3A) and 3B (DNMT3B), are indispensable for mammalian tissue development and homeostasis1-4. They are also implicated in human developmental disorders and cancers5-8, supporting the critical role of DNA methylation in the specification and maintenance of cell fate. Previous studies have suggested that post-translational modifications of histones are involved in specifying patterns of DNA methyltransferase localization and DNA methylation at promoters and actively transcribed gene bodies9-11. However, the mechanisms that control the establishment and maintenance of intergenic DNA methylation remain poorly understood. Tatton-Brown-Rahman syndrome (TBRS) is a childhood overgrowth disorder that is defined by germline mutations in DNMT3A. TBRS shares clinical features with Sotos syndrome (which is caused by haploinsufficiency of NSD1, a histone methyltransferase that catalyses the dimethylation of histone H3 at K36 (H3K36me2)8,12,13), which suggests that there is a mechanistic link between these two diseases. Here we report that NSD1-mediated H3K36me2 is required for the recruitment of DNMT3A and maintenance of DNA methylation at intergenic regions. Genome-wide analysis shows that the binding and activity of DNMT3A colocalize with H3K36me2 at non-coding regions of euchromatin. Genetic ablation of Nsd1 and its paralogue Nsd2 in mouse cells results in a redistribution of DNMT3A to H3K36me3-modified gene bodies and a reduction in the methylation of intergenic DNA. Blood samples from patients with Sotos syndrome and NSD1-mutant tumours also exhibit hypomethylation of intergenic DNA. The PWWP domain of DNMT3A shows dual recognition of H3K36me2 and H3K36me3 in vitro, with a higher binding affinity towards H3K36me2 that is abrogated by TBRS-derived missense mutations. Together, our study reveals a trans-chromatin regulatory pathway that connects aberrant intergenic CpG methylation to human neoplastic and developmental overgrowth.


Conflict of interest statement

The authors declare competing financial interests. EpiCypher is a commercial developer and supplier of platforms similar to those used in this study: recombinant semi-synthetic modified nucleosomes and the dCypher nucleosome binding assay. H.C. and Y.Y. contributed equally as co-second authors to this manuscript.

Figures

Extended Data Figure 1:
Extended Data Figure 1:. H3K36me2/3 mark transcriptionally active euchromatin
a) ChIP-seq normalized reads of H3K36me2 were plotted relative to averagepercentage of CpG methylation in mMSCs for 100kb non-overlapping bins (n = 25,624). Pearson’s correlation coefficient is indicated. b) Quantification of ChIP-seq normalized reads for DNMT3A1, DNMT3B and averagedCpG methylation within H3K36me2/3 (n = 591), H3K27me3 (n = 283), or H3K9me3 (n = 545) domains. P-values were < 2.2 × 10⁻¹⁶ for all pair-wise comparisons as determined by Wilcoxon’s rank sum test (two-sided), except for DNMT3B (P = 3.73 × 10⁻¹⁴) between H3K27me3 and H3K9me3 domains. Boxes represent median and 25th-75th percentiles, whiskers are minimum to maximum with discrete points representing outliers. c) Quantification of ChIP-seq normalized reads for gene expression, H3K4me1 andH3K27ac within H3K36me2/3 (n = 591), H3K27me3 (n = 283), or H3K9me3 (n = 545) domains. P-values were < 2.2 × 10⁻¹⁶ for all pair-wise comparisons as determined by Wilcoxon’s rank sum test (two-sided), except for gene expression (P = 1.72 × 10⁻⁶) between H3K27me3 and H3K9me3 domains. Boxes represent median and 25th-75th percentiles, whiskers are minimum to maximum with discrete points representing outliers. d) 3D genome browser representation of Hi-C chromatin conformation data from mousemyoblasts compared to ChIP-seq normalized reads for histone PTMs in mMSCs at Chr4: 52.2-99.1 Mb. Levels of CpG methylation are depicted as a heat map (blue/low; white/intermediate; red/high). Refseq genes are annotated at the bottom. For H3K36me3 and H3K36me2, data are representative of two independent ChIP-seq experiments; for H3K27me3 and H3K9me3, ChIP-seq was performed once and an independent ChIP was performed in which genomic regions of selective enrichment and depletion were confirmed by qPCR. WGBS was performed once.
Extended Data Figure 2:
Extended Data Figure 2:. Distinct enrichment patterns between H3K36me2 and H3K36me3 at euchromatin
a) Genome browser representation of ChIP-seq normalized reads for H3K36me3,H3K36me2, DNMT3A1, and DNMT3B in mMSCs at Chr8: 75.0-75.1 Mb. Levels of CpG methylation are depicted as a heat map (blue/low; white/intermediate; red/high). Refseq genes are annotated at the bottom. For H3K36me3, H3K36me2, and DNMT3A1, data are representative of two independent ChIP-seq experiments; for DNMT3B, ChIP-seq was performed once and an independent ChIP was performed in which genomic regions of selective enrichment and depletion were confirmed by qPCR. WGBS was performed once. b) Ratio of observed to expected ChIP-seq reads for H3K36me2 and H3K36me3 inannotated genomic regions. Numbers of expected reads were generated assuming equivalent genomic distribution to input. c) Heat maps representing ChIP-seq signal density for H3K36me2 and H3K36me3 inmMSCs across all gene bodies. Genes are ranked by first intron length. Each gene is displayed as a row. d) Averaged ChIP-seq normalized signal across gene bodies stratified by expressionquartile, represented as log2 fold-change over input for DNMT3A1 (above) and DNMT3B (below) in parental mMSCs. Sample sizes (same for DNMT3A1 and DNMT3B) are: n = 7,524, 7,435, 6,923, 8,550 for 1st, 2nd, 3rd, and 4th quartile respectively; n = 35,777 for “Average”.
Extended Data Figure 3:
Extended Data Figure 3:. Genome-wide co-localization between H3K36me2 and DNMT3A2 in mESCs
a) Immunoblots of lysates generated from parental and sgDnmt3a mESCs ectopically expressing HA-tagged DNMT3A2. Vinculin was used as a loading control. Endogenous expression of the long isoform (DNMT3A1) and short isoform (DNMT3A2) are indicated. Data are representative of two independent experiments. b) ChIP-seq normalized reads of HA-tagged DNMT3A2 in sgDnmt3a mESCs wereplotted relative to in parental mESCs for 100kb non-overlapping bins (n = 26,181). Pearson’s correlation coefficient is indicated. c) Genome browser representation of ChIP-seq normalized reads for H3K36me2,H3K36me3, DNMT3A2, and DNMT3B in mESCs at Chr12: 86.6-87.5 Mb. Refseq genes are annotated at the bottom. Shaded areas indicate H3K36me2-enriched intergenic regions (orange) and H3K36me3-enriched genic regions (green) in parental cells. For H3K36me2 and DNMT3A2, ChIP-seq was performed once and an independent ChIP was performed in which genomic regions of selective enrichment and depletion were confirmed by qPCR. H3K36me3 and DNMT3B ChIP-seq were performed once. d) ChIP-seq normalized reads per 10kb bin for DNMT3A2 (y-axis) and DNMT3B (x-axis)in mESCs (n = 246,285). Each bin/dot was color-coded based on differences between H3K36me3 and H3K36me2 ChIP-seq reads to show selective enrichment for H3K36me2 (orange) or H3K36me3 (green). e) De novo methylation per bin by DNMT3A2 (brown) or DNMT3B (grey) uponreintroduction into DNMT triple knockout mESCs relative to H3K36me3. To generate bins, 1kb genomic tiles (n = 2,462,755) were ranked by H3K36me3 enrichment in mESCs and grouped into 1000 rank-ordered bins (2,463 tiles per group). Dashed line indicates H3K36me3 enrichment per bin. Goodness of fit was computed on a quadratic model (red line). For gel source data, see Supplementary Fig. 1.
Extended Data Figure 4:
Extended Data Figure 4:. Genetic ablation of Nsd1/2 in mMSCs and Nsd1 in mESCs
a) Immunoblots of lysates from parental and H3K36 methyltransferase knockout mMSCclonal lines for NSD1, NSD2, and SETD2. Vinculin was used as a loading control. b) Immunoblots of lysates from parental and sgNsd1 mESCs expressing HA-taggedDNMT3A. sgNsd1 cells were rescued with ectopic expression of wildtype (WT) or catalytic mutant (C2023A) NSD1. Vinculin was used as a loading control. c) Immunoblots of lysates generated from parental, sgSetd2, and sgNsd1/2 mMSCs forH3K36me3 and H3K36me2, with total H3 as a loading control. d) Ratios of ChIP-seq reads for H3K36me2/3 in mMSCs between target chromatin (Mouse) and reference spike-in chromatin (Drosophila). Data are representative of two independent experiments. e) Quantitative mass spectrometry measurement of the abundance of histone PTMs inacid-extracted histones derived from indicated mMSC lines from one experiment. f) Ratios of ChIP-seq reads for H3K36me2/3 in mESCs between target chromatin(Mouse) and reference spike-in chromatin (Drosophila) from one experiment. g) Density plots of H3K36me2 levels at intergenic (n = 1,165), exonic (n = 13,601), andintronic (n = 12,364) regions for parental (grey) and sgNsd1/2 (orange) mMSCs. Indicated p-values determined by Wilcoxon’s rank sum test (two-sided). h) Density plots of H3K36me2 levels at intergenic (n = 1,165), exonic (n = 13,601), andintronic (n = 12,364) regions for parental (grey) and sgNsd1 (orange) mESCs. Indicated p-values determined by Wilcoxon’s rank sum test (two-sided). The immunoblot data in a), b) and c) were independently repeated twice with similar results. For gel source data, see Supplementary Fig. 1.
Extended Data Figure 5:
Extended Data Figure 5:. H3K36me2 depletion impairs genomic targeting of DNMT3A and reduces intergenic CpG methylation
a) Immunoblots of lysates from parental, sgSetd2 and sgNsd1/2 mMSCs ectopically expressing HA-DNMT3A1 or -DNMT3B. β-tubulin was used as a loading control. b) Immunoblots of lysates from sgDnmt3a, parental, and sgNsd1 mESCs ectopically expressing HA-DNMT3A2 or -DNMT3B. Vinculin was used as a loading control. c) Genome browser representation of ChIP-seq normalized reads for H3K36me3,H3K36me2, and DNMT3A1 in parental and sgNsd1/2 mMSCs at Chr17: 87.9-88.7 Mb, as indicated. Levels of CpG methylation are depicted as a heat map (blue/low; white/intermediate; red/high). Refseq genes are annotated at the bottom. Shaded area indicates H3K36me2-enriched intergenic region in parental cells. For H3K36me2, H3K36me3, and DNMT3A1 in parental cells, data are representative of two independent ChIP-seq experiments. DNMT3A1 ChIP-seq in sgNsd1/2 cells and WGBS in both lines were performed once. d) Genome browser representation of ChIP-seq normalized reads for H3K36me3,H3K36me2, and DNMT3A2 in parental and sgNsd1 mESCs at Chr17: 87.9-88.7 Mb, as indicated. Levels of CpG methylation are depicted as a heat map (blue/low; white/intermediate; red/high). Refseq genes are annotated at the bottom. Shaded area indicates H3K36me2-enriched intergenic region in parental cells. For H3K36me2 and DNMT3A2, ChIP-seq was performed once and an independent ChIP was performed in which genomic regions of selective enrichment and depletion were confirmed by qPCR. WGBS and H3K36me3 ChIP-seq were performed once. e) Percent change of averaged CpG methylation between parental and sgNsd1/2mMSCs was plotted relative to changes in ChIP-seq normalized reads of H3K36me2 for 100kb non-overlapping bins (n = 25,611). Pearson’s correlation coefficient is indicated. f) Percent change of averaged CpG methylation between parental and sgNsd1 mESCswas plotted relative to changes in ChIP-seq normalized reads of H3K36me2 for 100kb non-overlapping bins (n= 26,044). Pearson’s correlation coefficient is indicated. g) The enrichment (% input) of H3K36me2 at various intergenic regions in parental(black) and sgNsd1 (orange) mESCs rescued with ectopic expression of wild-type (WT) or C2023A catalytic mutant (Mut) NSD1 was measured with ChIP-qPCR. Each data point represents a genomic locus (n = 10 for H3K36me2-enriched regions, n = 4 for H3K36me2-depleted regions). Data are mean ± SD. Indicated p-values were determined by one-way ANOVA. The immunoblot data in a) and b) were independently repeated twice with similar results. For gel source data, see Supplementary Fig. 1.
Extended Data Figure 6:
Extended Data Figure 6:. PWWP domain of DNMT3A preferentially binds to H3K36me2
a) The dCypher approach to interrogate chromatin readers (see Methods). Biotinylatednucleosomes are immobilized on Streptavidin donor beads and GST-tagged DNMT3APWWP on glutathione AlphaLISA acceptor beads. Laser excitation of the donor generates singlet oxygen that diffuses to activate emission from the acceptor: fluorescence counts are directly proportional to the amount of donor-acceptor bridged by the nucleosome-reader interaction. b) Quantification of AlphaLISA counts for isolated GST-DNMT3APWWP interaction titratedagainst H3K36-modified nucleosomes (me0/me1/me2/me3) from mean of two replicates. c) ITC titration and fitting curves of human DNMT3A PWWP domain with H3.3(1-42)K36-modified peptides (me0/me1/me2/me3). d) ITC titration and fitting curves of human DNMT3A PWWP domain with H3.1(1-42)K36-modified peptides (me0/me1/me2/me3) .
Extended Data Figure 7:
Extended Data Figure 7:. Redistribution of DNMT3A to H3K36me3-marked gene bodies upon loss of H3K36me2
a) Averaged ChIP-seq normalized signal across all gene bodies represented as log2fold change over input for DNMT3A1 (grey, n = 14,959) and DNMT3B (green, n = 14,959) in parental mMSCs, and for DNMT3A1 (orange, n = 14,311) in sgNsd1/2 mMSCs. b) Quantification of ChIP-seq normalized reads of DNMT3A1 in parental, sgNsd1/2, andTKO mMSCs at 10kb non-overlapping bins enriched for H3K36me3 in parental cells (top 20% of bins, n = 54,624). Reads were normalized by read depth. P-values were < 2.2 × 10⁻¹⁶ for all pair-wise comparisons as determined by Wilcoxon’s rank sum test (two-sided). Boxes represent median and 25th-75th percentiles, whiskers are minimum to maximum with discrete points representing outliers. c) Genome browser representation of ChIP-seq normalized reads for H3K36me2,H3K36me3, and DNMT3A1 in parental, sgNsd1/2, and TKO mMSCs at Chr10: 74.8-77.8 Mb, as indicated. Refseq genes are annotated at the bottom. Shaded areas indicate H3K36me3-enriched genic regions in parental cells. For H3K36me2 and H3K36me3, data in parental and sgNsd1/2 cells are representative of two independent ChIP-seq experiments. ChIP-seq in TKO cells for H3K36me2 and H3K36me3 were performed once. For DNMT3A1, data in parental cells is representative of two independent ChIP-seq experiments. ChIP-seq in sgNsd1/2 and TKO cells for DNMT3A1 was performed once. d) Immunoblots of lysates from parental, sgNsd1/2, and TKO mMSCs ectopically expressing HA-tagged wildtype (WT) or D333A mutant DNMT3A1. β-actin was used as a loading control. Data are representative of two independent experiments. e) Fold enrichment of wildtype (WT) or PWWP-mutated (D333A) DNMT3A1 at genebody versus intergenic regions in parental (black) and sgNsd1/2 (orange) mMSCs was measured with ChIP-qPCR. Each data point represents a genomic locus (n = 10). Data are mean ± SD. Indicated p-values determined by one-way ANOVA. For gel source data, see Supplementary Fig. 1.
Extended Data Figure 8:
Extended Data Figure 8:. Assessment of binding affinity between DNMT3B and H3K36me2 in vitro and in cells
a) Immunoblots of His/MBP-tagged recombinant PWWP domains of DNMT3A and DNMT3B. b) Immunoblots of recombinant His/MBP-tagged wild-type DNMT3A and DNMT3BPWWP domains bound to H3K36-modified recombinant nucleosomes following the in vitro pull-down assay. c) ChIP-seq normalized reads per bin for DNMT3A1 (grey) and DNMT3B (blue) inparental mMSCs and DNMT3B (red) in sgSetd2 mMSCs relative to H3K36me2. To generate bins, 1kb genomic tiles were ranked by H3K36me2 enrichment in parental mMSCs and grouped into 1000 rank-ordered bins. Dashed line indicates H3K36me2 enrichment per bin. d) Genome browser representation of ChIP-seq normalized reads for H3K36me2,H3K36me3, and DNMT3B in parental and sgSetd2 mMSCs at Chr10: 83.4-84.3 Mb, as indicated. Refseq genes are annotated at the bottom. Shaded areas indicate H3K36me2-enriched intergenic regions (orange) and H3K36me3-enriched genic regions (green) in parental cells. For H3K36me2 and H3K36me3, data are representative of two independent ChIP-seq experiments; for DNMT3B, ChIP-seq was performed once and an independent ChIP was performed in which genomic regions of selective enrichment and depletion were confirmed by qPCR. The immunoblot data in a) and b) were independently repeated twice with similar results. For gel source data, see Supplementary Fig. 1.
Extended Data Figure 9:
Extended Data Figure 9:. TBRS-associated DNMT3A mutations are loss-of-function and result in Sotos syndrome-like DNA hypomethylation
a) Immunoblots of recombinant His/MBP-tagged DNMT3A PWWP domain containingTBRS-associated mutations. MBP alone was used as a control. b) Immunoblots of soluble or chromatin-associated lysates generated from cellsectopically expressing HA-tagged wildtype (WT), or mutant (W297del or I310N) DNMT3A. β-tubulin and LaminB1 were used as loading controls for the soluble and chromatin-associated fractions, respectively. c) Immunoblots of lysates from parental mMSCs ectopically expressing HA-taggedwildtype (WT) or TBRS-mutant DNMT3A from one experiment. β-tubulin was used as a loading control. d) Immunoblots of nucleosomes bound to HA-tagged wildtype (WT) or mutant(W297del, I310N, or Y365C) DNMT3A after ChIP with anti-HA tag antibodies. Total H3 was used as a loading control and to normalize for differences in protein expression and nucleosome pull-down efficiency between samples. e) Genome browser representation of ChIP-seq normalized reads for H3K36me2,DNMT3A1 wildtype (WT), and DNMT3A1 I310N mutant in mMSCs at Chr13: 62.2-66.8 Mb. Levels of CpG methylation are depicted as a heat map (blue/low; white/intermediate; red/high). Refseq genes are annotated at the bottom. f) ChIP-seq normalized reads of DNMT3A1 wild-type or PWWP mutant (I310N) wereplotted relative to that of H3K36me2 for 100kb non-overlapping bins (WT: n = 25,694; I310N: n = 25,757). Pearson’s correlation coefficient is indicated. For H3K36me2 and DNMT3A1 WT, data are representative of two independent ChIP-seq experiments; for DNMT3A1 I310N, ChIP-seq was performed once and an independent ChIP was performed in which genomic regions of selective enrichment and depletion were confirmed by qPCR. WGBS was performed once. g) Unsupervised hierarchical clustering of publically available Infinium HumanMethylation 450K array profiles of blood samples from TBRS, Sotos and Weaver syndrome patients and controls, based on top 1000 most variable probes. h) Model depicting chromatin landscape changes in Sotos and Tatton-Brown-Rahman(TBRS) human developmental overgrowth syndromes. In normal development, DNMT3A and DNMT3B act in parallel to methylate CpG dinucleotides at H3K36me2-enriched intergenic and H3K36me3-enriched genic regions, respectively. Haploinsufficiency of NSD1 and depletion of intergenic H3K36me2 levels in Sotos syndrome abrogates PWWP-mediated intergenic recruitment of DNMT3A, leading to intergenic DNA hypomethylation and DNMT3A redistribution to H3K36me3-enriched gene bodies. Mutations within the PWWP domain of DNMT3A in TBRS impair chromatin occupancy and reduce cellular levels of the protein, thereby also resulting in intergenic DNA hypomethylation. The immunoblot data in a), c), and d) were independently repeated twice with similar results. For gel source data, see Supplementary Fig. 1.
Figure 1:
Figure 1:. Genome-wide co-localization of DNMT3A, CpG methylation and H3K36me2
a) Genome browser representation of ChIP-seq normalized reads for H3K36me3, H3K36me2, H3K27me3, H3K9me3, DNMT3A1, and DNMT3B in mMSCs at Chr2: 110.7-116.2 Mb. Levels of CpG methylation are depicted as a heat map (blue/low; white/intermediate; red/high). Refseq genes are annotated at the bottom. For H3K36me3, H3K36me2, and DNMT3A, data are representative of two independent ChIP-seq experiments; for H3K27me3, H3K9me3, and DNMT3B, ChIP-seq was performed once and an independent ChIP was performed in which genomic regions of selective enrichment and depletion were confirmed by qPCR. WGBS was performed once. b) Heat map showing pairwise Pearson correlation of 10kb bins (n = 246,285) between H3K36me2/3, H3K27me3, H3K27ac, H3K9me3, H3K4me1 and CpG methylation. c) ChIP-seq normalized reads per 10kb bin for DNMT3A1 (y-axis) and DNMT3B (x-axis) in mMSCs were plotted (n = 246,285). Each bin/dot was color-coded based on differences between H3K36me3 and H3K36me2 ChIP-seq reads to show selective enrichment for H3K36me2 (orange) or H3K36me3 (green). d) De novo methylation per bin by DNMT3A2 (brown) or DNMT3B (grey) upon reintroduction into DNMT triple knockout mESCs relative to H3K36me2 (n = 1,000). To generate bins, 1kb genomic tiles (n = 2,462,755) were ranked by H3K36me2 enrichment in mESCs and grouped into 1000 rank-ordered bins (2,463 tiles per group). Dashed line indicates H3K36me2 enrichment per bin. Goodness of fit was computed on a quadratic model (red line).
Figure 2:
Figure 2:. NSD1-mediated H3K36me2 is required for intergenic DNMT3A localization and CpG methylation
a) Difference in ChIP-seq normalized reads of DNMT3A1 between parental and sgNsd1/2 mMSCs was plotted relative to that of H3K36me2 for 10kb non-overlapping bins (n = 246,285). Each bin/dot was color-coded based on change of averaged CpG methylation to show lost (blue) or gained (red) CpG methylation in sgNsd1/2 cells. Pearson’s correlation coefficient is indicated. b) Histograms for CpG methylation at intergenic (n = 1,165), exonic (n = 13,601), and intronic (n = 12,364) regions for parental (grey) and sgNsd1/2 (orange) mMSCs. Indicated p-values determined by Wilcoxon’s rank sum test (two-sided). c) Difference in ChIP-seq normalized reads of DNMT3A2 between parental and sgNsd1 mESCs was plotted relative to that of H3K36me2 for 10kb non-overlapping bins (n = 246,285). Each bin/dot was color-coded based on change of averaged CpG methylation to show lost (blue) or gained (red) CpG methylation in sgNsd1 cells. Pearson’s correlation coefficient is indicated. d) Histograms for CpG methylation at intergenic (n = 1,165), exonic (n = 13,601), and intronic (n = 12,364) regions for parental (grey) and sgNsd1 (orange) mESCs. Indicated p-values determined by Wilcoxon’s rank sum test (two-sided). e) Immunoblots of lysates generated from parental and sgNsd1 mESCs for H3K36me2, with total H3 as a loading control. sgNsd1 cells were rescued with ectopic expression of wild-type (WT) or C2023A catalytic mutant (Mut) NSD1. Data are representative of two independent experiments. f) Fold enrichment of DNMT3A at various H3K36me2-enriched versus H3K36me2-depleted intergenic regions in parental (black) and sgNsd1 (orange) mESCs rescued with ectopic expression of wild-type (WT) or C2023A catalytic mutant (Mut) NSD1 was measured with ChIP-qPCR. Each data point represents a genomic locus (n = 10). Data are mean ± SD. Indicated p-values determined by one-way ANOVA. For gel source data, see Supplementary Fig. 1.
Figure 3:
Figure 3:. Preferential recognition of H3K36me2/3 by PWWP-domain of DNMT3A facilitates its localization
a) AlphaLISA counts for GST-DNMT3APWWP interaction with semi-synthetic modified nucleosomes from two replicates. b) Genome browser representation of ChIP-seq normalized reads for H3K36me2, H3K36me3, DNMT3A1, and DNMT3B in parental and sgNsd1/2 mMSCs at Chr10: 83.4-84.3 Mb. Levels of CpG methylation are depicted as a heat map (blue/low; white/intermediate; red/high). Refseq genes are annotated at the bottom. Shaded areas indicate H3K36me2-enriched intergenic regions (orange) and H3K36me3-enriched genic regions (green) in parental cells. Upon H3K36me2 depletion, DNMT3A is re-targeted to H3K36me3-enriched gene bodies (eg. Aldh1/2 and Appl2). For H3K36me2, H3K36me3, and DNMT3A1 in parental cells, data are representative of two independent ChIP-seq experiments. For DNMT3B in parental cells, ChIP-seq was performed once and an independent ChIP was performed in which genomic regions of selective enrichment and depletion were confirmed by qPCR. DNMT3A1 and DNMT3B ChIP-seq in sgNsd1/2 cells and WGBS in both lines were performed once. c) ChIP-seq normalized reads per bin for DNMT3A1 (blue) and DNMT3B (grey) in parental mMSCs and DNMT3A1 (red) in sgNsd1/2 mMSCs relative to H3K36me3. To generate bins, 1kb genomic tiles (n = 2,462,755) were ranked by H3K36me3 enrichment in mMSCs and grouped into 1000 rank-ordered bins (2,463 tiles per group). Dashed line indicates H3K36me3 enrichment per bin.
Figure 4:
Figure 4:. Impaired intergenic DNMT3A localization and CpG methylation in neoplastic and developmental overgrowth
a) Genome browser representation of ChIP-seq normalized reads for H3K36me2 in NSD1 wild-type (Cal27, Fadu) and NSD1 mutant (SCC-4, SKN-3) HNSCC cell lines at Chr5: 84.8-91.8 Mb. Levels of CpG methylation are depicted as a heat map (blue/low; white/intermediate; red/high). Refseq genes are annotated at the bottom. For H3K36me2 in Fadu and SKN-3 lines, data are representative of two independent ChIP-seq experiments. H3K36me2 ChIP-seq in Cal27 and SCC-4 lines and WGBS in all lines were performed once. b) Percent changes of averaged CpG methylation between NSD1 wildtype and mutant HNSCC cell lines were plotted relative to changes in ChIP-seq normalized reads of H3K36me2 for 100kb non-overlapping bins (n = 28,395). Pearson’s correlation coefficient is indicated. c) Left, table summarizing number of up- and down-regulated Infinium 450K DNA methylation array probes between NSD1 inactivated vs. NSD1 wild-type HNSCC tumor samples, and Sotos vs. control patient samples. Right, bar graph showing intergenic enrichment of DNA hypomethylated probes relative to all probes (n = 370,898). Indicated p-values determined by chi-squared test. d) Schematic of DNMT3A conserved structural domains with indicated TBRS-associated mutations. e) Immunoblots of recombinant His/MBP-tagged DNMT3A wild-type and mutant PWWP domains (Y365C, I310N, and W297del) bound to H3K36-modified recombinant nucleosomes following the in vitro pull-down assay. Data are representative of two independent experiments. For gel source data, see Supplementary Fig. 1.

References

    1. Li E, Bestor TH & Jaenisch R Targeted mutation of the DNA methyltransferase gene results in embryonic lethality. Cell 69, 915–926 (1992). - PubMed
    1. Okano M, Bell DW, Haber DA & Li E DNA methyltransferases Dnmt3a and Dnmt3b are essential for de novo methylation and mammalian development. Cell 99, 247–257 (1999). - PubMed
    1. Wu H et al. Dnmt3a-Dependent Nonpromoter DNA Methylation Facilitates Transcription of Neurogenic Genes. Science 329, 444–448 (2010). - PMC - PubMed
    1. Challen GA et al. Dnmt3a is essential for hematopoietic stem cell differentiation. Nat. Genet 44, 23–31 (2011). - PMC - PubMed
    1. Ley TJ et al. DNMT3A mutations in acute myeloid leukemia. N. Engl. J. Med 363, 2424–2433 (2010). - PMC - PubMed

Methods References

    1. Sidoli S, Bhanu NV, Karch KR, Wang X & Garcia BA Complete Workflow for Analysis of Histone Post-translational Modifications Using Bottom-up Mass Spectrometry: From Histone Extraction to Data Analysis. J Vis Exp. 111, e54112 (2016). - PMC - PubMed
    1. Yuan ZF et al. EpiProfile 2.0: A Computational Platform for Processing Epi-Proteomics Mass Spectrometry Data. J Proteome Res. 17, 2533–2541 (2018). - PMC - PubMed
    1. Li H & Durbin R Fast and accurate short read alignment with Burrows-Wheeler transform. Bioinformatics 25, 1754–1760 (2009). - PMC - PubMed
    1. Quinlan AR & Hall IM BEDTools : a flexible suite of utilities for comparing genomic features. Bioinformatics 26, 841–842 (2010). - PMC - PubMed
    1. Robinson JT et al. Integrative genomics viewer. Nature Biotechnology 29, 24–26 (2011). - PMC - PubMed

Publication types