. 2019 Sep;573(7774):375-380.
doi: 10.1038/s41586-019-1523-6. Epub 2019 Sep 4.

A unified mechanism for intron and exon definition and back-splicing

Affiliations

A unified mechanism for intron and exon definition and back-splicing

Xueni Li et al. Nature. 2019 Sep.

Abstract

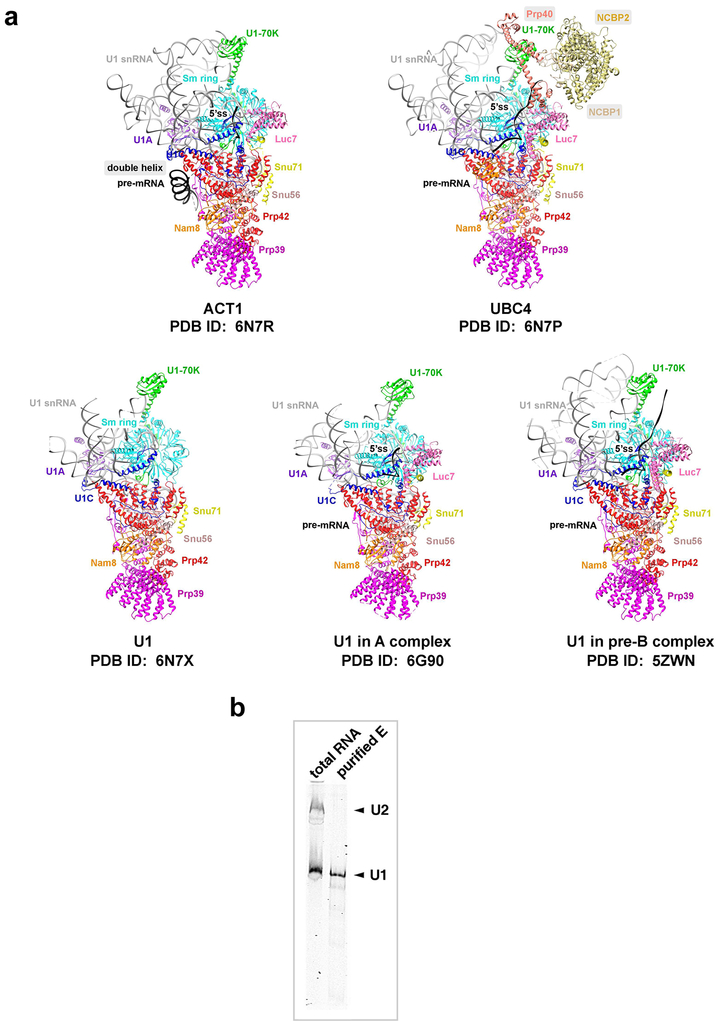
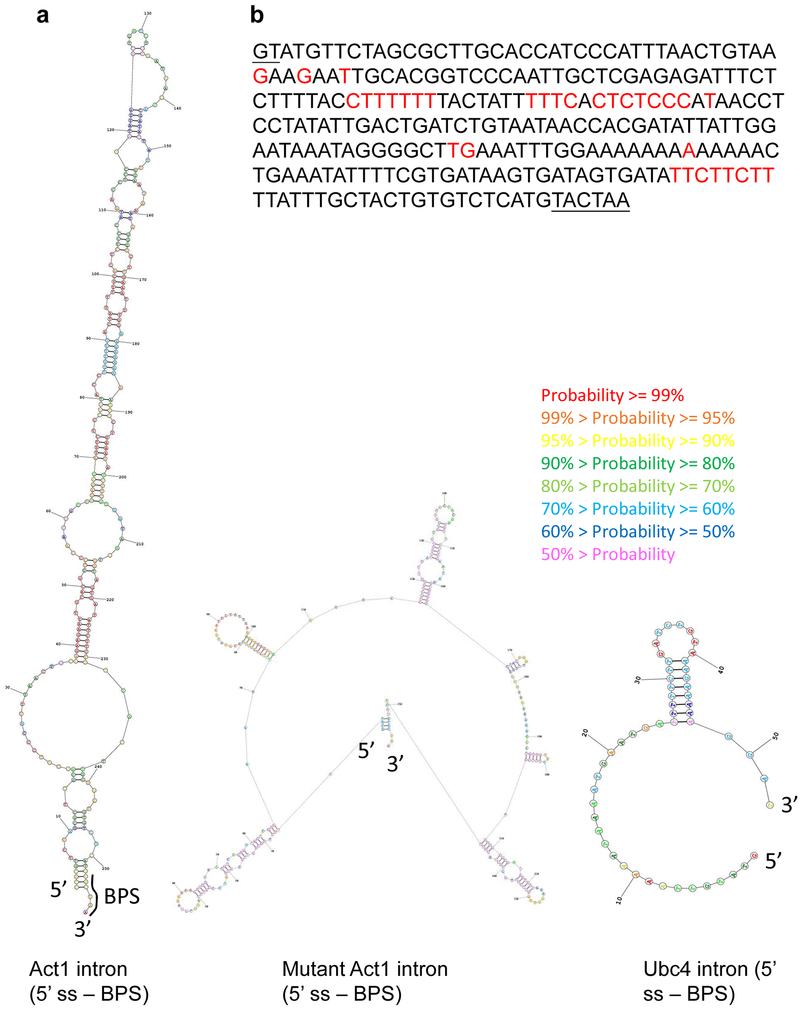
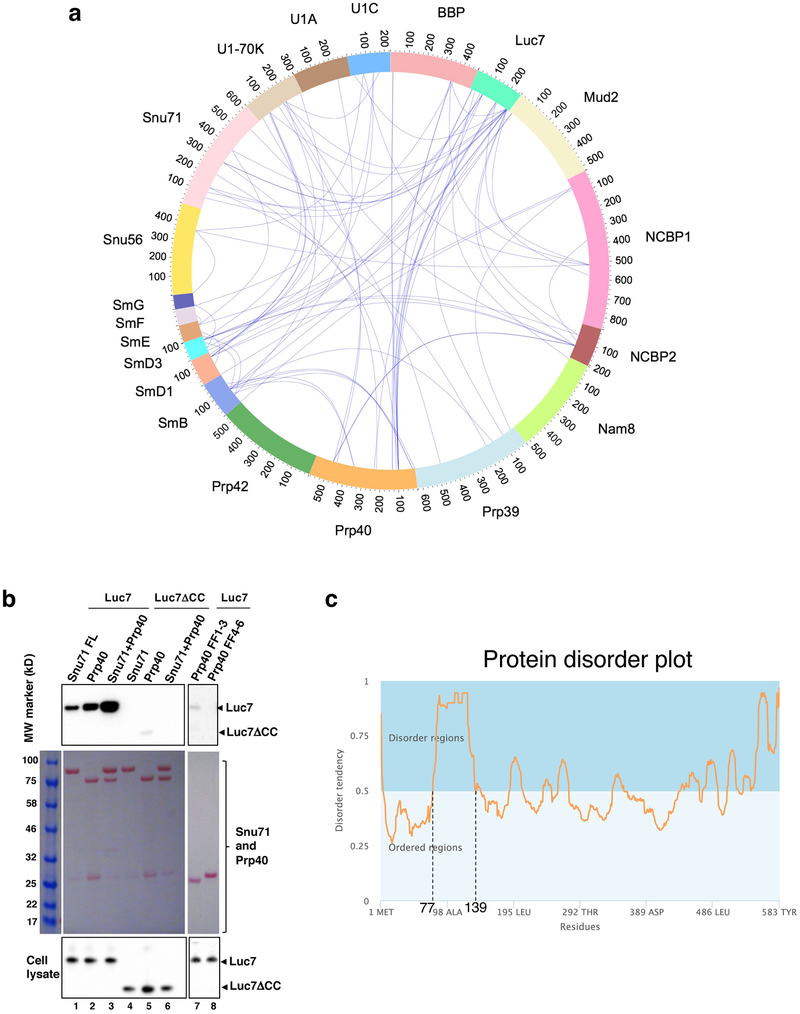
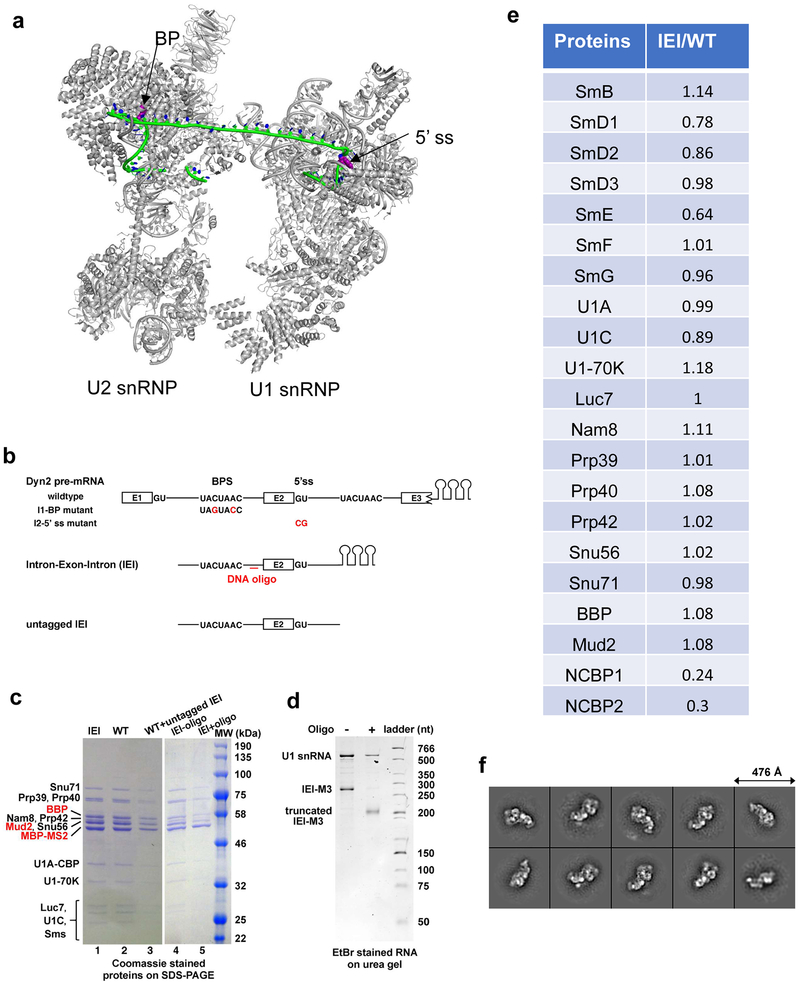
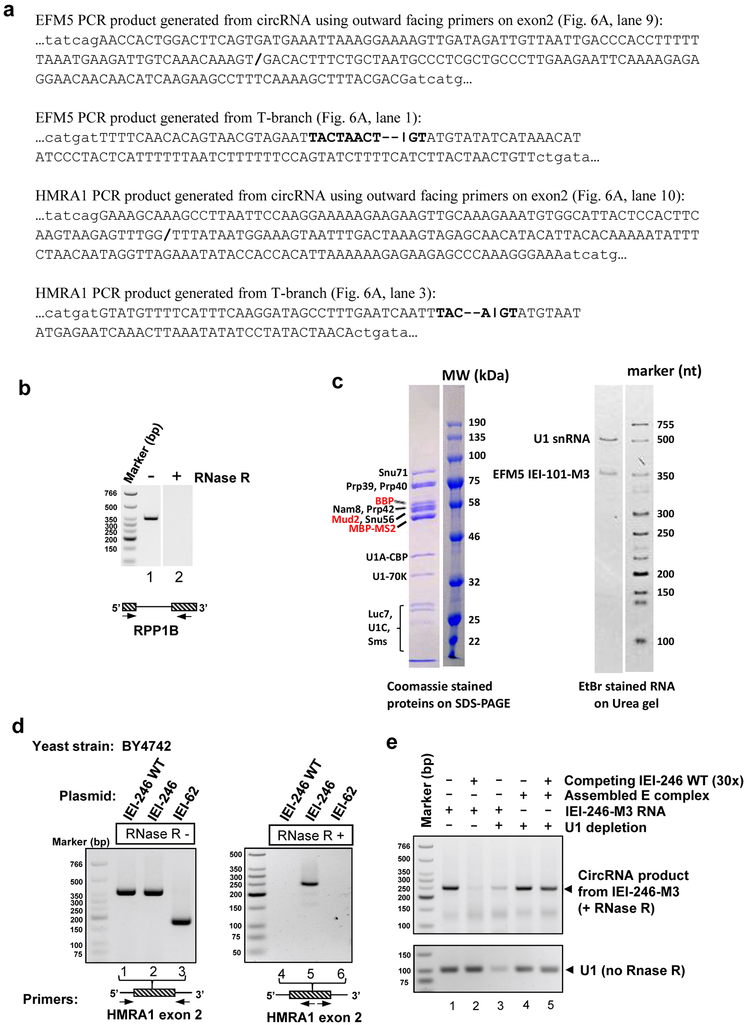
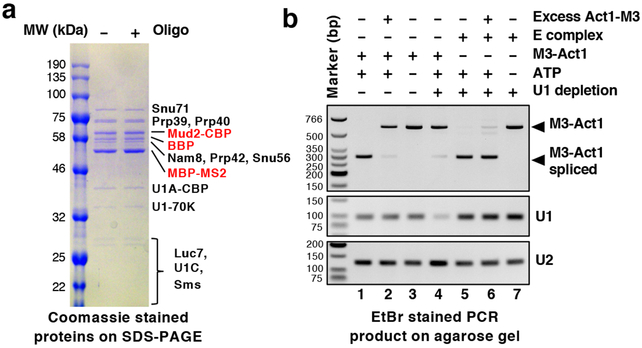
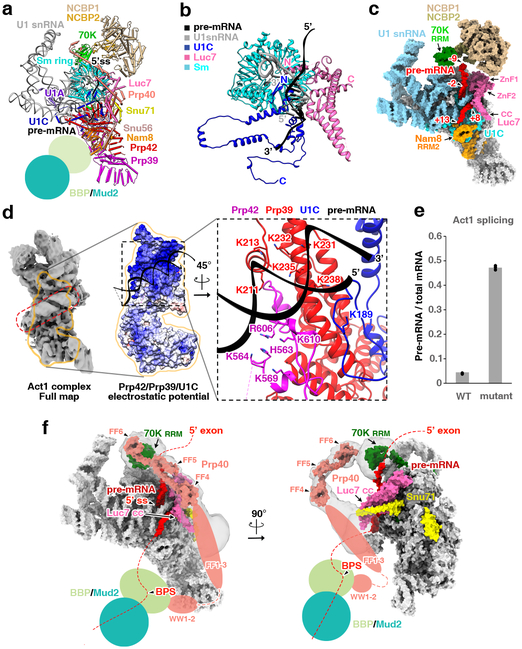
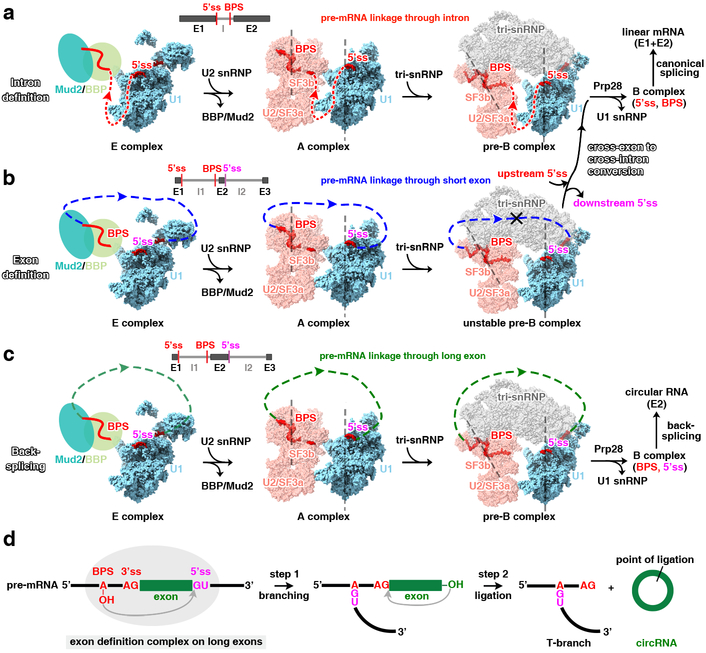
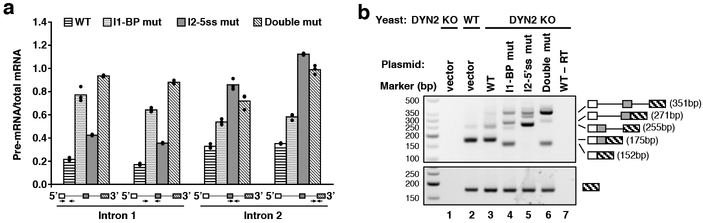
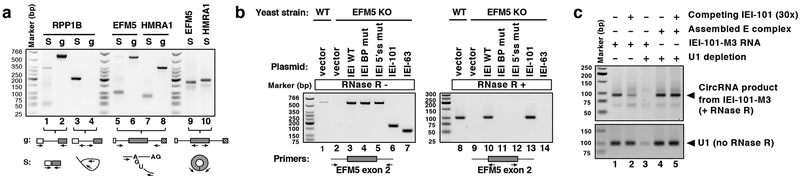
The molecular mechanisms of exon definition and back-splicing are fundamental unanswered questions in pre-mRNA splicing. Here we report cryo-electron microscopy structures of the yeast spliceosomal E complex assembled on introns, providing a view of the earliest event in the splicing cycle that commits pre-mRNAs to splicing. The E complex architecture suggests that the same spliceosome can assemble across an exon, and that it either remodels to span an intron for canonical linear splicing (typically on short exons) or catalyses back-splicing to generate circular RNA (on long exons). The model is supported by our experiments, which show that an E complex assembled on the middle exon of yeast EFM5 or HMRA1 can be chased into circular RNA when the exon is sufficiently long. This simple model unifies intron definition, exon definition, and back-splicing through the same spliceosome in all eukaryotes and should inspire experiments in many other systems to understand the mechanism and regulation of these processes.


Figures

Extended Data Figure 1.
Extended Data Figure 1.. In vitro assembly and purification of the Act1 complex.
(a) A schematic representation of the Act1 pre-mRNA tagged with three MS2-binding sites (M3-Act1) used for E complex assembly and purification. Boxes represent exon 1 (E1) and truncated exon 2 (E2). The 5’ ss (GU) and BPS (UACUAAC) are also shown. The red line represents the DNA oligo complementary to a region 5nt upstream of the BPS for the RNase H cleavage experiment. (b) RNA components of the assembled E complex (with or without DNA oligo and RNase H treatment) after proteinase K digestion are shown on a denaturing urea gel or native agarose gel. These results demonstrate that RNase treatment cleaved M3-Act1 into two fragments. Note that the sizes of RNA on the native gel do not match their linear length, possibly due to the existence of secondary structures. This experiment was repeated two additional times with similar results.
Extended Data Figure 2.
Extended Data Figure 2.. The CryoEM structural determination process for the Act1 complex.
(a) A representative drift-corrected cryoEM micrograph (out of a total of 11,283 images) of the E complex assembled on the Act1 pre-mRNA. A representative particle is shown in a white dotted circle. (b) Representative 2D class averages of the Act1 complex obtained in RELION. This experiment was repeated one additional time with similar results. (c) Data processing workflow. For processing above the red dash line, the particle images were binned to a pixel size of 2.72 Å. The rest of processing was performed with a pixel size of 1.36 Å. The masks used in data processing are outlined with red solid line. Please refer to Methods for more details. (d) Angular distribution for all particles used for the final 3.2 Å map of the Act1 complex. (e) FSC as a function of spatial frequency demonstrating the resolution for the final reconstruction of the Act1 complex. (f) Resmap local resolution estimation. (g) FSC coefficients as a functional of spatial frequency between model and cryoEM density maps. The generally similar appearances between the FSC curves obtained with half maps with (red) and without (blue) model refinement indicate that the refinement of the atomic coordinates did not suffer from severe over-fitting.
Extended Data Figure 3.
Extended Data Figure 3.. The CryoEM structural determination process for the Ubc4 complex.
(a) A representative drift-corrected cryoEM micrograph (out of a total of 8,997 micrographs) of the E complex assembled on the Ubc4 pre-mRNA. A representative particle is shown in a white dotted circle. (b) Representative 2D class averages of the Ubc4 complex obtained in RELION. (e) 2D classification of negative-stain TEM images of the E complex assembled on Dyn2 IEI pre-mRNA. This experiment was repeated one additional time with similar results. (c) Data processing workflow. For processing above the red dash line, the particle images were binned to a pixel size of 2.72 Å. The rest of processing was performed with a pixel size of 1.36 Å. The masks used in data processing are outlined with red solid line. Please refer to Methods for more details. (d) Angular distribution for all particles used for the final 3.6 Å map of the Ubc4 complex. (e) FSC as a function of spatial frequency demonstrating the resolution for the final reconstruction of the Ubc4 complex. (f) Resmap local resolution estimation. (g) FSC coefficients as a functional of spatial frequency between model and cryoEM density maps. The generally similar appearances between the FSC curves obtained with half maps with (red) and without (blue) model refinement indicate that the refinement of the atomic coordinates did not suffer from severe over-fitting.
Extended Data Figure 4.
Extended Data Figure 4.. Representative cryoEM density maps of the E complex.
Panels (a-i) are densities for the Ubc4 complex and (j) is density for the Act1 complex. The cryoEM density maps are shown for (a) selected regions of U1 snRNA; (b) C-terminal region of Prp39; (c) N-terminal domain of Snu71; (d) the pre-mRNA and U1 snRNA duplex; (e) U1C ZnF domain; (f) Luc7 ZnF2 domain; (g) the tandem FF domains of Prp40 (known structures of tandem FF domains from CA150 are also shown with the characteristic boomerang-shape); (h) the RRM2 domain of Nam8; (i) NCBP1 and NCBP2; (j) the weak density in the Act1 complex that is assigned as the putative BBP/Mud2 heterodimer. The A complex is also shown, with U1 snRNP in the same orientation as the Act1 complex and U2 snRNP located in similar positions as the BBP/Mud2 heterodimer with respect to U1 snRNP. The map of Act1 complex was low-pass filtered to 40 Å.
Extended Data Figure 5.
Extended Data Figure 5.. Structural and biochemical characterization of the Act1 and Ubc4 complexes.
(a) Comparison of the ribbon models of the Act1 complex, the Ubc4 complexes, and U1 snRNP from other previously determined structures (the U1 snRNP, A, and pre-B complex). Labels in shade indicate protein or RNA components that are different between the Act1 and Ubc4 complexes. These components and the RRM2 domain of Nam8 are also absent from previously determined structures. Note that U1-70K is shifted towards NCBP2 in the Ubc4 complex. (b) Purified E complex does not contain U2 snRNA. A native polyacrylamide gel shows the solution hybridization (78) result of total cellular RNA or RNA from purified E complex hybridized with fluorescent probes specific for U1 and U2 snRNAs. This experiment was repeated one additional time with similar results.
Extended Data Figure 6.
Extended Data Figure 6.. Secondary structures in the region between the 5’ ss and BPS in the WT and mutant Act1 and Ubc4 pre-mRNAs.
(a) Secondary structures predicted by RNAstructure 6.0 (https://rna.urmc.rochester.edu/RNAstructureWeb/). (b) Sequence between the 5’ ss and BPS (underlined) of Act1. Red nucleotides were mutated to A (other than the one A which was mutated to G) in the mutant Act1 to disrupt predicted secondary structures.
Extended Data Figure 7.
Extended Data Figure 7.. Protein interactions in the Ubc4 complex.
(a) DSSO crosslinking and mass spectrometry analyses of the Ubc4 complex. Each blue line indicate crosslinks observed between a pair of Lys residues. Note that BBP/Mud2 are crosslinked to Luc7, Prp40, Snu56, and Snu71. (b) Co-purification assays probing the interaction between Snu71 (or Prp40) and Luc7. Various combinations of protein A-TEV-Prp40, protein A-TEV-Snu71, and CBP-tagged Luc7 or Luc7ΔCC [coiled coil domain (residues 123-190) of Luc7 deleted] were co-overexpressed in yeast (only Snu71 is protein A tagged in the Snu71+Prp40 lanes), purified using IgG resin, eluted through TEV cleavage, analyzed on SDS-PAGE, and visualized using both Western blot with an anti-CBP antibody to detect Luc7 (top) and Ponceau S stain to show Snu71 or Prp40 (middle). Western blot using the same anti-CBP antibody was used to demonstrate Luc7 expression levels in cell lysates (bottom). The faint band around 26 kD in all lanes is TEV. This experiment was repeated one additional time with similar results. (c) The linker (residues 73-131) between the WW and FF domains of Prp40 is predicted to be disordered using program MetaDisorderMD2 (79).
Extended Data Figure 8.
Extended Data Figure 8.. Computational and biochemical characterization of the EDC.
(a) The minimal length of RNA needed to connect the upstream BP and downstream 5’ ss in the A complex is modeled using the Rosetta RNP-denovo method. The A complex (PDB ID 6g90) is shown in grey. The pre-mRNA is shown in green. The upstream BP and downstream 5’ ss are shown in purple space filling models. 28 nucleotides are sufficient to connect the upstream BP and downstream 5’ ss (not including the BP and 5’ ss themselves) without any chainbreak and clashes. (b) Schematics of the Dyn2 pre-mRNA WT and mutants (mutated nucleotides shown in red), IEI, and untagged IEI used for the EDC assembly and in vivo exon definition experiments. Stem-loops represent the MS2 binding sites, and the red line represents the DNA oligo used for RNase H cleavage. (c) SDS-PAGE shows protein components of complexes assembled on WT and IEI substrates (lanes 1-2), on WT in the presence of competing untagged IEI (lane 3), and on IEI after RNase H treatment in the absence and presence of the DNA oligo (lanes 4-5). This experiment was repeated one additional time with similar results. (d) RNA components of the same complexes as in lanes 4-5 of (b), confirming that RNase H treatment + oligo indeed cleaves the pre-mRNA. The smaller cleaved fragment (61 nucleotides) is difficult to see since EtBr has a low efficiency staining short single stranded RNA. This experiment was repeated two additional times with similar results. (e) Mass spectrometry analyses of spliceosome assembled on the Dyn2 IEI and WT pre-mRNA indicate that the two complexes have the same components in similar quantities with the exception of NCBP1 and 2 which are absent from the IEI complex. (f) 2D classification of negative-stain TEM images of the E complex assembled on Dyn2 IEI pre-mRNA. This experiment was repeated one additional time with similar results.
Extended Data Figure 9.
Extended Data Figure 9.. Characterization of circRNAs.
(a) Sanger sequencing confirmed that the PCR products in Figure 5A were derived from T-branches and circRNAs of EFM5 and HMRA1. “/” shows where two ends of exon 2 are ligated. “∣” shows where the 5’ ss of intron 2 is ligated to the BP of intron 1. The 5’ ss and BPS are shown in bold. The BPS contains deletions (show as -) due to errors caused by reverse transcriptase reading through the branch. (b) RT-PCR was carried out on RNA extracted from WT yeast cells with or without RNaseR treatment using primers indicated in the schematic diagrams below the gel, indicating that RNase R treatment eliminates linear RNAs. This experiment was repeated four additional times with similar results. (c) Protein and RNA components of E complex assembled on EFM5 IEI-101-M3 pre-mRNA. (d) RT-PCR of RNA extracted from BY4742 yeast strain carrying indicated HRMA1 plasmids, with or without RNaseR treatment, using primers shown in the schematic diagrams below the gel. Numbers 246 and 62 designate exon lengths. Lanes 1-3 indicate all constructs were transcribed (endogenous HMRA1 pre-mRNA level is too low to be detected as indicated in lane 3). The HMRA1 middle exon was slightly modified to create a circRNA primer binding site so that only the modified exogenous (e.g., IEI-246 in lane 5) but not WT HMRA1 circRNA (IEI-246 WT in lane 4) can be detected. (e) IEI-246-M3 (3xMS2 at the 3’ end) RNA or E complex assembled on IEI-246-M3 was incubated with WT or U1-depleted yeast extract in the absence or presence of 30-fold excess competing IEI-246 WT RNA. CircRNA products were monitored using RT-PCR the same way as (d). Experiments in (c) - (e) were repeated one additional time with similar results.
Fig. 1.
Fig. 1.. In vitro assembled E complex is functional.
(a) The assembled E complex (with or without DNA oligo-directed RNase H treatment to cleave between the 5’ ss and BPS) is purified using the MS2 tag on pre-mRNA and its protein components shown. (b) Yeast splicing extract with or without U1 snRNA depletion is incubated with in vitro transcribed M3-Act1 or E complex assembled on M3-Act1 in the presence or absence of ATP or excess Act1-M3 (top gel). The splicing outcome is monitored using RT-PCR with primers located in the MS2 binding site region and exon 2 of M3-Act1. The middle and bottom gels demonstrate levels of U1 and U2 snRNA in each sample. Experiments in Fig. 1 were repeated two additional times with similar results. For all gel source data in this paper, see Supplementary Figure 1.
Fig. 2.
Fig. 2.. CryoEM structure of the E complex.
(a) The overall E complex structure. BPP/Mud2 are not modeled due to weak density, but their locations are indicated. (b) Ribbon diagrams of protein and RNA models immediately around the 5’ss. (c) Surface representation of proteins that are in close proximity to the 5’ ss (colored), other proteins (grey), and U1 snRNA (cyan). Pre-mRNA is shown in red and nucleotide positions relative to the 5’ ss are labeled (−1 and +1 denote the last nt of the exon and the first nt of the intron, respectively). (d) Secondary structure in pre-mRNA. Left: CryoEM density map (filtered to 6 Å) of the entire E complex showing density (in red dashed box) for the pre-mRNA double helix. Middle: Electrostatic potentials of the binding surface for the pre-mRNA double helix. Right: The binding surface formed by Prp39, Prp42, and U1C is shown in ribbon diagrams. Positively charged residues on Prp39 and Prp42 that interact with this double helix are shown in sticks. (e) Splicing efficiency of the WT and mutant Act1 intron (that disrupts the secondary structure in the 5’ ss to BPS region) in an Act1-Cup1 reporter plasmid, as evaluated by qRT-PCR. Dots represent three technical replicates. This experiment was repeated two additional times with similar results. (f) Surface representation of proteins that interact or possibly interact with Prp40 are shown in different colors. Locations of proteins or protein domains not modeled due to weak densities are indicated by various shapes. Transparent grey areas are 8 Å low-pass filtered densities showing likely contacts between Prp40 and U1-70K. Red dashed lines represent hypothetical paths of the pre-mRNA.
Fig. 3.
Fig. 3.. A unified model for intron definition, exon definition, and back-splicing.
(a) Structures of the E, A, and pre-B complexes are shown in surface representations with U1, U2, and tri-snRNPs in different colors, illustrating the canonical assembly pathway across an intron. Pre-mRNA is shown in red with an arrow indicating the 5’ to 3’ direction. Red dashed line indicates the hypothetical path of intron connecting the 5’ ss and downstream BPS. Vertical dash lines are drawn to denote the orientation of U1 snRNP and U2 SF3b in the A complex. In the pre-B complex, the orientation of U1 snRNP remains the same but that of U2 SF3b is tilted about 30°. (b) The same spliceosomal E and A complexes as in (A) can assemble across an exon, but cannot form the pre-B complex on short exons due to steric hindrance. Blue dashed line indicates the hypothetical path of exon connecting the BPS and downstream 5’ ss. (c) Same as (b), but with a long exon (green dashed line), illustrating that the EDC on long exons can catalyze back-splicing. (d) A schematic representation showing how the EDC on a long exon carries out back-splicing and generates circular RNA through the same transesterification reactions used by canonical splicing.
Fig. 4.
Fig. 4.. Exon definition occurs in yeast.
(a) A plasmid containing the WT DYN2 gene or various mutants was transformed into a DYN2 KO strain. The splicing efficiency of intron 1 and 2 were evaluated using qRT-PCR with primers specific for intron 1 or intron 2 (indicated by arrows in the schematics under the bar diagram) normalized to total mRNA. Dots represent three technical replicates. (b) RT-PCR of RNA extracted from yeast strain carrying indicated plasmids, using primers located in exons 1 and 3 of Dyn2. A schematic of the splicing product and their expected sizes are shown on the right side of the gel. RT-PCR products using primers in exon 3 (bottom gel) serve as an internal quality control of the samples. Experiments in Fig. 4 were repeated two additional times with similar results.
Fig. 5.
Fig. 5.. The EDC catalyzes back-splicing and produces circRNA.
(a) RT-PCR of RNA isolated from spliceosome purified from the Prp22H606A yeast strain (indicated by “S”) and PCR using yeast genomic DNA (indicated by “g”, as negative controls) for single intron gene RPP1B and multi-intronic genes EFM5 and HMRA1 demonstrate the presence of ligated exons (lane 1), lariat (lane 3), T-branches (lanes 5 and 7) and circRNA (lanes 9-10). Primer positions are indicated as arrows in the schematic diagrams below the gel. All images in Fig. 5 are RT-PCR/PCR products on agarose gel with EtBr staining. (b) RT-PCR of RNA extracted from WT or EFM5 KO strain carrying indicated plasmid, with or without RNaseR treatment, using primers shown in the schematic diagrams below the gel. Numbers 101 and 63 designate exon lengths. “mut” represents mutant. Lanes 1-7 indicate all EFM5 constructs are transcribed. (c) IEI-101-M3 (3xMS2 at the 3’ end) RNA or E complex assembled on IEI-101-M3 was incubated with splicing extract with or without U1 snRNA depletion in the absence or presence of 30-fold excess competing IEI-101 RNA. CircRNA products were monitored the same way as (b). Competing IEI-101 was modified to remove the primer binding sites so it is invisible in the RT-PCR reaction. Experiments in (a), (b), and (c) were repeated one, two, and two additional times, respectively, with similar results.

Comment in

Similar articles

Cited by

References

    1. Zhang L, Vielle A, Espinosa S & Zhao R RNAs in the spliceosome: Insight from cryoEM structures. Wiley interdisciplinary reviews. RNA 10, e1523, doi:10.1002/wrna.1523 (2019). - DOI - PMC - PubMed
    1. Wan R, Bai R, Yan C, Lei J & Shi Y Structures of the Catalytically Activated Yeast Spliceosome Reveal the Mechanism of Branching. Cell, doi:10.1016/j.cell.2019.02.006 (2019). - DOI - PubMed
    1. De Conti L, Baralle M & Buratti E Exon and intron definition in pre-mRNA splicing. Wiley interdisciplinary reviews. RNA 4, 49–60, doi:10.1002/wrna.1140 (2013). - DOI - PubMed
    1. Berget SM Exon recognition in vertebrate splicing. J Biol Chem 270, 2411–2414 (1995). - PubMed
    1. Sharma S, Kohlstaedt LA, Damianov A, Rio DC & Black DL Polypyrimidine tract binding protein controls the transition from exon definition to an intron defined spliceosome. Nat Struct Mol Biol 15, 183–191, doi:10.1038/nsmb.1375 (2008). - DOI - PMC - PubMed

Publication types

MeSH terms

Substances