. 2019 Oct 6;9(5):20190021.
doi: 10.1098/rsfs.2019.0021. Epub 2019 Aug 16.

Quantifying the impact of tissue metabolism on solute transport in feto-placental microvascular networks

Affiliations

Quantifying the impact of tissue metabolism on solute transport in feto-placental microvascular networks

Alexander Erlich et al. Interface Focus. .

Abstract

The primary exchange units in the human placenta are terminal villi, in which fetal capillary networks are surrounded by a thin layer of villous tissue, separating fetal from maternal blood. To understand how the complex spatial structure of villi influences their function, we use an image-based theoretical model to study the effect of tissue metabolism on the transport of solutes from maternal blood into the fetal circulation. For solute that is taken up under first-order kinetics, we show that the transition between flow-limited and diffusion-limited transport depends on two new dimensionless parameters defined in terms of key geometric quantities, with strong solute uptake promoting flow-limited transport conditions. We present a simple algebraic approximation for solute uptake rate as a function of flow conditions, metabolic rate and villous geometry. For oxygen, accounting for nonlinear kinetics using physiological parameter values, our model predicts that villous metabolism does not significantly impact oxygen transfer to fetal blood, although the partitioning of fluxes between the villous tissue and the capillary network depends strongly on the flow regime.

Keywords: human placenta; metabolism; microcirculation; solute transport.


Conflict of interest statement

The authors declare that they have no competing interests.

Figures

Figure 1.
Figure 1.
Features of transport of a generic solute in a terminal villus, assuming first-order kinetics. (a,b) Concentration fields in tissue are shown in a slice through specimen 3 under diffusion-limited and flow-limited conditions at metabolic rate α = 10 s−1. The villous surface is fully oxygenated due to the condition c = cmat on Γvil (shown in dark red). Vessel cross-sections appear as white inclusions. (a) In the extreme diffusion-limited case, c = 0 at the capillary surface, Γcap. (b) In the extreme flow-limited case, nc=0 at Γcap. (c) Concentration slices (over part of the same surface shown in a, b) for the diffusion-limited case, with uptake rate α ranging over two orders of magnitude. Concentration boundary layers form at the villous surface Γvil as α increases. (d) ‘Hotspots’ emerge with increasing metabolism: only where Γcap and Γvil are in close proximity can solute penetrate to capillaries. The top figure shows the capillary surface Γcap of specimen 3 in the same spatial orientation as panels a, b, with vessel cross-sections shown in white. Colours show the concentration at Γcap for the extreme flow-limited case. The lower panel shows a different projection of the same simulation. (Online version in colour.)
Figure 2.
Figure 2.
Symbols show predictions of computational simulations of the full advection–diffusion–uptake problem (appendix A); curves show predictions of the simple regression equation (3.2). The four panels show results for the four vasculatures used in [9]; capillaries and the villous surface are illustrated by insets for each case in orange and blue, respectively. Each panel shows the net uptake N as a function of the inlet–outlet pressure drop ΔP, for no solute uptake (α = 0, identical with fig. 2 in [9]) and increasing uptake (α = 1, 10 s−1; Dt = 1.7 × 10⁻⁹ m2 s−1). (Online version in colour.)
Figure 3.
Figure 3.
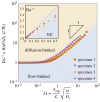
Flow-limited and diffusion-limited regimes in the presence of metabolism. The curves show for all four specimens the location where flow-limited and diffusion-limited regimes balance (which we define by Da−1 = F/G), as a function of the non-dimensional uptake parameter U. For weak uptake (U1), Da−1 ≈ 1; for strong uptake (U1), Da1U. The boundary between flow-limited and diffusion-limited regimes should be understood as a smooth transition, indicating where contributions of both regimes are of comparable strength. The curves for all four specimens collapse appreciably. The inset illustrates how, when uptake is weak, the boundary between flow- and diffusion-limited uptake is approximated more precisely by Da11+W (dashed line), highlighting W as a significant dimensionless measure of uptake in this regime. Geometric parameters are reported in table 3. (Online version in colour.)
Figure 4.
Figure 4.
The effect of nonlinear uptake kinetics on solute transport. (a) The coloured symbols show the solute uptake N which is delivered to the fetus, plotted against the inlet–outlet pressure drop ΔP, for specimen 3. For comparison, the solid lines with matched colours show the solute metabolized by villous tissue for the same specimen. All curves are plotted for the same maximum rate of oxygen metabolism qmax = 0.1 mol/(m3 · s), which we identify as a physiological value in metabolizing tissue (table 1). The different curves show changes in the parameter c50, spanning from predominantly zeroth-order (red symbols and curve) to predominantly first-order (yellow symbols and curve) uptake kinetics. Intersections in the inset, marked P1 and P2, show where the metabolized oxygen flux balances the flux delivered to fetal blood. (b) The flux partitioning ratio Ntissue/Ntotal of the solute flux metabolized by the villous tissue to the total flux of solute entering the terminal villus (for c50/cmat = 0.02; see appendix A). The flux partitioning ratio depends strongly on the flow regime. (Online version in colour.)
Figure 5.
Figure 5.
Computational domain of specimen 1, and boundary surfaces Γ. (a) The domain occupied by blood vessels Ωb is bounded by the inlet and outlet surfaces Γin and Γout (red) and the capillary surface Γcap (yellow). (b) The domain occupied by villous tissue Ωt is bounded by the capillary surface Γcap, the no-flux surface Γ0 and the villous surface Γvil (blue). (Online version in colour.)
Figure 6.
Figure 6.
Oxygen metabolism kinetics in the human placenta ex vivo. (a) Tissue oxygen partial pressure decay after the cessation of flow in two dually perfused placentas; inset shows the dual perfusion set-up, with maternal (m) and fetal (f) cannulas and the optical sensor probe (p). (b) Fitted (equation (C 1), solid) versus measured (circles) oxygen metabolic rates. See Methods and appendix C for more details. (Online version in colour.)
Figure 7.
Figure 7.
Metabolic scale functions computed for specimen 3. By definition, F = 1 and G = 1 for the case of no metabolism, α = 0. The points result from finite-element calculations and the lines connecting the points are meant as visual guides. (Online version in colour.)

Similar articles

Cited by

References

    1. Burton GJ, Fowden AL. 2015. The placenta: a multifaceted, transient organ. Phil. Trans. R. Soc. B 370, 20140066 (10.1098/rstb.2014.0066) - DOI - PMC - PubMed
    1. Horikoshi M. et al. 2016. Genome-wide associations for birth weight and correlations with adult disease. Nature 538, 248–252. (10.1038/nature19806) - DOI - PMC - PubMed
    1. Roth CJ, Haeussner E, Ruebelmann T, Koch FV, Schmitz C, Frank H-G, Wall WA. 2017. Dynamic modeling of uteroplacental blood flow in IUGR indicates vortices and elevated pressure in the intervillous space – a pilot study. Sci. Rep. 7, 40771 (10.1038/srep40771) - DOI - PMC - PubMed
    1. Perazzolo S, Lewis R, Sengers B. 2017. Modelling the effect of intervillous flow on solute transfer based on 3D imaging of the human placental microstructure. Placenta 60, 21–27. (10.1016/j.placenta.2017.10.003) - DOI - PubMed
    1. Pearce P, Brownbill P, Janácek J, Jirkovská M, Kubínová L, Chernyavsky IL, Jensen OE. 2016. Image-based modeling of blood flow and oxygen transfer in feto-placental capillaries. PLoS ONE 11, e0165369 (10.1371/journal.pone.0165369) - DOI - PMC - PubMed

LinkOut - more resources