. 2019 Aug 22:16:100434.
doi: 10.1016/j.conctc.2019.100434. eCollection 2019 Dec.

Statistical considerations for testing an AI algorithm used for prescreening lung CT images

Affiliations

Statistical considerations for testing an AI algorithm used for prescreening lung CT images

Nancy A Obuchowski et al. Contemp Clin Trials Commun. .

Erratum in

Abstract

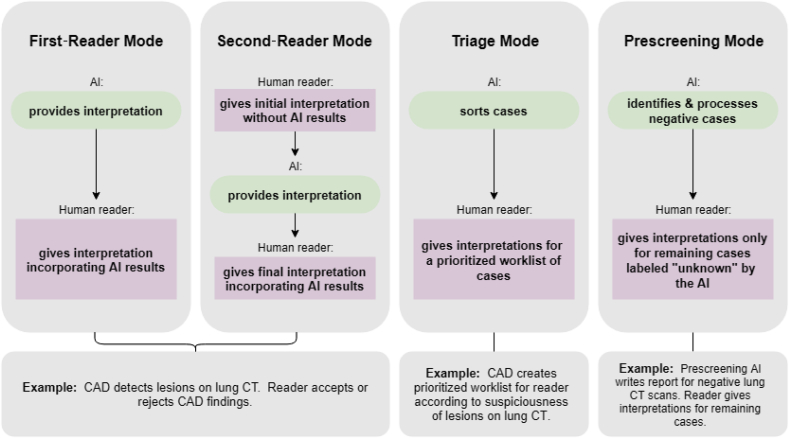
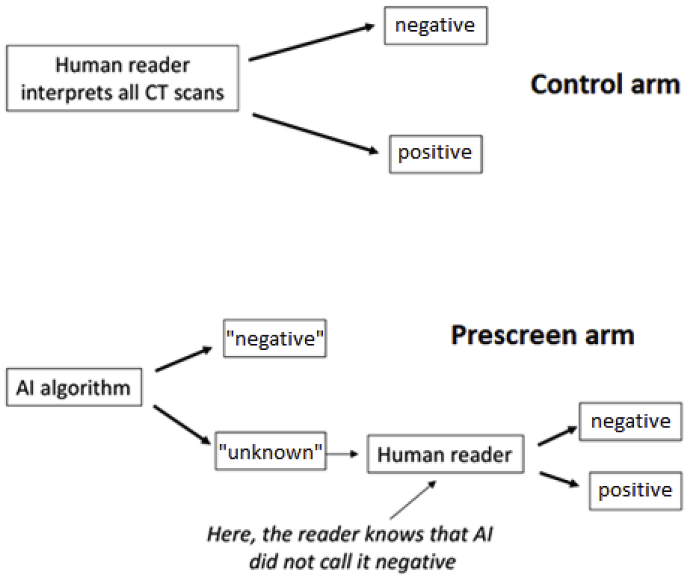
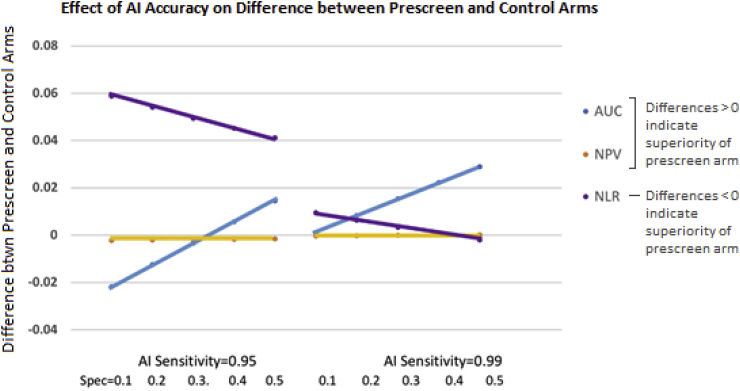
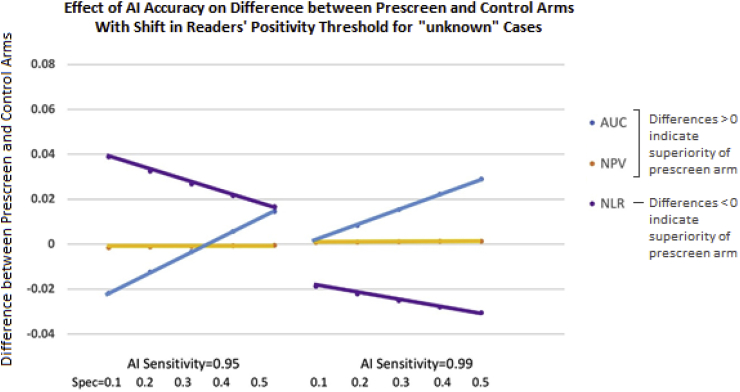
Artificial intelligence, as applied to medical images to detect, rule out, diagnose, and stage disease, has seen enormous growth over the last few years. There are multiple use cases of AI algorithms in medical imaging: first-reader (or concurrent) mode, second-reader mode, triage mode, and more recently prescreening mode as when an AI algorithm is applied to the worklist of images to identify obvious negative cases so that human readers do not need to review them and can focus on interpreting the remaining cases. In this paper we describe the statistical considerations for designing a study to test a new AI prescreening algorithm for identifying normal lung cancer screening CTs. We contrast agreement vs. accuracy studies, and retrospective vs. prospective designs. We evaluate various test performance metrics with respect to their sensitivity to changes in the AI algorithm's performance, as well as to shifts in reader behavior to a revised worklist. We consider sample size requirements for testing the AI prescreening algorithm.

Keywords: Area under the ROC curve; Artificial intelligence; Computer-aided detection; Diagnostic accuracy; Diagnostic accuracy studies; Prescreening.


Figures

Fig. 1
Fig. 1
Illustration of four use cases for AI
Fig. 2
Fig. 2
Illustration of the sequence of interpretations in control and prescreen arms for a prospective study of a prescreening AI algorithm.
Fig. 3
Fig. 3
Difference in accuracy between control and prescreen arms for various accuracy metrics as a function of the standalone performance of the AI device. AI standalone sensitivity is illustrated as 0.95 or 0.99, and its standalone specificity is 0.1, 0.2, 0.3, 0.4, and 0.5. The human reader sensitivity and specificity are set at 0.938 and 0.734, respectively, with disease prevalence of 4%. In the control arm, for the area under the ROC curve (AUC), at a FPR = 1-0.734 and Sens = 0.938, and assuming a binormal model with binormal parameter B = 1, we determined that binormal parameter A = 2.16 (based on Sensitivity =  Φ(A+BΦ1(FPR))) [8]. Other parameterizations of the ROC curve will give different results. For AUC and NPV, a positive-valued difference (as illustrated on the y-axis) suggests higher accuracy in the prescreen arm than the control arm; for the NLR a negative-valued difference suggests improved accuracy in the prescreen arm.
Fig. 4
Fig. 4
Difference in accuracy between control and prescreen arms for various accuracy metrics as a function of the standalone performance of the AI device; here readers' shift to a lower threshold for calling cases positive when interpreting AI's “unknown” cases. AI standalone sensitivity is either 0.95 or 0.99, and its standalone specificity is 0.1, 0.2, 0.3, 0.4, and 0.5. For the AUC, we supposed that when readers are interpreting cases classified as “unknown” by the AI algorithm, they shift their specificity from 0.734 to 0.634; if maintaining the same ROC curve (i.e. binormal model with A = 2.16 and B = 1), the corresponding sensitivity is 0.966. For AUC and NLR, a positive-valued difference (as illustrated on the y-axis) suggests higher accuracy in the prescreen arm than the control arm. Note that different magnitudes of readers' shift in threshold for calling cases positive (less shift or more shift) will change the metrics accordingly (less change or more change, respectively).
Fig. 5
Fig. 5
Equivalence boundary expressed as the prescreen AI's standalone specificity (x-axis) and sensitivity (y-axis) corresponding to a control arm with AUC = 0.937. Three boundaries are displayed for three ROC curve shapes: B = 0.5, 1.0, and 2.0. Above the boundary, the performance in the prescreen arm is superior to the performance in the control arm, while below the boundary the performance is inferior in the prescreen arm. The asterisk indicates the AI developers' estimate of the accuracy of the algorithm. The equivalence boundary was calculated assuming a binormal ROC curve model [8] and assuming parameter B is the same in the control and prescreen groups. For pairs of AI standalone sensitivities and specificities, the sensitivity and specificity in the prescreen arm were calculated from Equation (2), then parameter A and the AUC were estimated from A=Φ1(sens)B×Φ1(1spec) and AUC=Φ(A/(1+B2), where Φ is the cumulative distribution function of a standard normal random variable and Φ1 is its inverse.

References

    1. Jiang F., Jiang Y., Zhi H., Dong Y., Li H., Ma S., Wang Y., Dong Q., Shen H., Wang Y. Artificial intelligence in healthcare: past, present and future. Stroke Vasc Neurol. 2017;2:230–243. - PMC - PubMed
    1. Park S.H.P., Han K. Methodologic guide for evaluating clinical performance and effect of artificial intelligence technology for medical diagnosis and prediction. Radiology. 2018;286:800–809. - PubMed
    1. Kim D.W., Jang H.Y., Kim K.W., Shim Y., Park S.H. Design characteristics of studies reporting the performance of artificial intelligence algorithms for diagnostic analysis of medical images: results from recently published papers. KJR. 2019;20:405–410. - PMC - PubMed
    1. The National Lung Screening Trial Research Team Results of initial low-dose computed tomographic screening for lung cancer. N. Engl. J. Med. 2013;368:1980–1991. - PMC - PubMed
    1. Pepe M.S., Alonzo T.A. Comparing disease screening tests when true disease status is ascertained only for screen positives. Biostatistics. 2001;2:249–260. - PubMed