Integrative genomics analysis of hub genes and their relationship with prognosis and signaling pathways in esophageal squamous cell carcinoma
- PMID: 31485619
- PMCID: PMC6755233
- DOI: 10.3892/mmr.2019.10608
Integrative genomics analysis of hub genes and their relationship with prognosis and signaling pathways in esophageal squamous cell carcinoma
Abstract
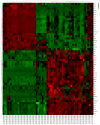
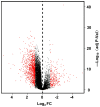
The main purpose of the present study was to recognize the integrative genomics analysis of hub genes and their relationship with prognosis and signaling pathways in esophageal squamous cell carcinoma (ESCC). The mRNA gene expression profile data of GSE38129 were downloaded from the Gene Expression Omnibus database, which included 30 ESCC and 30 normal tissue samples. The differentially expressed genes (DEGs) between ESCC and normal samples were identified using the GEO2R tool. Gene Ontology and Kyoto Encyclopedia of Genes and Genomes (KEGG) pathway analyses were performed to identify the functions and related pathways of the genes. The protein‑protein interaction (PPI) network of these DEGs was constructed with the Search Tool for the Retrieval of Interacting Genes and visualized with a molecular complex detection plug‑in via Cytoscape. The top five important modules were selected from the PPI network. A total of 928 DEGs, including ephrin‑A1 (EFNA1), collagen type IV α1 (COL4A1), C‑X‑C chemokine receptor 2 (CXCR2), adrenoreceptor β2 (ADRB2), P2RY14, BUB1B, cyclin A2 (CCNA2), checkpoint kinase 1 (CHEK1), TTK, pituitary tumor transforming gene 1 (PTTG1) and COL5A1, including 498 upregulated genes, were mainly enriched in the 'cell cycle', 'DNA replication' and 'mitotic nuclear division', whereas 430 downregulated genes were enriched in 'oxidation‑reduction process', 'xenobiotic metabolic process' and 'cell‑cell adhesion'. The KEGG analysis revealed that 'ECM‑receptor interaction', 'cell cycle' and 'p53 signaling pathway' were the most relevant pathways. According to the degree of connectivity and adjusted P‑value, eight core genes were selected, among which those with the highest correlation were CHEK1, BUB1B, PTTG1, COL4A1 and CXCR2. Gene Expression Profiling Interactive Analysis in The Cancer Genome Atlas database for overall survival (OS) was applied among these genes and revealed that EFNA1 and COL4A1 were significantly associated with a short OS in 182 patients. Immunohistochemical results revealed that the expression of PTTG1 in esophageal carcinoma tissues was higher than that in normal tissues. Therefore, these genes may serve as crucial predictors for the prognosis of ESCC.
Figures


Similar articles
-
Identification of candidate biomarkers and pathways associated with SCLC by bioinformatics analysis.Mol Med Rep. 2018 Aug;18(2):1538-1550. doi: 10.3892/mmr.2018.9095. Epub 2018 May 29. Mol Med Rep. 2018. PMID: 29845250 Free PMC article.
-
Identification of potential core genes in esophageal carcinoma using bioinformatics analysis.Medicine (Baltimore). 2021 Jul 9;100(27):e26428. doi: 10.1097/MD.0000000000026428. Medicine (Baltimore). 2021. PMID: 34232175 Free PMC article.
-
Bioinformatics analysis of gene expression profiles of esophageal squamous cell carcinoma.Dis Esophagus. 2017 May 1;30(5):1-8. doi: 10.1093/dote/dow018. Dis Esophagus. 2017. PMID: 28375447
-
Common gene signatures and key pathways in hypopharyngeal and esophageal squamous cell carcinoma: Evidence from bioinformatic analysis.Medicine (Baltimore). 2020 Oct 16;99(42):e22434. doi: 10.1097/MD.0000000000022434. Medicine (Baltimore). 2020. PMID: 33080677 Free PMC article.
-
Untargeted metabolomics analysis of esophageal squamous cell cancer progression.J Transl Med. 2022 Mar 14;20(1):127. doi: 10.1186/s12967-022-03311-z. J Transl Med. 2022. PMID: 35287685 Free PMC article. Review.
Cited by
-
The miR-1224-5p/TNS4/EGFR axis inhibits tumour progression in oesophageal squamous cell carcinoma.Cell Death Dis. 2020 Jul 30;11(7):597. doi: 10.1038/s41419-020-02801-6. Cell Death Dis. 2020. PMID: 32732965 Free PMC article.
-
The diagnostic value of serum Ephrin-A1 in patients with colorectal cancer.Sci Rep. 2024 Dec 28;14(1):31194. doi: 10.1038/s41598-024-82540-2. Sci Rep. 2024. PMID: 39732744 Free PMC article.
-
Galectins in Esophageal Cancer: Current Knowledge and Future Perspectives.Cancers (Basel). 2022 Nov 24;14(23):5790. doi: 10.3390/cancers14235790. Cancers (Basel). 2022. PMID: 36497271 Free PMC article. Review.
-
Comprehensive analysis of the expression and prognosis for TNFAIPs in head and neck cancer.Sci Rep. 2021 Aug 3;11(1):15696. doi: 10.1038/s41598-021-95160-x. Sci Rep. 2021. PMID: 34344926 Free PMC article.
-
The Hypoxia-Related Gene COL5A1 Is a Prognostic and Immunological Biomarker for Multiple Human Tumors.Oxid Med Cell Longev. 2022 Jan 17;2022:6419695. doi: 10.1155/2022/6419695. eCollection 2022. Oxid Med Cell Longev. 2022. PMID: 35082969 Free PMC article.
References
-
- Cui XB, Zhang SM, Xu YX, Dang HW, Liu CX, Wang LH, Yang L, Hu JM, Liang WH, Jiang JF, et al. PFN2, a novel marker of unfavorable prognosis, is a potential therapeutic target involved in esophageal squamous cell carcinoma. J Transl Med. 2016;14:137. doi: 10.1186/s12967-016-0884-y. - DOI - PMC - PubMed
MeSH terms
LinkOut - more resources
Full Text Sources
Medical
Research Materials
Miscellaneous

