. 2020 Apr;77(7):1401-1419.
doi: 10.1007/s00018-019-03291-2. Epub 2019 Sep 4.

Knockdown of Foxg1 in supporting cells increases the trans-differentiation of supporting cells into hair cells in the neonatal mouse cochlea

Affiliations

Knockdown of Foxg1 in supporting cells increases the trans-differentiation of supporting cells into hair cells in the neonatal mouse cochlea

Shasha Zhang et al. Cell Mol Life Sci. 2020 Apr.

Abstract

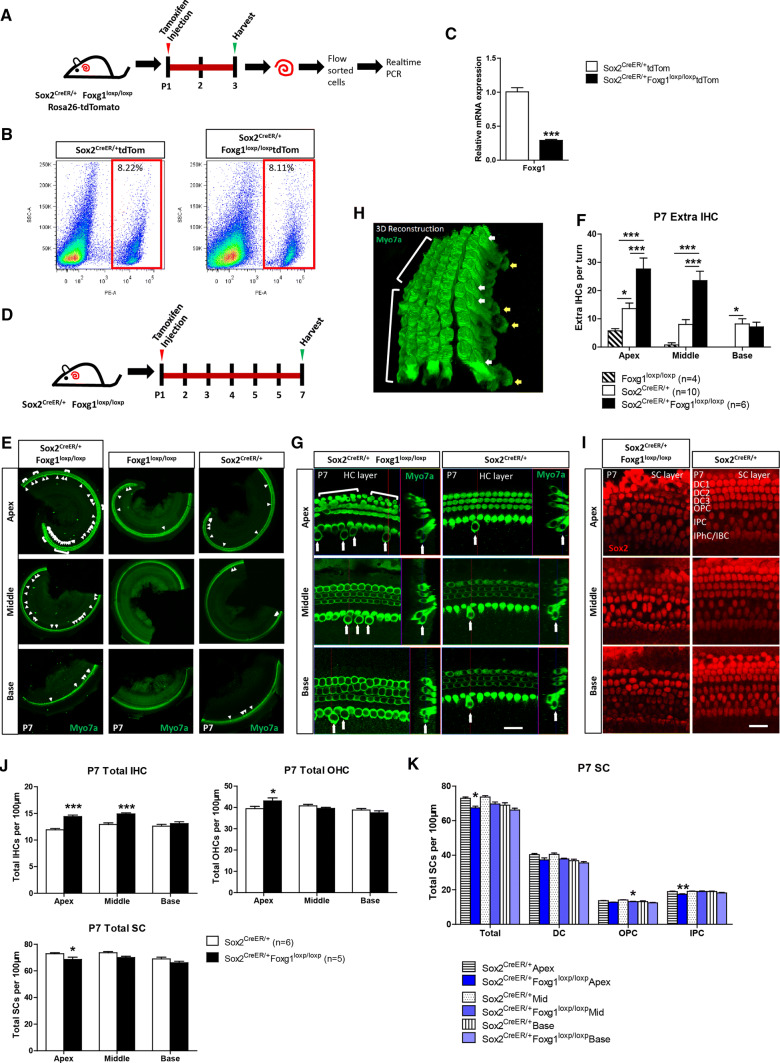
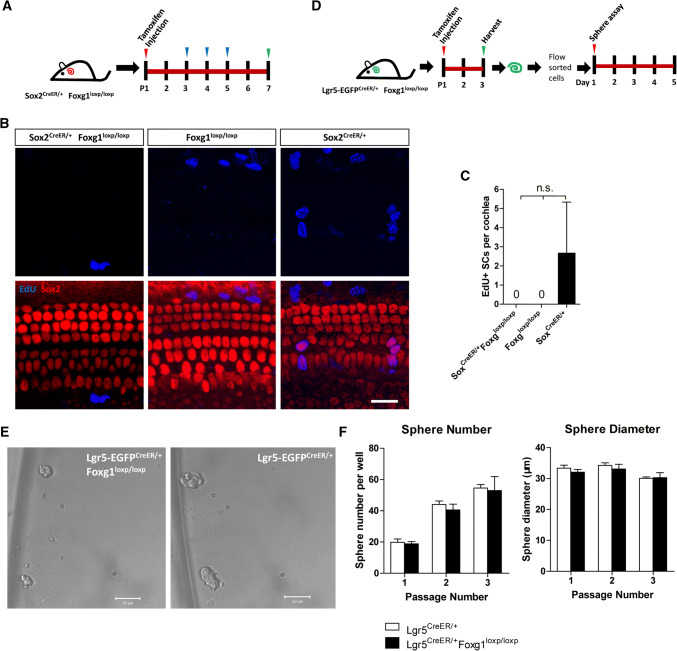
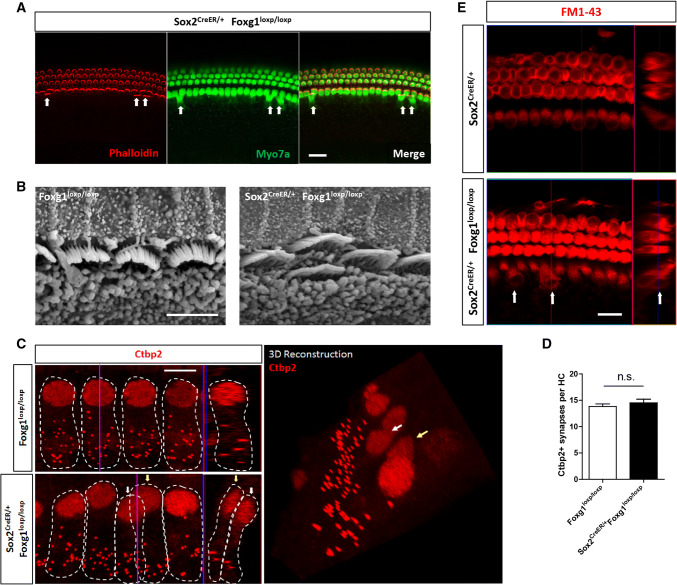
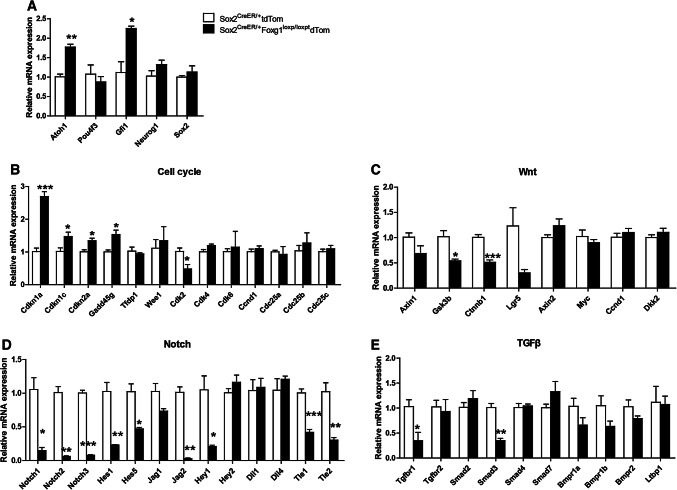
Foxg1 is one of the forkhead box genes that are involved in morphogenesis, cell fate determination, and proliferation, and Foxg1 was previously reported to be required for morphogenesis of the mammalian inner ear. However, Foxg1 knock-out mice die at birth, and thus the role of Foxg1 in regulating hair cell (HC) regeneration after birth remains unclear. Here we used Sox2CreER/+ Foxg1loxp/loxp mice and Lgr5-EGFPCreER/+ Foxg1loxp/loxp mice to conditionally knock down Foxg1 specifically in Sox2+ SCs and Lgr5+ progenitors, respectively, in neonatal mice. We found that Foxg1 conditional knockdown (cKD) in Sox2+ SCs and Lgr5+ progenitors at postnatal day (P)1 both led to large numbers of extra HCs, especially extra inner HCs (IHCs) at P7, and these extra IHCs with normal hair bundles and synapses could survive at least to P30. The EdU assay failed to detect any EdU+ SCs, while the SC number was significantly decreased in Foxg1 cKD mice, and lineage tracing data showed that much more tdTomato+ HCs originated from Sox2+ SCs in Foxg1 cKD mice compared to the control mice. Moreover, the sphere-forming assay showed that Foxg1 cKD in Lgr5+ progenitors did not significantly change their sphere-forming ability. All these results suggest that Foxg1 cKD promotes HC regeneration and leads to large numbers of extra HCs probably by inducing direct trans-differentiation of SCs and progenitors to HCs. Real-time qPCR showed that cell cycle and Notch signaling pathways were significantly down-regulated in Foxg1 cKD mice cochlear SCs. Together, this study provides new evidence for the role of Foxg1 in regulating HC regeneration from SCs and progenitors in the neonatal mouse cochlea.

Keywords: Foxg1; Hair cells; Progenitors; Proliferation; Supporting cells; Trans-differentiation.


Conflict of interest statement

The authors declare that they have no conflict of interest.

Figures

Fig. 1
Fig. 1
Foxg1 cKD in Sox2+ SCs results in increased HC number and decreased SC number. a Tamoxifen was I.P. injected into P1 Sox2CreER/+ Foxg1loxp/loxp Rosa26-tdTomato mice to knock down Foxg1 in Sox2+ SCs, and the mice were sacrificed at P3 for FAC sorting of Sox2+ SCs for real-time qPCR. b FAC sorting data for Sox2+ SCs. c Quantification of Foxg1 mRNA expression based on four independent qPCR experiments. ***p < 0.001. d Tamoxifen was I.P. injected into P1 Sox2CreER/+ Foxg1loxp/loxp mice to knockdown Foxg1 in Sox2+ SCs, and the mice were sacrificed at P7. ei Extra IHCs (arrows) and OHCs (square brackets) are seen in the apical (Apex), middle (Middle), and basal (Base) turns of P7 Sox2CreER/+ Foxg1loxp/loxp mice cochleae (e). Statistical analysis of the extra IHCs is shown in (f). The HC layer (g) and SC layer (i) are also shown. 3D reconstruction of extra HCs (white and yellow arrows) is shown in (h). Scale bar, 20 µm. Sox2CreER/+ mice and Foxg1loxp/loxp mice were used as controls. Myo7a and Sox2 were used as HC and SC markers, respectively. (j, k) Quantification of the total IHCs, total OHCs, total SCs (j), and different kinds of SCs (k) per 100 µm cochlea length. The n refers to the number of mice. *p < 0.05, **p < 0.01, ***p < 0.001. DC Deiter’s cell. OPC outer pillar cell. IPC inner pillar cell. IPhC inner phalangeal cell. IBC inner border cell
Fig. 2
Fig. 2
The extra IHCs could survive to P30. a Tamoxifen was I.P. injected at P1, and the mice were sacrificed at P7, P14, and P30. b, c Extra IHCs (arrows) and OHCs (square brackets) are seen in the apical (Apex), middle (Middle), and basal (Base) turns of P7 Sox2CreER/+ Foxg1loxp/loxp mice cochleae. Sox2CreER/+ mice were used as controls. Myo7a was used as the HC marker. Scale bar, 50 µm. (d, e) Quantification of the total IHCs and OHCs per 100 µm cochlea length at P14 and P30 (d) and the comparison between the three ages in control and Foxg1 cKD mice (e). The n refers to the number of mice. *p < 0.05, **p < 0.01, ***p < 0.001, n.s. not significant
Fig. 3
Fig. 3
Foxg1 cKD in Lgr5+ progenitors results in an increased number of IHCs that could survive to P30. a Tamoxifen was I.P. injected into P1 Lgr5-EGFPCreER/+ Foxg1loxp/loxp mice to knockdown Foxg1 in Lgr5+ progenitors, and the mice were sacrificed at P7, P14, and P30. b, c Extra IHCs (arrows) are seen in the apical (Apex), middle (Middle), and basal (Base) turns of P7 Lgr5-EGFPCreER/+ Foxg1loxp/loxp mice cochleae. Lgr5-EGFPCreER/+ mice and Foxg1loxp/loxp mice were used as controls. Myo7a was used as the HC marker. Scale bar, 20 µm. (d) Quantification of the extra IHCs, total IHCs, total OHCs, and total SCs. n is the number of mice. *p < 0.05, **p < 0.01, ***p < 0.001. e, f Extra IHCs (arrows) are seen in the apical (Apex), middle (Middle), and basal (Base) turns of P7, P14, and P30 Lgr5-EGFPCreER/+ Foxg1loxp/loxp mice cochleae. Lgr5-EGFPCreER/+ mice were used as controls. Myo7a was used as the HC marker. Scale bar, 50 µm. g Quantification of the total IHCs and OHCs per 100 µm cochlea length at P14 and P30 in control and Foxg1 cKD mice. The n refers to the number of mice. *p < 0.05, **p < 0.01, ***p < 0.001
Fig. 4
Fig. 4
The proliferation of Sox2+ SCs and Lgr5+ progenitors has no change in Foxg1 cKD mice. a EdU (50 mg/kg body weight) was injected at P3, P4, and P5 to label proliferating cells. b EdU was stained (blue) in Sox2CreER/+ Foxg1loxp/loxp, Foxg1loxp/loxp, and Sox2CreER/+ mice. Myo7a and Sox2 were used as HC and SC markers, respectively. Scale bar, 20 µm. c Quantification of EdU+ SCs per cochlea. n = 3 mice per group. n.s. not significant. d Tamoxifen was injected into Lgr5-EGFPCreER/+ Foxg1loxp/loxp mice to conditionally knockdown Foxg1 in Lgr5+ progenitors. After 2 days, Lgr5+ progenitors were isolated by FAC sorting and cultured in vitro for 5 days to form spheres. e Spheres formed by Lgr5+ progenitors from Lgr5-EGFPCreER/+ Foxg1loxp/loxp and Lgr5-EGFPCreER/+ mice. Scale bar, 50 µm. f Quantification of sphere number per well and sphere diameter of each passage. At least three wells of spheres were quantified. n.s. not significant
Fig. 5
Fig. 5
Lineage tracing of Sox2+ SCs. a Tamoxifen was injected at P3, and Sox2+ SCs were traced by following the expression of tdTomato fluorescent protein. b, c Lineage tracing images of cochlear Sox2+ SCs in Sox2CreER/+ Foxg1loxp/loxp Rosa26-tdTomato mice (b) and Sox2CreER/+ Rosa26-tdTomato mice (c). tdTomato+/Myo7a+ IHCs and OHCs are indicated by arrows and arrowheads, respectively. Scale bar, 20 µm. d Quantification of tdTomato+ (Tom+) IHCs and OHCs per cochlea and per turn. The n refers to the number of mice. *p < 0.05
Fig. 6
Fig. 6
Hair bundle, synapse, and FM1-43 staining of the extra IHCs. a Phalloidin was used to stain the hair bundles of the HCs. Extra IHCs are indicated by arrows. Scale bar, 20 µm. b Hair bundles of the extra IHCs by SEM. Scale bar, 5 µm. c Ctbp2 was used to stain synapses (dotted staining) of IHCs. Each IHC and its Ctbp2+ synapses are indicated by dotted white circles. Extra IHCs (white arrows) and normal IHCs (yellow arrows) are shown in both confocal images and 3D reconstructions. d Quantification of the synapse number of IHCs. n = 5 mice per group. n.s. not significant. e FM1-43 dye was up taken by extra IHCs (white arrows). Scale bar, 5 µm
Fig. 7
Fig. 7
Expression quantification of related genes and signaling pathways in Foxg1 cKD mice cochlear SCs. a–e Relative mRNA expression patterns of genes related to HC differentiation (a), cell cycle (b), and Wnt signaling (c), Notch signaling (d), and TGFβ signaling pathways (e). Four independent qPCR experiments were performed. *p < 0.05, **p < 0.01, ***p < 0.001

References

    1. Rubel EW, Furrer SA, Stone JS. A brief history of hair cell regeneration research and speculations on the future. Hear Res. 2013;297:42–51. - PMC - PubMed
    1. Bramhall NF, Shi F, Arnold K, Hochedlinger K, Edge AS. Lgr5-positive supporting cells generate new hair cells in the postnatal cochlea. Stem Cell Rep. 2014;2(3):311–322. - PMC - PubMed
    1. Shi F, Kempfle JS, Edge AS. Wnt-responsive Lgr5-expressing stem cells are hair cell progenitors in the cochlea. J Neurosci. 2012;32(28):9639–9648. - PMC - PubMed
    1. Chai R, Kuo B, Wang T, Liaw EJ, Xia A, Jan TA, Liu Z, Taketo MM, Oghalai JS, Nusse R, Zuo J, Cheng AG. Wnt signaling induces proliferation of sensory precursors in the postnatal mouse cochlea. Proc Natl Acad Sci USA. 2012;109(21):8167–8172. - PMC - PubMed
    1. Li W, You D, Chen Y, Chai R, Li H. Regeneration of hair cells in the mammalian vestibular system. Front Med. 2016;10(2):143–151. - PubMed

MeSH terms