

Constituents of Household Air Pollution and Risk of Lung Cancer among Never-Smoking Women in Xuanwei and Fuyuan, China
- PMID: 31487206
- PMCID: PMC6792381
- DOI: 10.1289/EHP4913
Constituents of Household Air Pollution and Risk of Lung Cancer among Never-Smoking Women in Xuanwei and Fuyuan, China
Abstract
Background: Lung cancer rates among never-smoking women in Xuanwei and Fuyuan in China are among the highest in the world and have been attributed to the domestic use of smoky (bituminous) coal for heating and cooking. However, the key components of coal that drive lung cancer risk have not been identified.
Objectives: We aimed to investigate the relationship between lifelong exposure to the constituents of smoky coal (and other fuel types) and lung cancer.
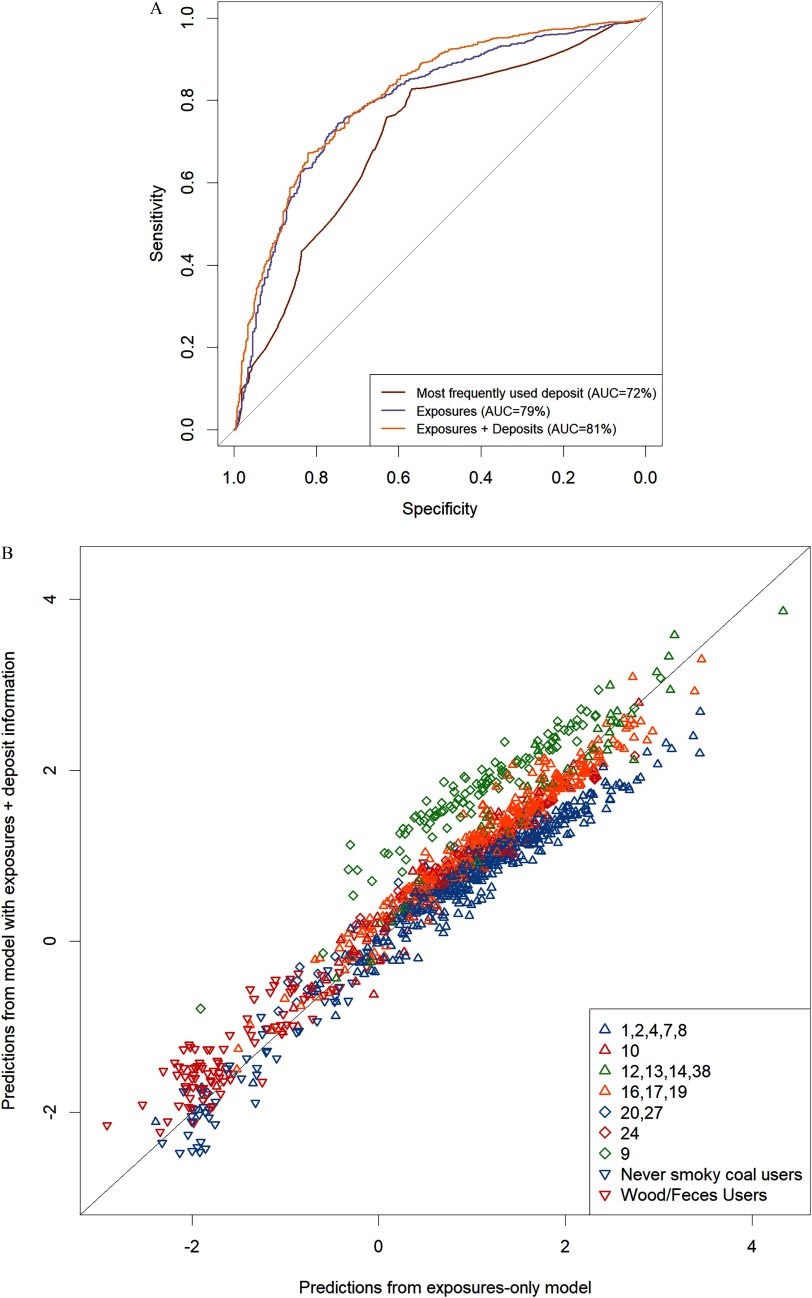
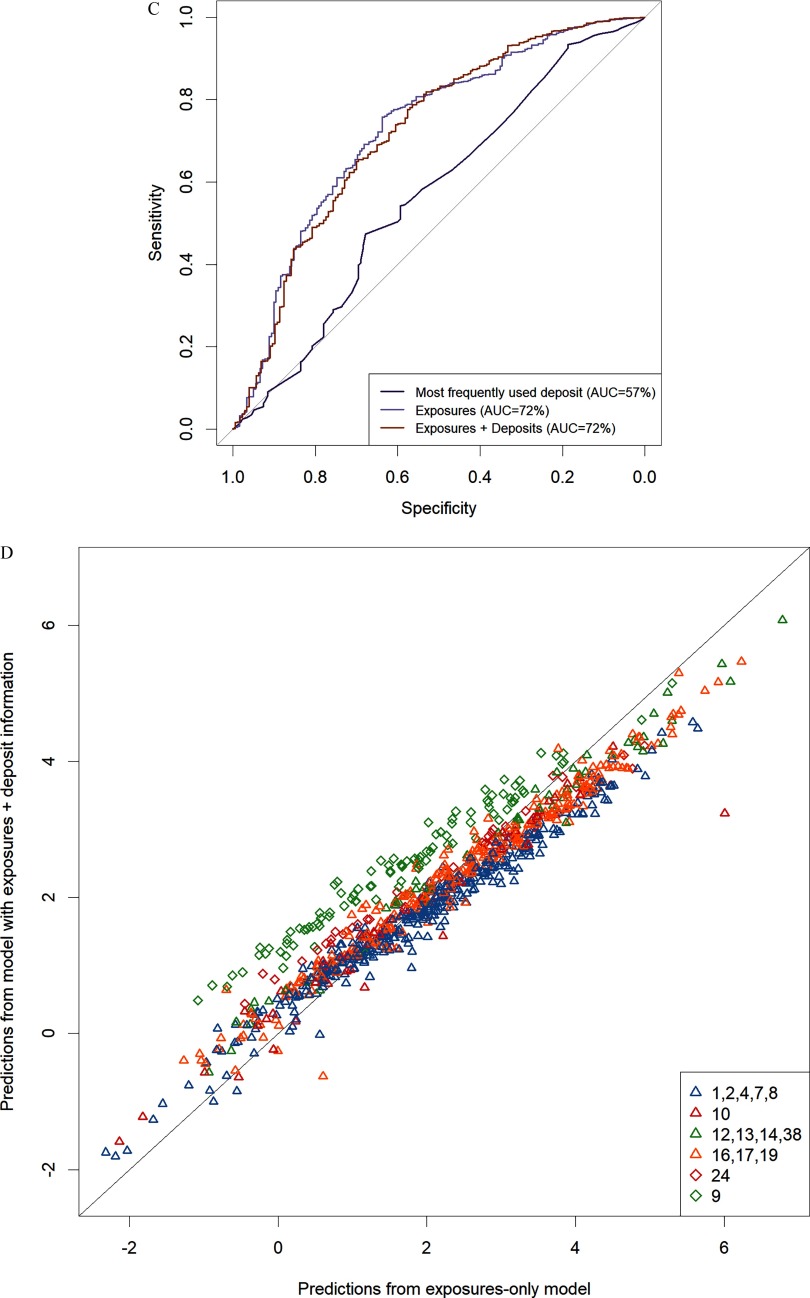
Methods: Using a population-based case-control study of lung cancer among 1,015 never-smoking female cases and 485 controls, we examined the association between exposure to 43 household air pollutants and lung cancer. Pollutant predictions were derived from a comprehensive exposure assessment study, which included methylated polycyclic aromatic hydrocarbons (PAHs), which have never been directly evaluated in an epidemiological study of any cancer. Hierarchical clustering and penalized regression were applied in order to address high colinearity in exposure variables.
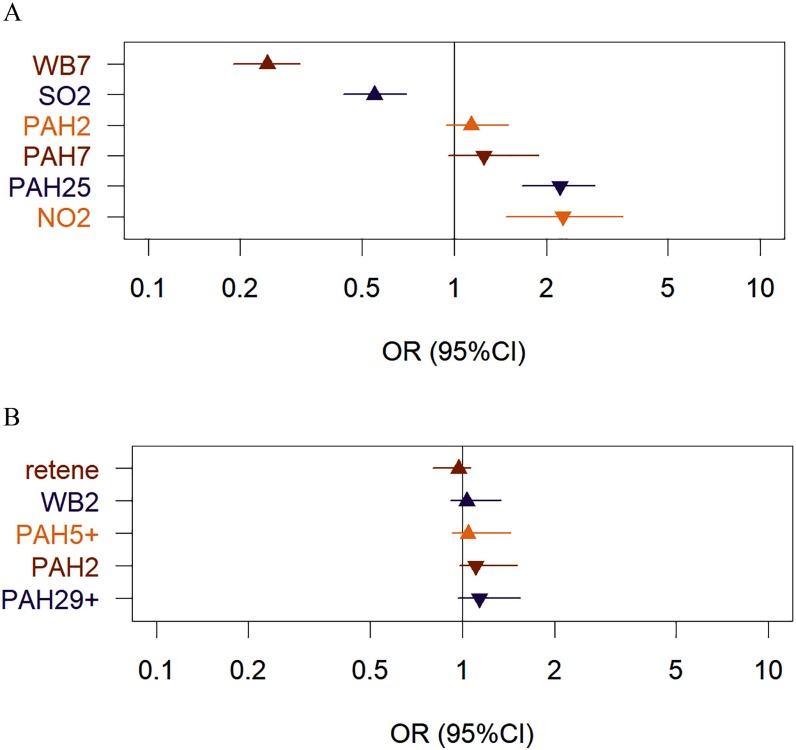
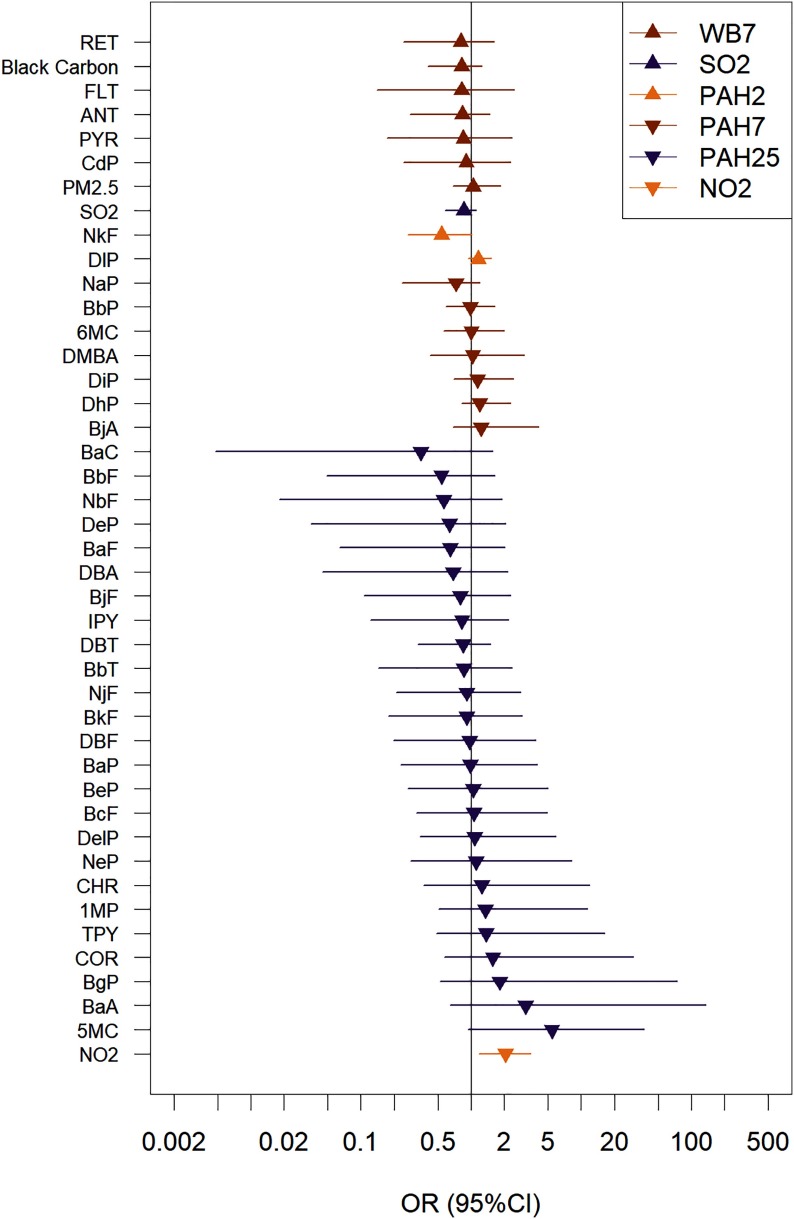
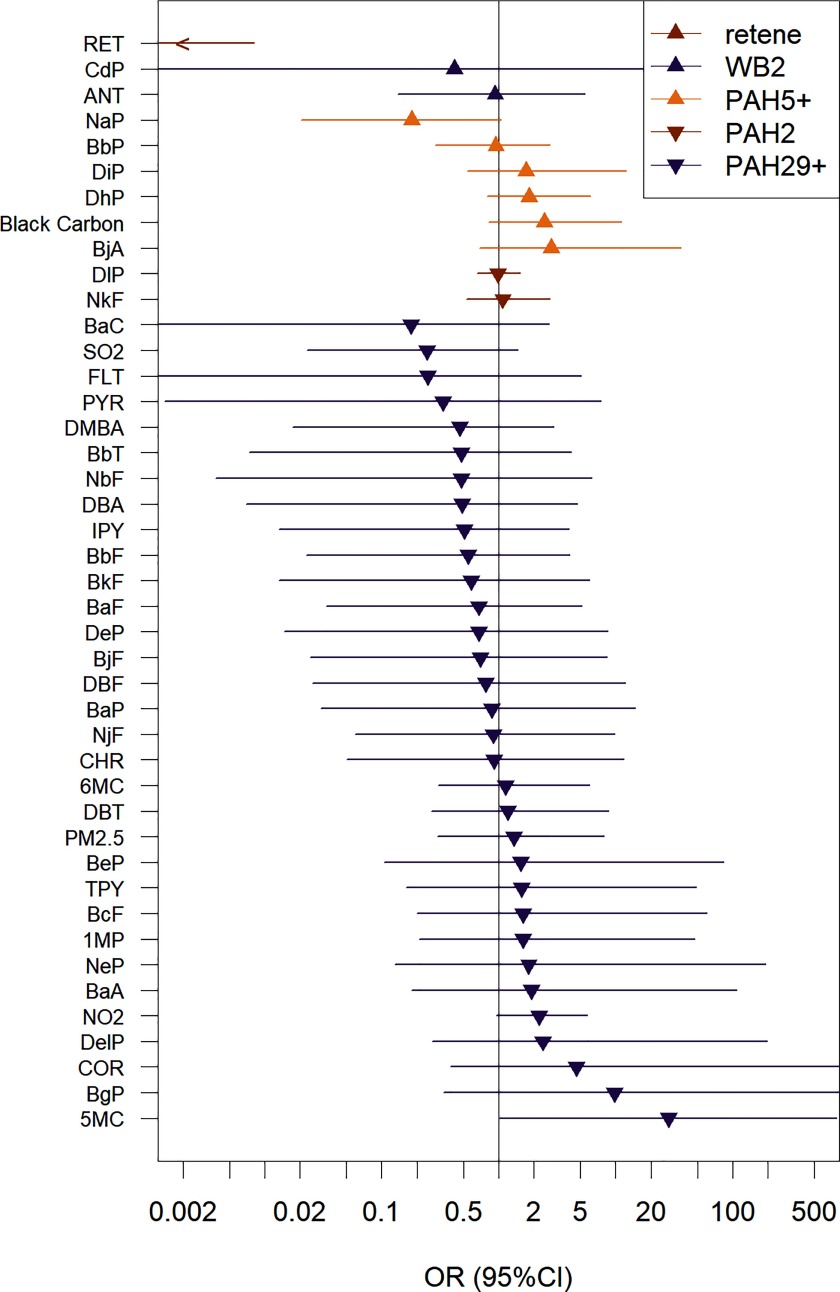
Results: The strongest association with lung cancer was for a cluster of 25 PAHs [odds ratio (OR): 2.21; 95% confidence interval (CI): 1.67, 2.87 per 1 standard deviation (SD) change], within which 5-methylchrysene (5-MC), a mutagenic and carcinogenic PAH, had the highest individual observed OR (5.42; 95% CI: 0.94, 27.5). A positive association with nitrogen dioxide ([Formula: see text]) was also observed (OR: 2.06; 95% CI: 1.19, 3.49). By contrast, neither benzo(a)pyrene (BaP) nor fine particulate matter with aerodynamic diameter [Formula: see text] ([Formula: see text]) were associated with lung cancer in the multipollutant models.
Conclusions: To our knowledge, this is the first study to comprehensively evaluate the association between lung cancer and household air pollution (HAP) constituents estimated over the entire life course. Given the global ubiquity of coal use domestically for indoor cooking and heating and commercially for electric power generation, our study suggests that more extensive monitoring of coal combustion products, including methylated PAHs, may be warranted to more accurately assess health risks and develop prevention strategies from this exposure. https://doi.org/10.1289/EHP4913.
Figures
Comment in
-
Expanded View of PAHs: Identifying Especially Harmful Constituents of Bituminous Coal Smoke.Environ Health Perspect. 2020 Apr;128(4):44001. doi: 10.1289/EHP6343. Epub 2020 Apr 16. Environ Health Perspect. 2020. PMID: 32298151 Free PMC article.
Similar articles
-
Expanded PAH analysis of household air pollution in a rural region of China with high lung cancer incidence.Environ Pollut. 2024 Nov 15;361:124717. doi: 10.1016/j.envpol.2024.124717. Epub 2024 Aug 13. Environ Pollut. 2024. PMID: 39147225
-
Household air pollution and epigenetic aging in Xuanwei, China.Environ Int. 2023 Aug;178:108041. doi: 10.1016/j.envint.2023.108041. Epub 2023 Jun 17. Environ Int. 2023. PMID: 37354880 Free PMC article.
-
Methylated polycyclic aromatic hydrocarbons from household coal use across the life course and risk of lung cancer in a large cohort of 42,420 subjects in Xuanwei, China.Environ Int. 2023 Mar;173:107870. doi: 10.1016/j.envint.2023.107870. Epub 2023 Mar 7. Environ Int. 2023. PMID: 36921559 Free PMC article.
-
Household air pollution and lung cancer in China: a review of studies in Xuanwei.Chin J Cancer. 2014 Oct;33(10):471-5. doi: 10.5732/cjc.014.10132. Epub 2014 Sep 16. Chin J Cancer. 2014. PMID: 25223911 Free PMC article. Review.
-
Household air pollution and personal exposure to air pollutants in rural China - A review.Environ Pollut. 2018 Jun;237:625-638. doi: 10.1016/j.envpol.2018.02.054. Epub 2018 Mar 15. Environ Pollut. 2018. PMID: 29525629 Review.
Cited by
-
Patterns and trends of mortality from metastatic colorectal cancer in Shanghai, China from 2005 to 2021: a population-based retrospective analysis.J Cancer Res Clin Oncol. 2024 Feb 2;150(2):68. doi: 10.1007/s00432-023-05518-z. J Cancer Res Clin Oncol. 2024. PMID: 38305905 Free PMC article.
-
Magnitude, temporal trends and inequality in global burden of tracheal, bronchus and lung cancer: findings from the Global Burden of Disease Study 2017.BMJ Glob Health. 2020 Oct;5(10):e002788. doi: 10.1136/bmjgh-2020-002788. BMJ Glob Health. 2020. PMID: 33028698 Free PMC article.
-
Relationship between household air pollution and lung cancer in never smokers in high-income countries: a systematic review.BMJ Open. 2025 Jun 20;15(6):e093870. doi: 10.1136/bmjopen-2024-093870. BMJ Open. 2025. PMID: 40541430 Free PMC article.
-
Proteogenomic analysis of air-pollution-associated lung cancer reveals prevention and therapeutic opportunities.Elife. 2024 Oct 21;13:RP95453. doi: 10.7554/eLife.95453. Elife. 2024. PMID: 39432560 Free PMC article.
-
Solid Fuel, Secondhand Smoke, and Lung Cancer Mortality: A Prospective Cohort of 323,794 Chinese Never-Smokers.Am J Respir Crit Care Med. 2022 Nov 1;206(9):1153-1162. doi: 10.1164/rccm.202201-0114OC. Am J Respir Crit Care Med. 2022. PMID: 35616543 Free PMC article.
References
-
- Agier L, Portengen L, Chadeau-Hyam M, Basagaña X, Giorgis-Allemand L, Siroux V, et al. . 2016. A systematic comparison of linear regression-based statistical methods to assess exposome-health associations. Environ Health Perspect 124(12):1848–1856, PMID: 27219331, 10.1289/EHP172. - DOI - PMC - PubMed
-
- Betancourt M. 2018. A Conceptual Introduction to Hamiltonian Monte Carlo. https://arxiv.org/pdf/1701.02434.pdf, [accessed 15 December 2018].
-
- Box GEP, Cox DR. 1964. An analysis of transformations. J Roy Stat Soc B 26:211–243, 10.1111/j.2517-6161.1964.tb00553.x. - DOI
-
- Brooks SP, Gelman A. 1998. General methods for monitoring convergence of iterative simulations. J Comput Graph Stat 7(4):434–455, 10.2307/1390675. - DOI
Publication types
MeSH terms
Substances
Grants and funding
LinkOut - more resources
Full Text Sources
Medical
