. 2020 Mar;18(3):829-844.
doi: 10.1111/pbi.13252. Epub 2019 Sep 25.

DREB/CBF expression in wheat and barley using the stress-inducible promoters of HD-Zip I genes: impact on plant development, stress tolerance and yield

Affiliations

DREB/CBF expression in wheat and barley using the stress-inducible promoters of HD-Zip I genes: impact on plant development, stress tolerance and yield

Yunfei Yang et al. Plant Biotechnol J. 2020 Mar.

Abstract

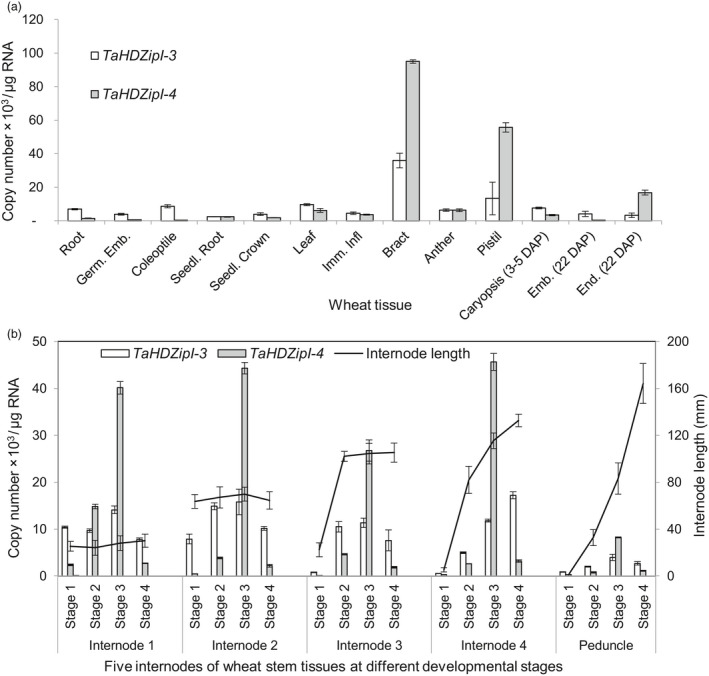
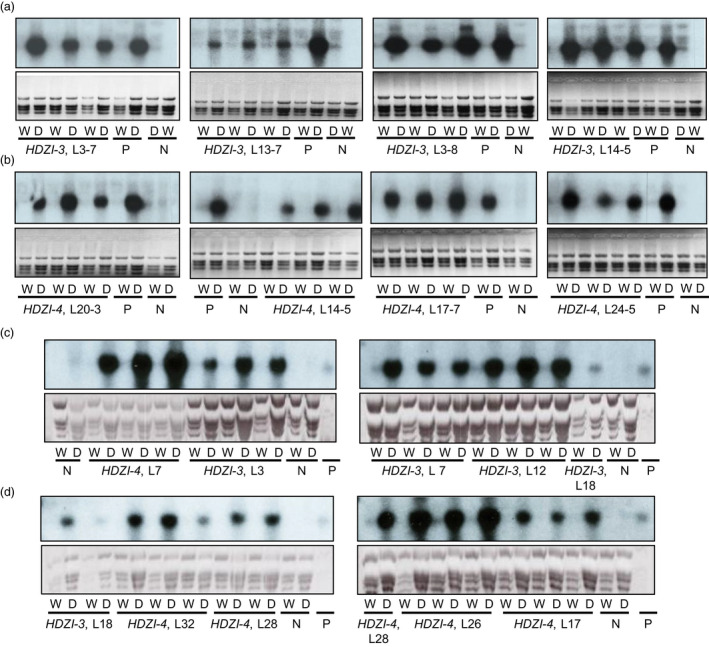
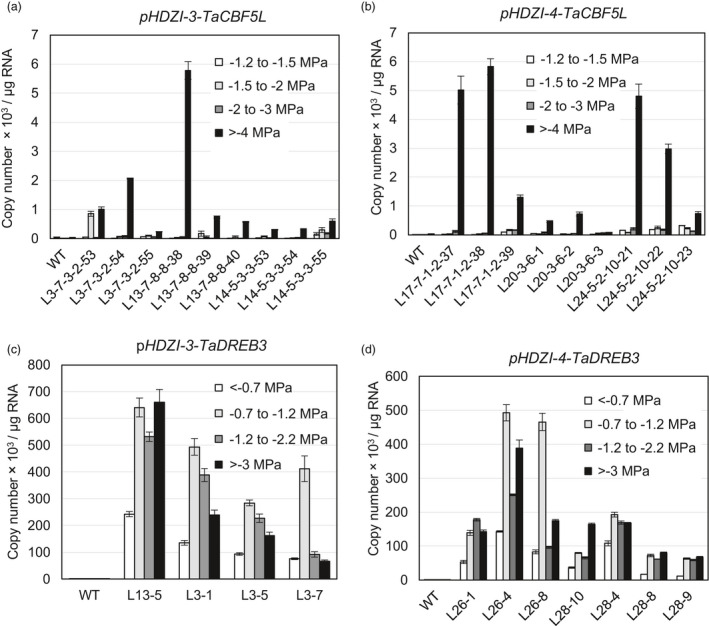
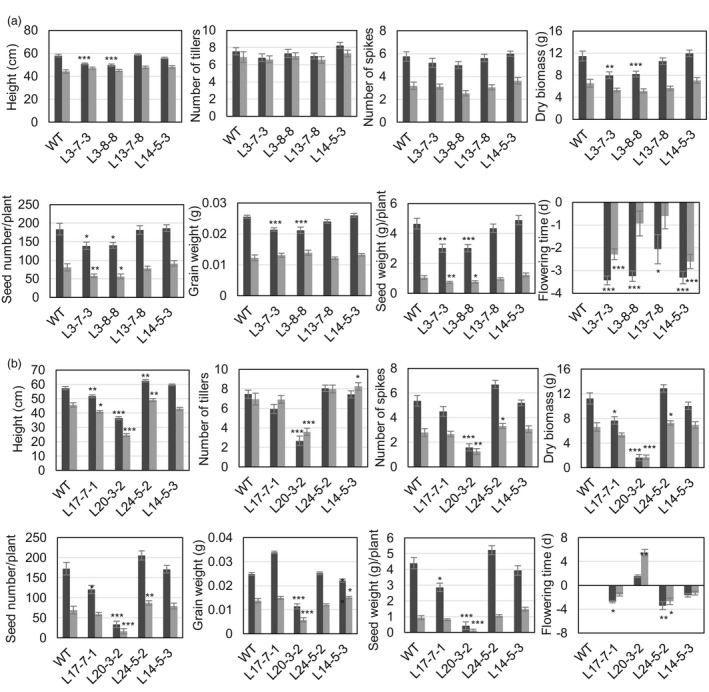
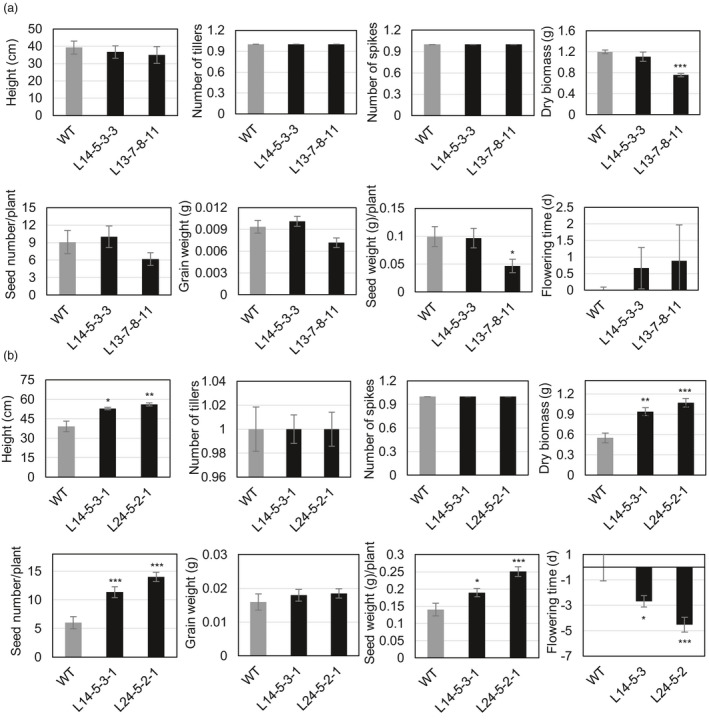
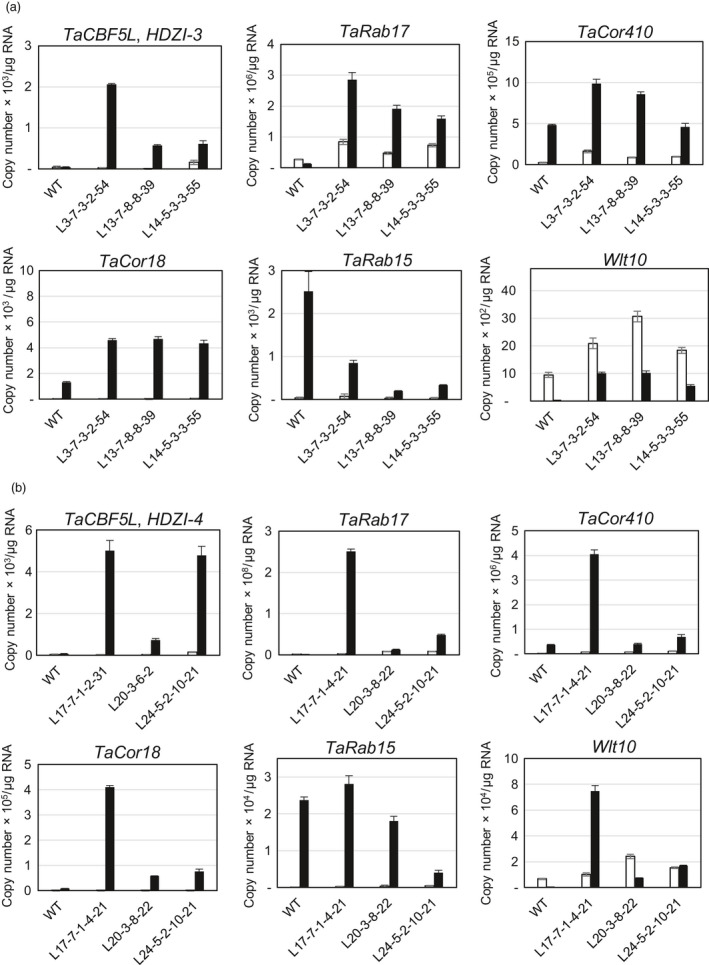
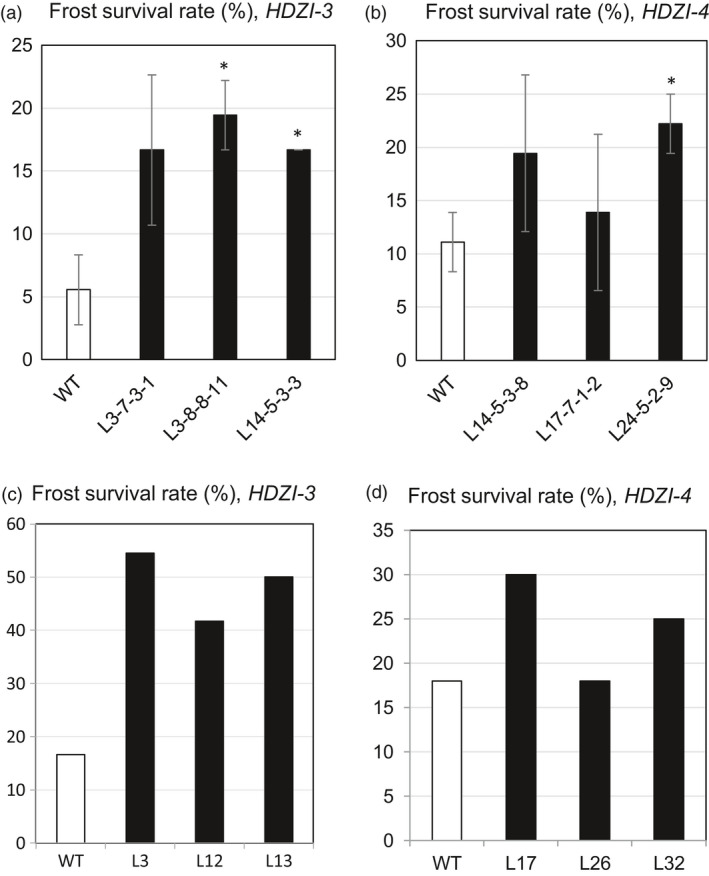
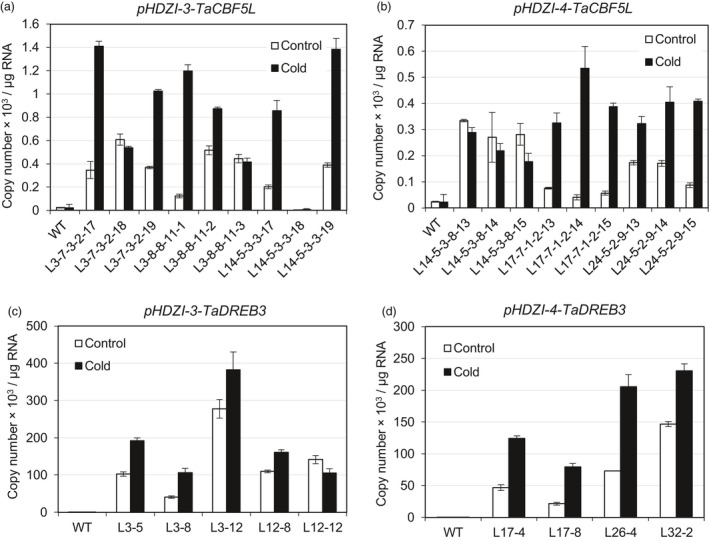
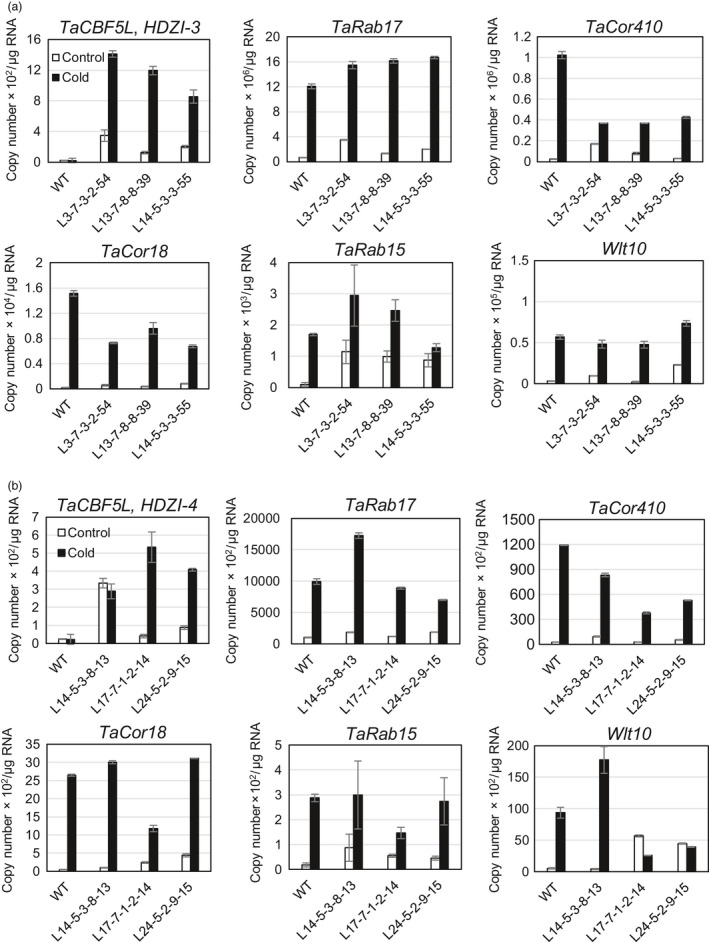
Networks of transcription factors regulate diverse physiological processes in plants to ensure that plants respond to abiotic stresses rapidly and efficiently. In this study, expression of two DREB/CBF genes, TaDREB3 and TaCBF5L, was modulated in transgenic wheat and barley, by using stress-responsive promoters HDZI-3 and HDZI-4. The promoters were derived from the durum wheat genes encoding the γ-clade TFs of the HD-Zip class I subfamily. The activities of tested promoters were induced by drought and cold in leaves of both transgenic species. Differences in sensitivity of promoters to drought strength were dependent on drought tolerance levels of cultivars used for generation of transgenic lines. Expression of the DREB/CBF genes under both promoters improved drought and frost tolerance of transgenic barley, and frost tolerance of transgenic wheat seedlings. Expression levels of the putative TaCBF5L downstream genes in leaves of transgenic wheat seedlings were up-regulated under severe drought, and up- or down-regulated under frost, compared to those of control seedlings. The application of TaCBF5L driven by the HDZI-4 promoter led to the significant increase of the grain yield of transgenic wheat, compared to that of the control wild-type plants, when severe drought was applied during flowering; although no yield improvements were observed when plants grew under well-watered conditions or moderate drought. Our findings suggest that the studied HDZI promoters combined with the DREB/CBF factors could be used in transgenic cereal plants for improvement of abiotic stress tolerance, and the reduction of negative influence of transgenes on plant development and grain yields.

Keywords: C-repeat binding factor 5-like protein; HDZI-4 and HDZI-3 promoters; Phenotype; transcription factors; transgenic barley and wheat.


Conflict of interest statement

Authors declare no conflict of interest.

Figures

Figure 1
Figure 1
Levels of TaHDZipI‐3 and TaHDZipI‐4 expression in different wheat tissues and at different stages of stem development. (a) Levels of TaHDZipI‐3 and TaHDZipI‐4 expression in different tissues of wheat cv. Chinese Spring. ERF—ethylene‐responsive element‐binding; Emb. (22DAP)—Embryo 22 days after pollination; End. (22 DAP)—Endosperm 22 days after pollination; Germ. Emb.—Embryo in germinating seed; Imm.Infl—Immature inflorescence; Int—Internode; Seedl. crown—Seedling crown; Seedl. Root—Seedling root. (b) Spatial expression patterns of TaHDZipI‐3 and TaHDZipI‐4 expression in four stem internodes (Int) below peduncle (Ped) at four different stages of wheat (T. aestivum cv. RAC875) development. Internode length parameters are plotted against the secondary vertical axis. Stem stages are as follows: Stage 1 (100 mm); Stage 2 (300 mm) awns emerging; Stage 3 (400 mm) head emerging; Stage 4 (500 mm) at anthesis; peduncle emerged. Error bars represent the standard deviation of three biological replicates (a) and three technical replicates (a).
Figure 2
Figure 2
Induction of wheat HDZI‐3 and HDZI‐4 promoters in leaves of 3‐week‐old control and transgenic T2 wheat seedlings (a) and in control and transgenic T1 barley seedlings of the same age (b) before (W) and after 6 h of dehydration (d). N: WT plants with the endogenous TaCBF5L or HvDREB3 genes either cannot be seen or seen as a weak band under both well‐watered and dehydration conditions, and therefore were used as negative control; P: transgenic wheat plants with TaCBF5L transgene showing a strong band under dehydration conditions (a and b), and/or a 1000‐fold diluted purified DNA fragment of the TaDREB3 coding region (c and d) were used as positive controls; W: well‐watered; D: drought.
Figure 3
Figure 3
TaCBF5L or TaDREB3 transgene expression in wheat (a and b) or barley (c and d) plants controlled by the promoter HDZI‐3 (a and c) and the promoter HDZI‐4 (b and d) under various drought stages: well‐watered condition (leaf water potential with −1.2 to −1.5 MPa for wheat or 0 to −0.7 MPa for barley), the leaf wilting point (leaf water potential with −1.5 to −2 MPa for wheat or −0.7 to −1.2 MPa for barley), moderate drought (leaf water potential with −2 to −3 MPa for wheat or −1.2 to −1.5 MPa for barley) and drought condition (leaf water potential >−4 MPa for wheat or >−3 MPa for barley). The error bars represent ±SD of three technical replicates.
Figure 4
Figure 4
Growth characteristics and yield components of control wild‐type (WT) and transgenic wheat (Triticum aestivum cv. Gladius) transformed with pHDZI‐3‐TaCBF5L (a) and pHDZI‐4‐TaCBF5L (b) under well‐watered (black boxes) and moderate drought (grey boxes) conditions. Flowering time of transgenic plants was compared with the average flowering time of 16 control WT plants, which is represented as day 0. Values represent means ± SE (n varies for each column and is shown in each case directly on the graphs) at ‘*’ P < 0.05, ‘**’ for P < 0.01 and ‘***’ for P < 0.001, which were calculated by the Student's t‐test (unpaired, two‐tailed).
Figure 5
Figure 5
Growth characteristics and yield components of control wild‐type (WT) and transgenic wheat (T. aestivum cv. Gladius) transformed with pHDZI‐3‐TaCBF5L (a), and pHDZI‐4‐TaCBF5L (b) under severe drought. Flowering time of transgenic plants was compared to average flowering times of 16 control WT plants, which is represented as day 0. Values represent means ± SE (n varies for each column and is shown in each case directly on the graphs) at *P < 0.05, ** for P < 0.01 and *** for P < 0.001, which were calculated by Student's t‐test (unpaired, two‐tailed).
Figure 6
Figure 6
Expression of the TaCBF5L transgene and stress‐inducible LEACORDHN genes in control WT and transgenic wheat plants with inducible overexpression of TaCBF5L controlled by HDZI‐3 (a) and HDZI‐4 (b) promoters. Expression levels of the TaCBF5L transgene and selected stress‐inducible genes were estimated under well‐watered conditions (white boxes) and severe drought (leaf water potential >−4 MPa; black boxes).
Figure 7
Figure 7
Frost survival rates of control WT and transgenic T3 wheat plants transformed with pHDZI‐3‐TaCBF5L (a) and pHDZI‐4‐TaCBF5L (b) constructs. Error bars represent ±SD of three technical replicates. Differences between transgenic and WT plants were tested in the unpaired Student's t‐test (*P < 0.05). Frost survival rate of control WT and transgenic T1 barley seedlings transformed with pHDZI‐3‐TaDREB3 (c) and pHDZI‐4‐TaDREB3 (d); data in panels (c) and (d) are based on a single experiment, thus no ±SD values are included.
Figure 8
Figure 8
TaCBF5L (a and b) or TaDREB3 (c and d) transgene expression levels controlled by the HDZI‐3 (a and c) and HDZI‐4 (b and d) promoters in leaves of control WT and transgenic T4 wheat (a and b) or T1 barley plants (c and d) grown at 24 °C (control) and subjected to cold treatment at 4 °C. The error bars represent ±SD of three technical replicates.
Figure 9
Figure 9
Expression of the TaCBF5L transgene and stress‐inducible LEACORDHN genes in transgenic wheat plants with overexpression of TaCBF5L controlled by HDZI‐3 (a) and HDZI‐4 (b) promoters in control WT and transgenic T4 lines at 23 °C (Control) and under the cold treatment at 4 °C (Cold).

Similar articles

Cited by

References

    1. Agarwal, P.K. , Gupta, K. , Lopato, S. and Agarwal, P. (2017) Dehydration responsive element binding transcription factors and their applications for the engineering of stress tolerance. J. Exp. Bot. 68, 2135–2148. - PubMed
    1. Altschul, S.F. , Gish, W. , Miller, W. , Myers, E.W. and Lipman, D.J. (1990) Basic local alignment search tool. J. Mol. Biol. 215, 403–410. - PubMed
    1. Altschul, S.F. , Madden, T.L. , Schäffer, A.A. , Zhang, J. , Zhang, Z. , Miller, W. and Lipman, D.J. (1997) Gapped BLAST and PSI‐BLAST: a new generation of protein database search programs. Nucleic Acids Res. 25, 3389–3402. - PMC - PubMed
    1. Amalraj, A. , Luang, S. , Kumar, M.Y. , Sornaraj, P. , Eini, O. , Kovalchuk, N. , Bazanova, N. et al. (2016) Change of function of the wheat stress‐responsive transcriptional repressor TaRAP2.1L by repressor motif modification. Plant Biotechnol. J. 14, 820–832. - PMC - PubMed
    1. Ban, Q. , Liu, G. and Wang, Y. (2011) A DREB gene from Limonium bicolor mediates molecular and physiological responses to copper stress in transgenic tobacco. J. Plant Physiol. 168, 449–458. - PubMed

Publication types

Associated data

LinkOut - more resources