. 2019 Sep 4;20(18):4338.
doi: 10.3390/ijms20184338.

Function and Transcriptional Regulation of Bovine TORC2 Gene in Adipocytes: Roles of C/EBP, XBP1, INSM1 and ZNF263

Affiliations

Function and Transcriptional Regulation of Bovine TORC2 Gene in Adipocytes: Roles of C/EBP, XBP1, INSM1 and ZNF263

Rajwali Khan et al. Int J Mol Sci. .

Abstract

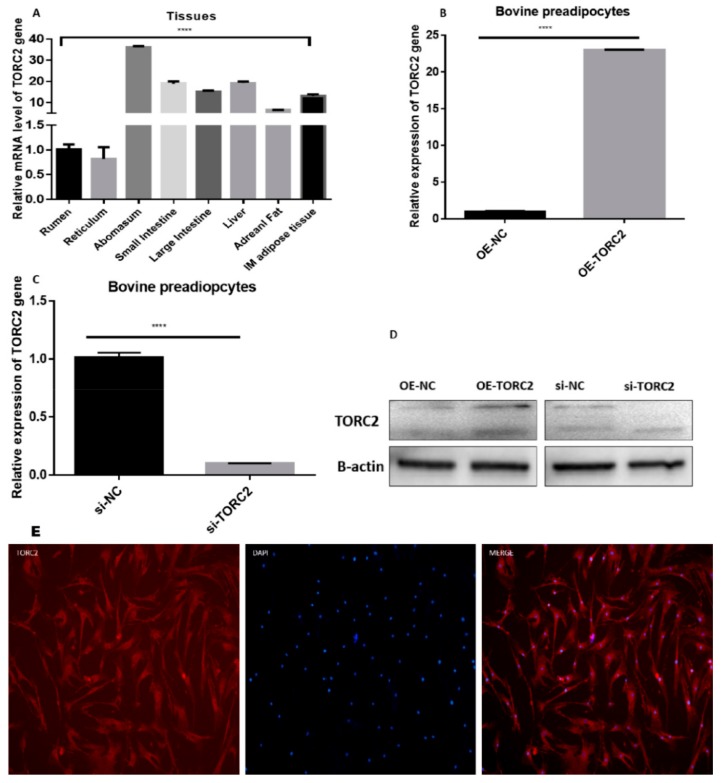
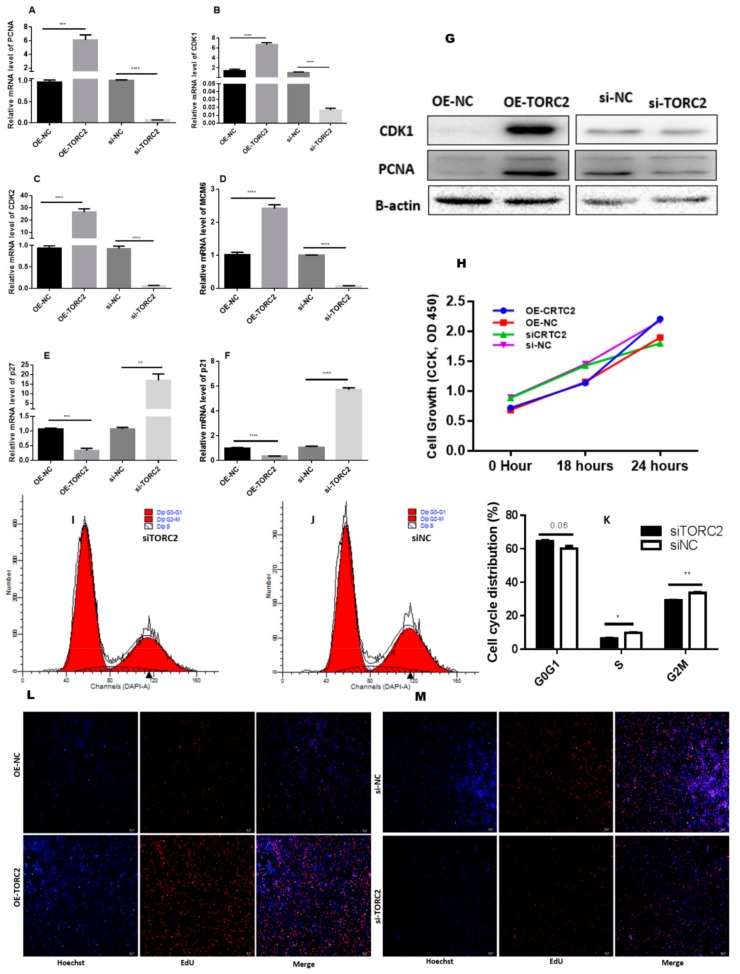
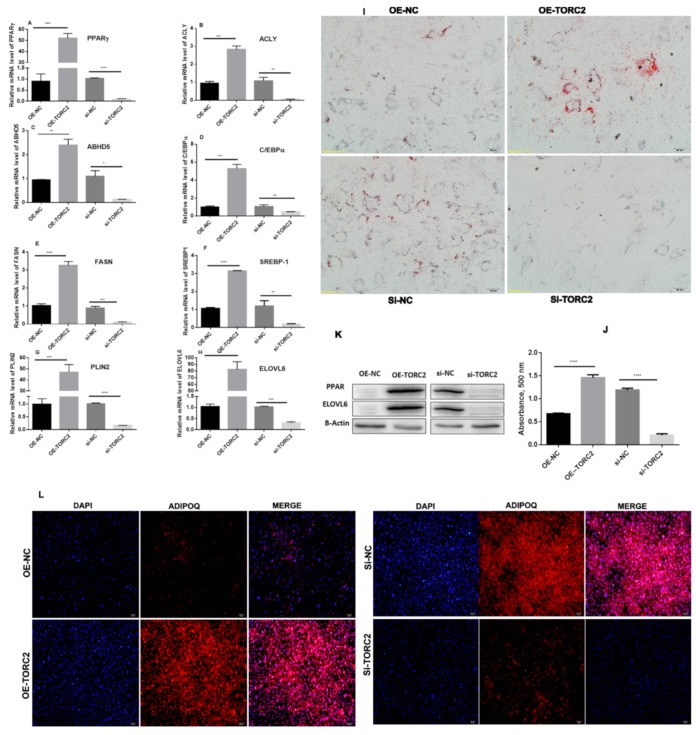
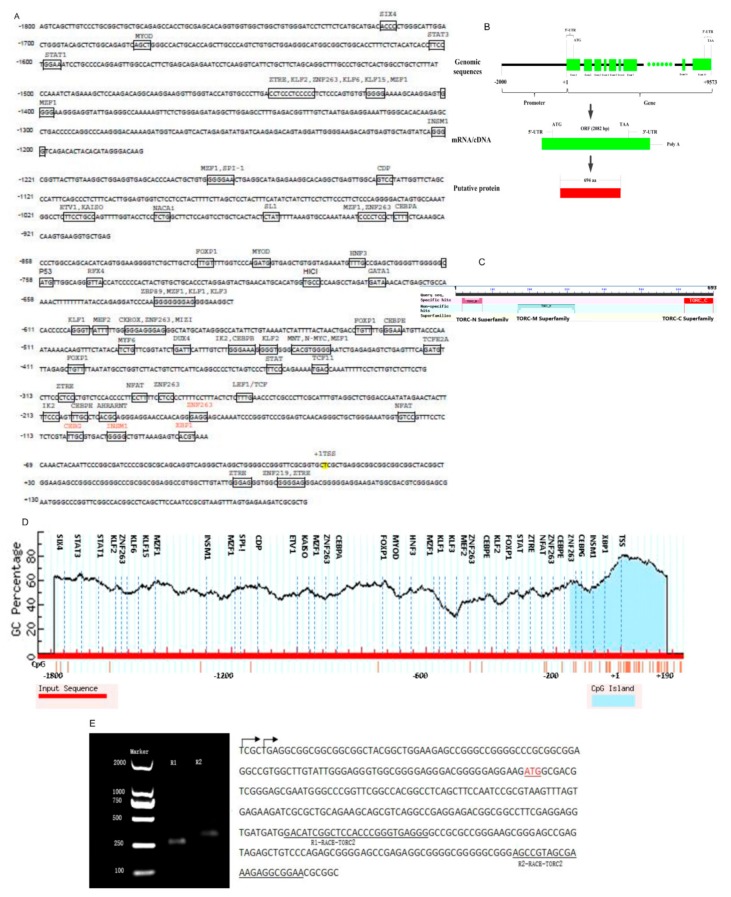
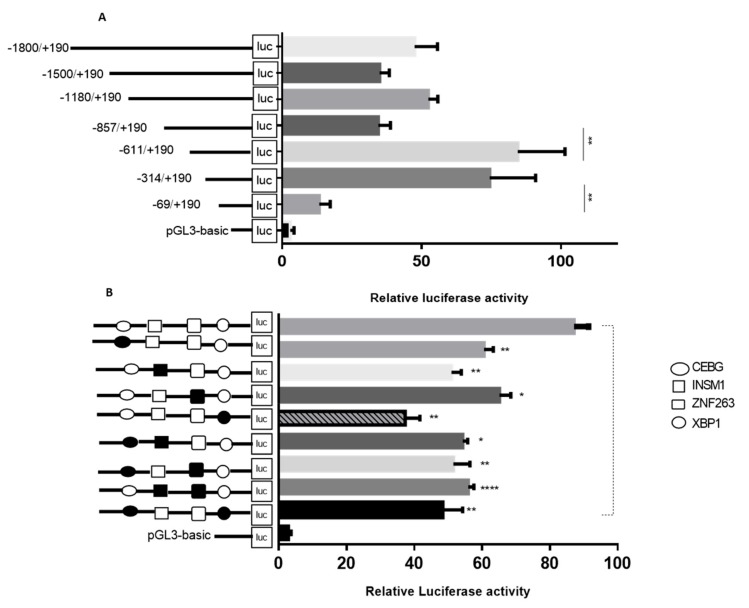
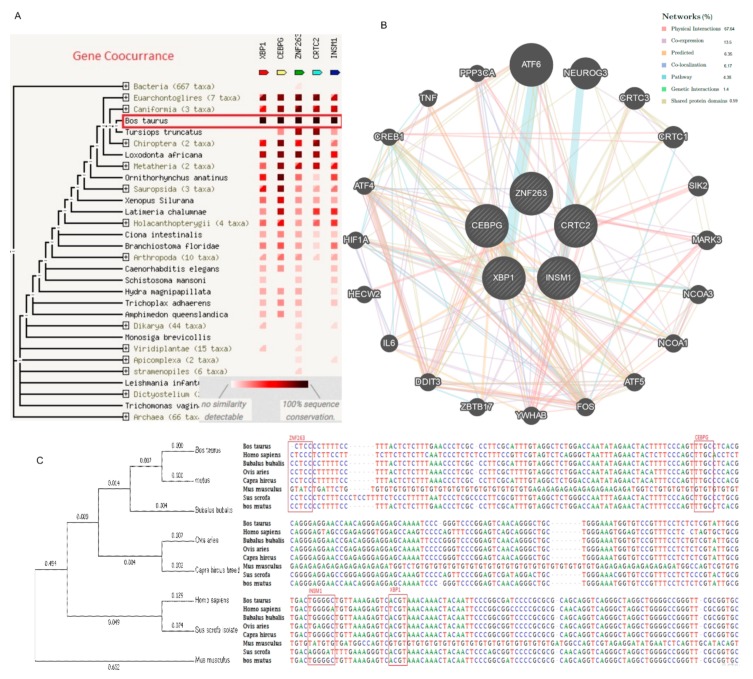
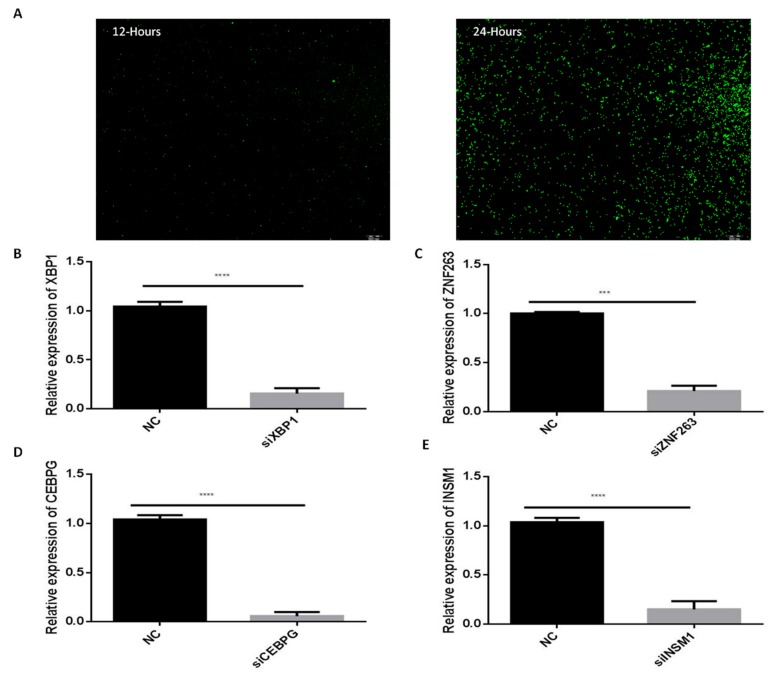
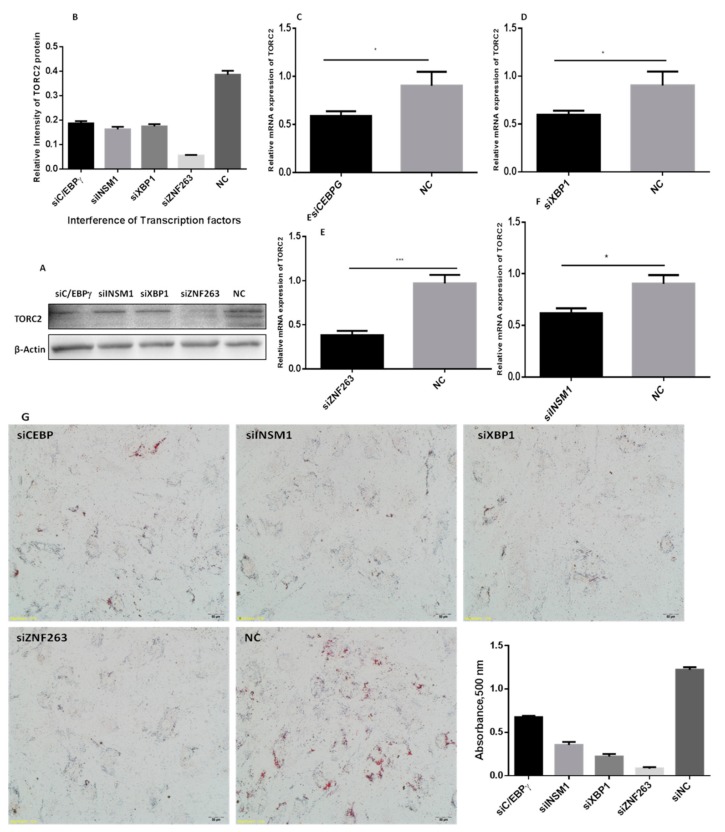
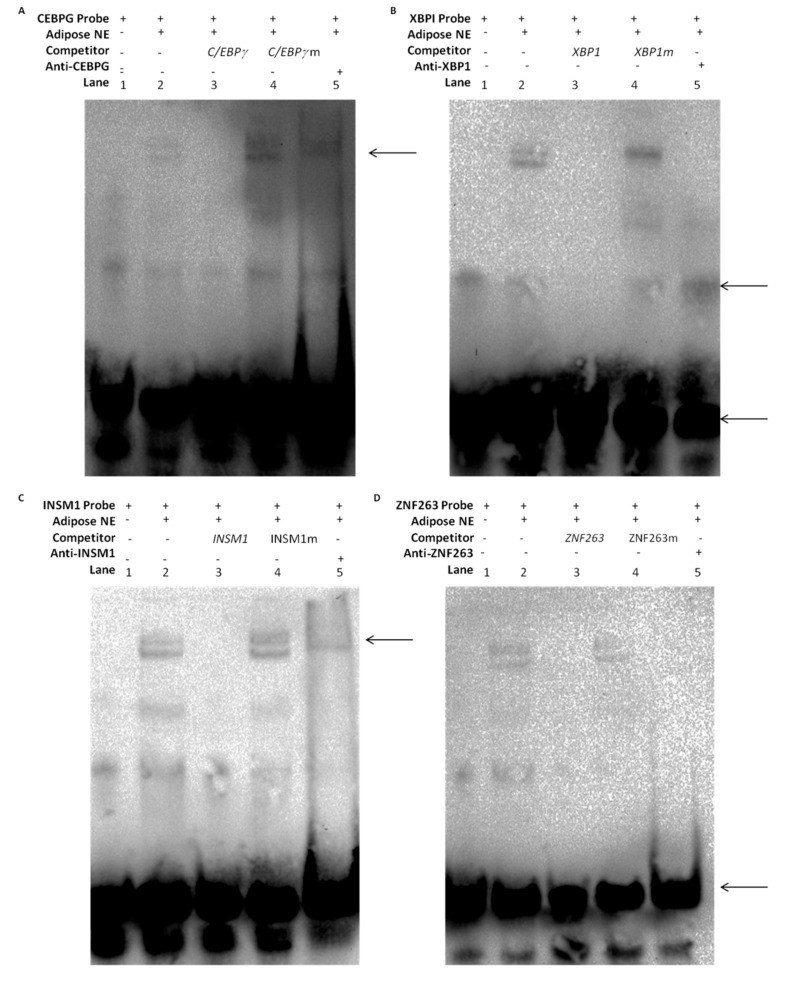
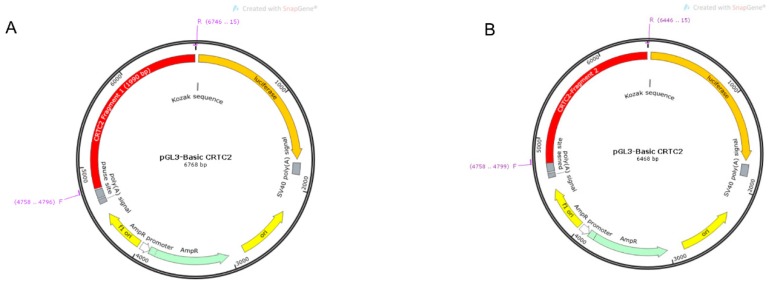
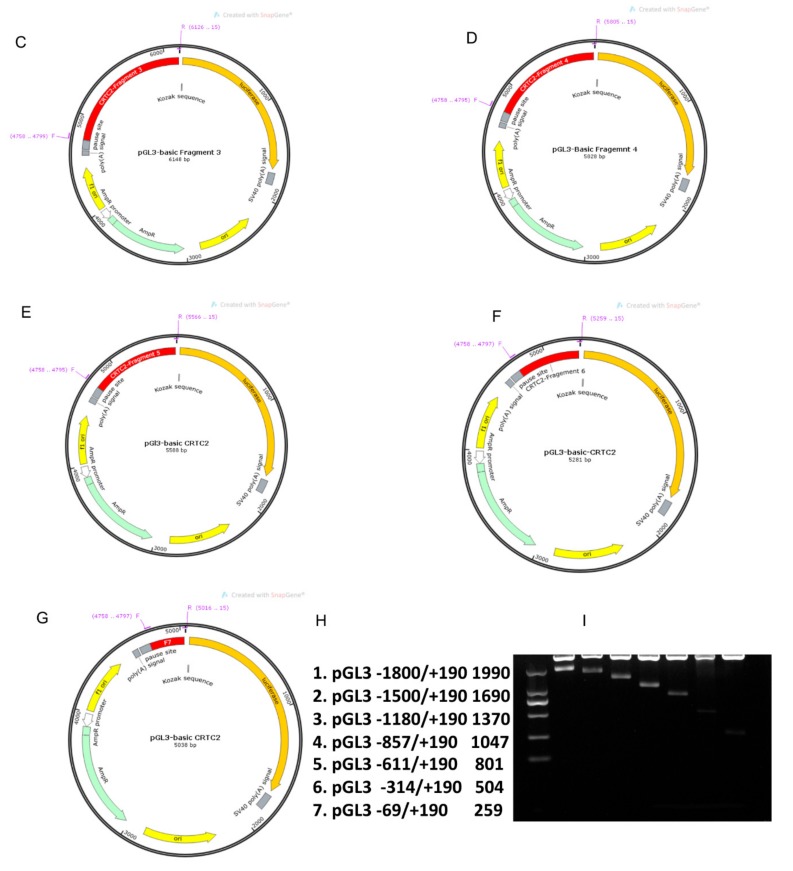
The TORC2 gene is a member of the transducer of the regulated cyclic adenosine monophosphate (cAMP) response element binding protein gene family, which plays a key role in metabolism and adipogenesis. In the present study, we confirmed the role of TORC2 in bovine preadipocyte proliferation through cell cycle staining flow cytometry, cell counting assay, 5-ethynyl-2'-deoxyuridine staining (EdU), and mRNA and protein expression analysis of proliferation-related marker genes. In addition, Oil red O staining analysis, immunofluorescence of adiponectin, mRNA and protein level expression of lipid related marker genes confirmed the role of TORC2 in the regulation of bovine adipocyte differentiation. Furthermore, the transcription start site and sub-cellular localization of the TORC2 gene was identified in bovine adipocytes. To investigate the underlying regulatory mechanism of the bovine TORC2, we cloned a 1990 bp of the 5' untranslated region (5'UTR) promoter region into a luciferase reporter vector and seven vector fragments were constructed through serial deletion of the 5'UTR flanking region. The core promoter region of the TORC2 gene was identified at location -314 to -69 bp upstream of the transcription start site. Based on the results of the transcriptional activities of the promoter vector fragments, luciferase activities of mutated fragments and siRNAs interference, four transcription factors (CCAAT/enhancer-binding protein C/BEP, X-box binding protein 1 XBP1, Insulinoma-associated 1 INSM1, and Zinc finger protein 263 ZNF263) were identified as the transcriptional regulators of TORC2 gene. These findings were further confirmed through Electrophoretic Mobility Shift Assay (EMSA) within nuclear extracts of bovine adipocytes. Furthermore, we also identified that C/EBP, XBP1, INSM1 and ZNF263 regulate TORC2 gene as activators in the promoter region. We can conclude that TORC2 gene is potentially a positive regulator of adipogenesis. These findings will not only provide an insight for the improvement of intramuscular fat in cattle, but will enhance our understanding regarding therapeutic intervention of metabolic syndrome and obesity in public health as well.

Keywords: DNA-Protein interaction; TORC2; adipogenesis; bovine adipocytes; gene regulation; intramuscular fat; luciferase reporter assay; nuclear protein; preadipocytes proliferation and differentiation; transcription factors.


Conflict of interest statement

The authors declare no conflict of interest

Figures

Figure 1
Figure 1
Transfection efficiency, tissue and cellular expression and sub cellular localization of the transducer of regulated cAMP response element-binding protein (CREB) 2 (TORC2) gene. (A) The mRNA expression level of the TORC2 gene in different tissues. Glyceraldehyde 3-phosphate dehydrogenase (GAPDH) was used as the housing gene (B,C) Real time qPCR was used for the detection of the TORC2 gene in preadipocytes transfected with OE-NC, OE-TORC2, siNC, and siTORC2. (D) Western blot analysis of the TORC2 protein gene in adipocytes transfected with OE-NC, OE-TORC2, siNC, and siTORC2. The analysis in (D) shows the overexpression efficiency of OE-TORC2 compared with OE-NC, and the silencing efficiency of TORC2 after transfecting the siTORC2 compared with siNC. (E) Subcellular localization of TORC2, immunofluorescence with the anti-TORC2 antibody (red), and nuclei were visualized with DAPI (blue) in bovine adipocytes. The right panel shows merged views. Pictures were captured though an Olympus IX71 microscope (OLYMPUS, Tokyo, Japan). One-way ANOVA and t-test were used for statistical analysis. Asterisks indicate significant variations. **** p < 0.0012.2. TORC2 promotes preadipocyte proliferation.
Figure 2
Figure 2
TORC2 promotes adipocyte proliferation. OE-NC, OE-TORC2, siNC, or siTORC2 were transiently transfected into bovine preadipocytes at 50% to 60% confluence, and cells were harvested at 24 h after transfection. (AF) Real time qPCR was used for the detection of cell cycle genes, PCNA, CDK1, CDK2, MCM6, p21 and p27 24 h after transfection. (G) Western blot analysis of the cell cycle genes. (H) Cell count was measured using a cell count kit 8 (CCK-8), and the results show absorbance values at a wavelength of 490 after incubation with 10% CCK-8 solution for 3 h. The plots of cell cycle analysis in different cell cycle phases were compared (IK) Cell cycle analysis was performed through a flow cytometer 24 h after transfection. (L,M) EdU (5-ethynyl-2′-deoxyuridine) assay was performed 24 h after transfection. Cells during DNA replication were stained by EdU (red), and the cell nuclei were stained with Hoechst (blue). The values represent mean ± SEM (n = 3). * p < 0.05 and *** p < 0.01.
Figure 3
Figure 3
TORC2 promotes bovine adipocyte differentiation. (AH) Expression level of genes related to adipocyte differentiation. Relative levels of mRNA of PPARγ, ACLY, ABHD5, CEBPα, FASN, SREBP-1, PLIN2, and ELOVL6 were measured by qRT-PCR. (K) The protein levels of PPARγ, ELOVL6 with reference protein β-ACTIN was measured through Western blotting. (I, J) Oil red O staining of bovine adipocyte cells at day 9 of differentiation transfected with OE-NC, OE-TORC2, siNC, or siTORC2. (L) Immunofluorescence of Adiponectin was performed at day 9 of differentiation of cells transfected with OE-NC, OE-TORC2, siNC, or siTORC2. The values represent the mean ± SEM (n = 3). * p < 0.05; ** p < 0.01; and *** p < 0.001.
Figure 4
Figure 4
Structural characteristics of the bovine TORC2 gene. (A) The 5′UTR promoter region sequence of the TORC2 gene. The transcription start site has been highlighted with yellow color, transcription binding sites of the respective cis-acting elements in the promoter of TORC2 gene have been boxed with their respective names shown above the line, while selected transcription factors (C/EBPγ, XBP1, ZNF263, and INSM1) were shown with a red color font in the core promoter region of TORC2 gene. (B) The molecular structure of the TORC2 gene with total length, number of exons, ORF, and number of amino acids. (C) The protein sequence has been shown with specific hits for domains site and super families in the protein sequence of the TORC2 gene. Three domains hits, including TORC-N, TORC-M and TORC-C, have been shown in the protein sequence with their specific hit sites. (D) The CpG island is indicated with the blue color. Horizontal dash line indicates the GC percentage in the promoter region of TORC2 gene. The dash vertical lines show transcription factors binding sites with their respective names mentioned in the top. The horizontal red line indicates the input sequence of the TORC2 gene promoter. The transcription start site is marked with +1. (E) Transcription start site of TORC2 gene through RACE (for 5′ end). TORC2 5′ RACE PCR product gel electrophoresis band (left). The sequence of TORC2 gene is (right), transcription start sites indicated with arrows, reverse primers sequence has been presented with underline sequence and translation start site (ATG) is shown with red color.
Figure 5
Figure 5
Luciferase reporter assay of the TORC2 promoter and identification of the transcription start site. (A) Transcriptional activity of promoter fragments TORC2-F1 (1990 −1800/+190), TORC2-F2 (1690 −1500/+190), TORC2-F3 (1370 −1180/+190), TORC2-F4 (1047 −857/+190), TORC2-F5 (801 −611/+190), TORC2-F6 (504 −314/+190), TORC2-F7 (259 −69/+190) and the pGL3-basic vector using dual-luciferase reporter assay. The reporter vector (pGL3-basic) was used as reference control to measure variation in the transcriptional activity in different fragment constructs through Tukey’s multiple comparison test. (B) Luciferase reporter assay conducted after site-directed mutation in the transcription factors binding sites of selected transcription factors (C/EBPγ, XBP1, ZNF263 and INSM1) located in the core promoter region of the TORC2 gene. Transcriptional activity of the two groups were compared through t-test with the activity of TORC2-F6 (504 −314/+190).
Figure 6
Figure 6
Genetic interaction and detailed phylogenetic tree with sequence alignment of the TORC2 gene and selected transcription factors within the promoter region of different animals. (A) Gene co-occurrence of TORC2 gene with C/EBPγ, XBP1, INSM1 and ZNF263 transcription factors in Bos taurus. The color denotes—for each gene of interest—the similarity of its best hit in a given STRING genome. Similarities in these presence/absence profiles can predict interactions among target genes. (B) Interaction among the target genes (shown in the center). (C) Phylogenetic tree and multiple sequence alignment analysis of TORC2 promoter region (−300 bp) for ZNF263, C/EBPγ, INSM1 and XBP1 transcription factor binding sites in cattle, human, water buffalo, sheep, goat, house mice, pig and wild yak. Selected transcription factor binding site sequences were found conserved in cattle, human, water buffalo, sheep, goat, pig and wild yak. However, variation was found in the DNA sequence of house mice as compared with other species.
Figure 7
Figure 7
Transfection and interference efficiencies of siRNAs. (A) FAM-labeled siRNA (NC). FAM-Labeled siRNA-NC was transfected into bovine adipocytes and transfection was checked after 6, 12 and 24 h intervals. Pictures were captured though an Olympus IX71 microscope (OLYMPUS). (B,E) the transcription factors XBP1, ZNF263, C/BEPγ, and INSM1 were down-regulated through small interference RNA (siRNA). The β-actin was as a housekeeping gene. Relative mRNA expression levels were normalized with NC. The values represent mean ± SEM (n = 3). * p < 0.05; *** p < 0.01; and **** p < 0.001.
Figure 8
Figure 8
Expression level of the TORC2 gene and cell phenotypes of adipocytes transfected with siRNAs of selected transcription factors. (A,B) Protein level of TORC2 in preadipocytes transfected with siC/EBPγ, siXBP1, siZNF263, siINSM1 and NC. (CF) Shows mRNA expression level of TORC2 gene in preadipocytes transfected with siC/EBPγ, siXBP1, siZNF263, siINSM1 and NC. GAPDH was used as the housekeeping gene. The values represent mean ± SEM (n = 3). * p < 0.05 and *** p < 0.01. (G) Shows the cell phenotypes of adipocytes transfected with siC/EBPγ, siXBP1, siZNF263, siINSM1 and NC stained with Oil red O staining.
Figure 9
Figure 9
Electrophoretic mobility shift assay (EMSA) shows in vitro DNA-protein interaction of C/EBPγ, XBP1, INSM1 and ZNF263 transcription factors to the TORC2 promoter. The nuclear protein extracts of bovine preadipocytes were incubated with the C/EBPγ (A), XBP1 (B), INSM1 and ZNF263 (D) free probes (lane 2), 10× non biotinated probes (lane 3), 10× mutated probes (lane 4) and the super shift migrated of DNA-Protein with anti-CEBPG, Anti-XBP1, Anti-INSM1 and Anti-ZNF263 antibodies complexes (lane 5) (AD). (AC) the arrow indicates the supershift of the protein-DNA complexes, (B,D) and the bottom arrows indicate that the amount of the main complexes was clearly decreased.
Figure 10
Figure 10
Amplification and cloning of TORC2 gene into pGL3-basic vector. (AG) Seven different fragments of TORC2 gene have been inserted into pGL3-basic vector and presented graphically through SnapGen software. (H,I) Indicates amplification of TORC2 gene seven fragments ligated into pGL3-basic vector and after the enzyme cut the seven fragments, including TORC2-F1 (1990 −1800/+190), TORC2-F2 (1690 −1500/+190), TORC2-F3 (1370 −1180/+190), TORC2-F4 (1047 −857/+190), TORC2-F5 (801 −611/+190), TORC2-F6 (504−314/+190) and TORC2-F7 (259−69/+190).
Figure 10
Figure 10
Amplification and cloning of TORC2 gene into pGL3-basic vector. (AG) Seven different fragments of TORC2 gene have been inserted into pGL3-basic vector and presented graphically through SnapGen software. (H,I) Indicates amplification of TORC2 gene seven fragments ligated into pGL3-basic vector and after the enzyme cut the seven fragments, including TORC2-F1 (1990 −1800/+190), TORC2-F2 (1690 −1500/+190), TORC2-F3 (1370 −1180/+190), TORC2-F4 (1047 −857/+190), TORC2-F5 (801 −611/+190), TORC2-F6 (504−314/+190) and TORC2-F7 (259−69/+190).

Similar articles

Cited by

References

    1. Cai H., Li M., Sun X., Plath M., Li C., Lan X., Lei C., Huang Y., Bai Y., Qi X., et al. Global Transcriptome Analysis During Adipogenic Differentiation and Involvement of Transthyretin Gene in Adipogenesis in Cattle. Front. Genet. 2018;9:463–473. doi: 10.3389/fgene.2018.00463. - DOI - PMC - PubMed
    1. Martins T.S., Sanglard L.M.P., Silva W., Chizzotti M.L., Renno L.N., Serao N.V.L., Silva F.F., Guimaraes S.E.F., Ladeira M.M., Dodson M.V., et al. Molecular Factors Underlying the Deposition of Intramuscular Fat and Collagen in Skeletal Muscle of Nellore and Angus Cattle. PLoS ONE. 2015;10:e0139943. doi: 10.1371/journal.pone.0139943. - DOI - PMC - PubMed
    1. Albrecht E., Gotoh T., Ebara F., Xu J.X., Viergutz T., Nurnberg G., Maak S., Wegner J. Cellular conditions for intramuscular fat deposition in Japanese Black and Holstein steers. Meat Sci. 2011;89:13–20. doi: 10.1016/j.meatsci.2011.03.012. - DOI - PubMed
    1. Sasaki Y., Nagai K., Nagata Y., Doronbekov K., Nishimura S., Yoshioka S., Fujita T., Shiga K., Miyake T., Taniguchi Y., et al. Exploration of Genes Showing Intramuscular Fat Deposition-Associated Expression Changes in Musculus Longissimus Muscle. Anim. Genet. 2006;37:40–46. doi: 10.1111/j.1365-2052.2005.01380.x. - DOI - PubMed
    1. Lee S.H., Gondro C., van der Werf J., Kim N.K., Lim D.J., Park E.W., Oh S.J., Gibson J.P., Thompson J.M. Use of a bovine genome array to identify new biological pathways for beef marbling in Hanwoo (Korean Cattle) BMC Genom. 2010;11:623–624. doi: 10.1186/1471-2164-11-623. - DOI - PMC - PubMed

MeSH terms

Substances