. 2019 Sep 4;11(9):1306.
doi: 10.3390/cancers11091306.

Clinical Significance of SERPINA1 Gene and Its Encoded Alpha1-antitrypsin Protein in NSCLC

Affiliations

Clinical Significance of SERPINA1 Gene and Its Encoded Alpha1-antitrypsin Protein in NSCLC

Evrim Ercetin et al. Cancers (Basel). .

Abstract

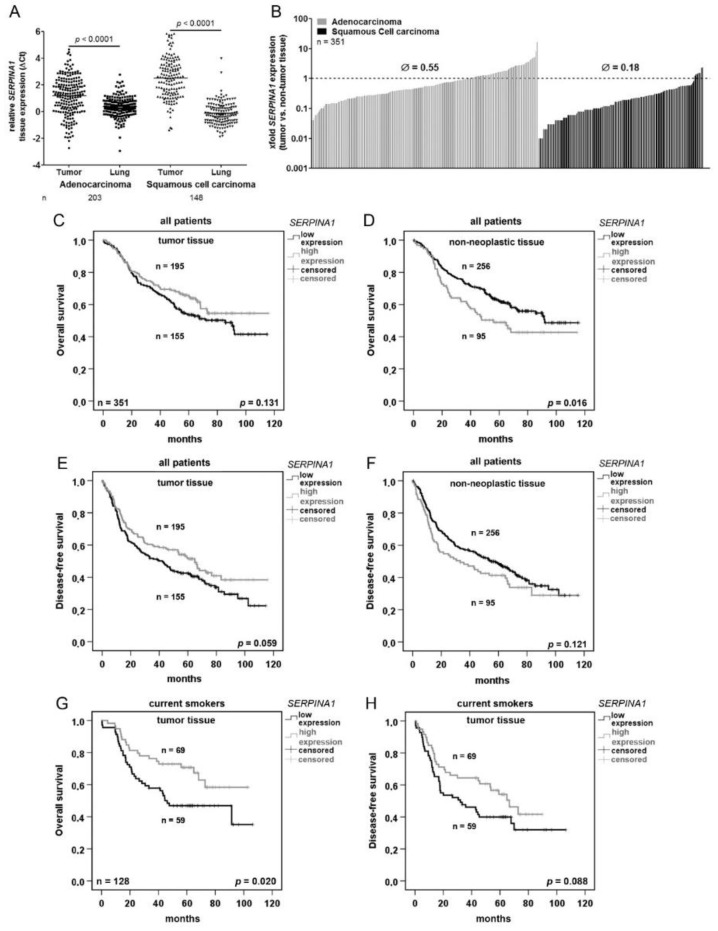
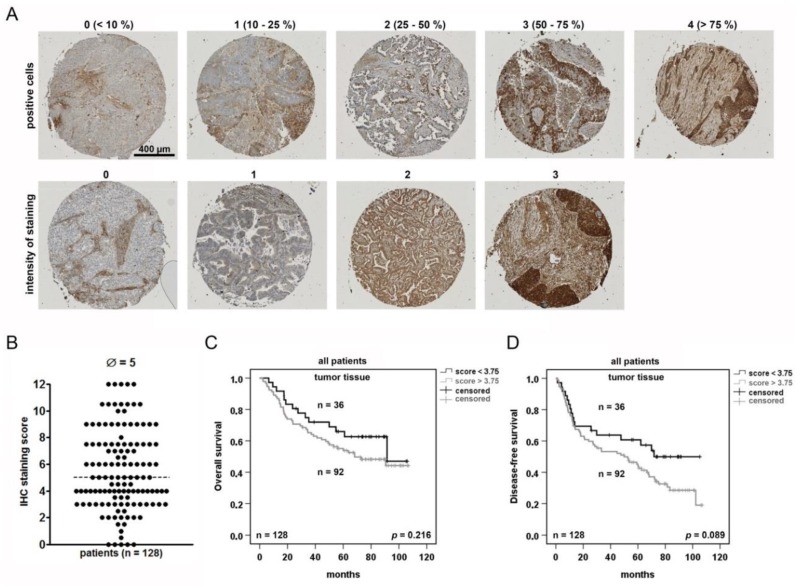
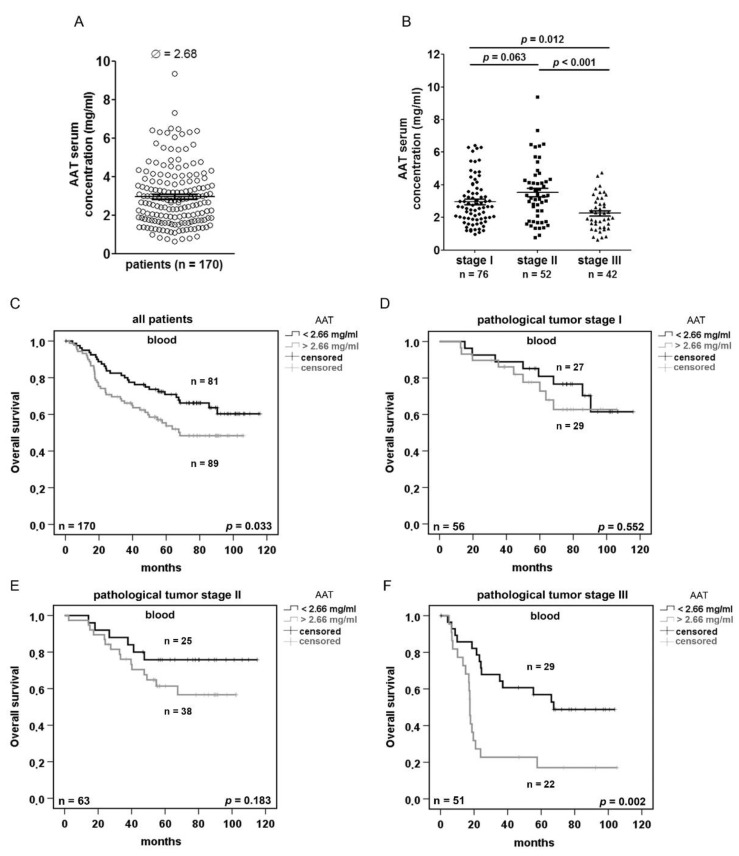
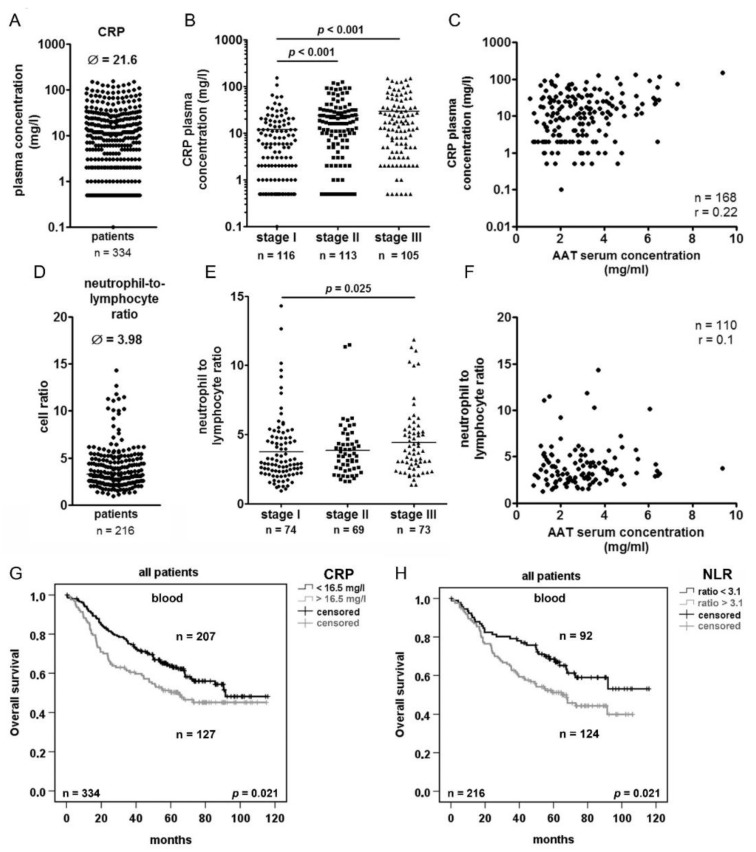
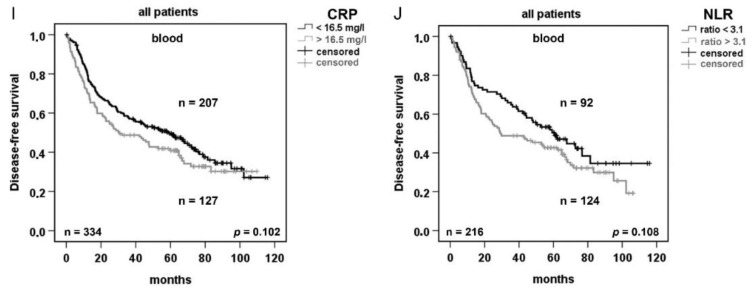
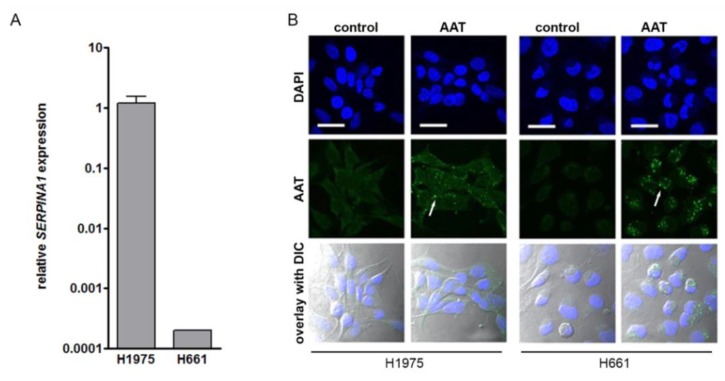
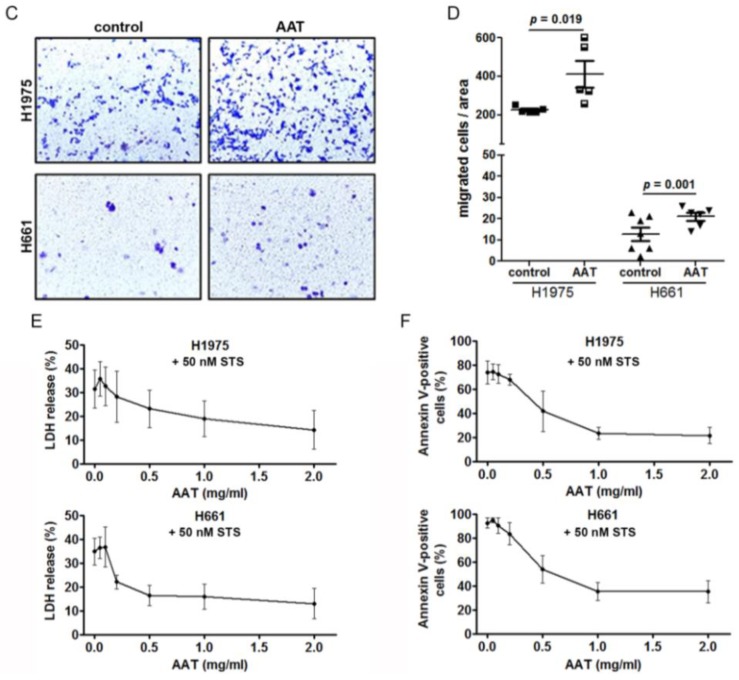
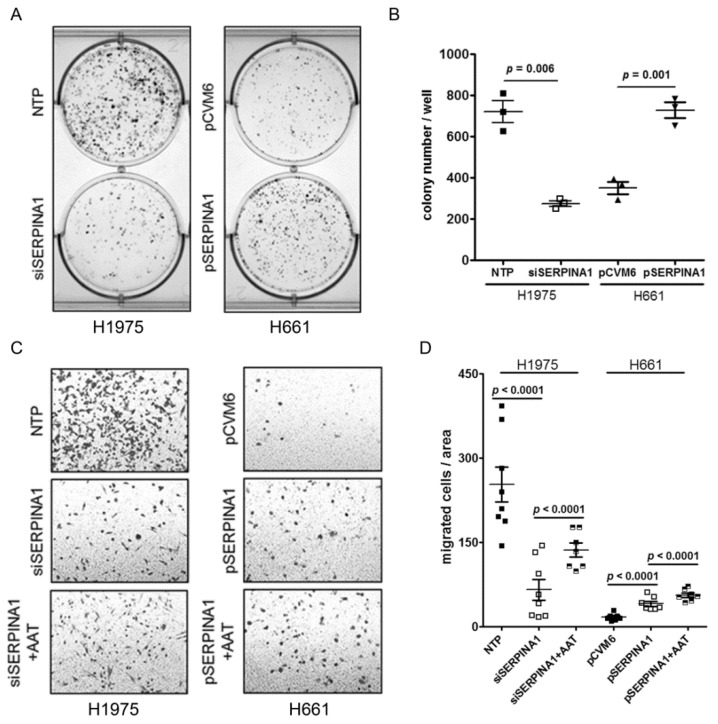
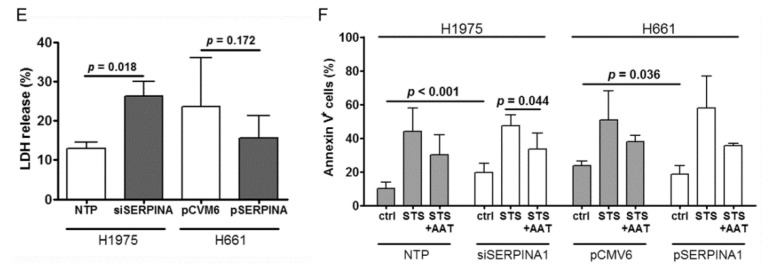
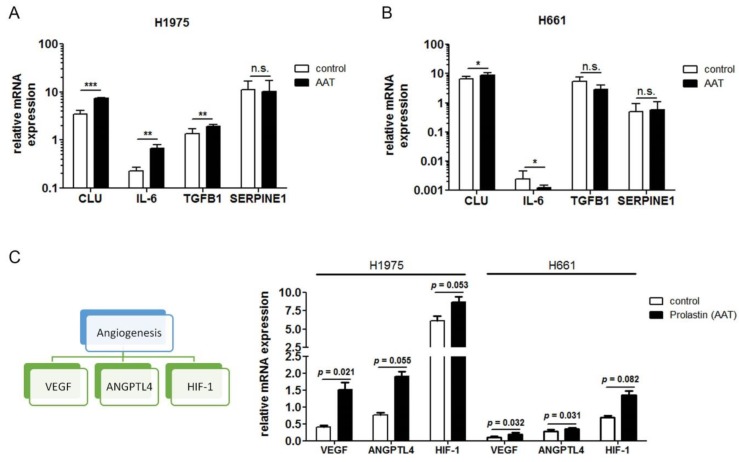
Abstract: High expression of SERPINA1 gene encoding acute phase protein, alpha1-antitrypsin (AAT), is associated with various tumors. We sought to examine the significance of SERPINA1 and AAT protein in non-small-cell lung cancer (NSCLC) patients and NSCLC cell lines. Tumor and adjacent non-tumor lung tissues and serum samples from 351 NSCLC patients were analyzed for SERPINA1 expression and AAT protein levels. We also studied the impact of SERPINA1 expression and AAT protein on H1975 and H661 cell behavior, in vitro. Lower SERPINA1 expression in tumor but higher in adjacent non-tumor lung tissues (n = 351, p = 0.016) as well as higher serum levels of AAT protein (n = 170, p = 0.033) were associated with worse survival rates. Specifically, in NSCLC stage III patients, higher blood AAT levels (>2.66 mg/mL) correlated with a poor survival (p = 0.002). Intriguingly, levels of serum AAT do not correlate with levels of C-reactive protein, neutrophils-to-leukocyte ratio, and do not correlate with SERPINA1 expression or AAT staining in the tumor tissue. Additional experiments in vitro revealed that external AAT and/or overexpressed SERPINA1 gene significantly improve cancer cell migration, colony formation and resistance to apoptosis. SERPINA1 gene and AAT protein play an active role in the pathogenesis of lung cancer and not just reflect inflammatory reaction related to cancer development.

Keywords: SERPINA1; acute phase proteins; alpha1-antitrypsin; apoptosis; inflammation; lung cancer; migration.


Conflict of interest statement

Michael Meister and Sabina Janciauskiene report grants from German Center for Lung Research during the conduct of the study. Thomas Muley reports grants and personal fees from the German Center for Lung Research (DZL) during the conduct of the study and grants and personal fees from Roche outside the submitted work. Marc A Schneider reports grants and personal fees from German Center for Lung Research (DZL) during the conduct of the study. Tobias Welte received travel support and personal fees from Grifols and CSL Behring. Other authors declare no potential conflicts of interest.

Figures

Figure 1
Figure 1
SERPINA1 expression is downregulated in NSCLC and is a prognostic factor for overall and disease-free survival. (A) Relative expression (ΔCt) of SERPINA1 in tumor and in paired non-tumor lung tissues. SERPINA1 expression was normalized to reference genes ESD and RPS18. A higher relative value means a lower gene expression. (B) SERPINA1 expression ratio (tumor vs. non-tumor lung tissue) in 351 NSCLC patients. Dotted line indicates equal expression in tumor and lung tissue. (CF). Kaplan-Meier overall and disease-free survival curves for all patients. (G) and (H) Kaplan-Meier overall and disease-free survival curves for current smokers. The program cut-off finder (http://molpath.charite.de/cutoff/) was used to define the values separating the groups. p < 0.05 was considered significant.
Figure 2
Figure 2
Tumor cells positive for AAT are prognostic indicator for the patient’s disease-free survival. (A) Scoring of NSCLC according to a positive AAT staining. Tissue micro array (TMA) with two cores for each sample was stained for AAT. (B) Immunohistochemistry (IHC) score generated from multiplication of intensity of staining and positivity for AAT protein. (C) and (D) Kaplan-Meier overall and disease-free survival curves using the staining score of 3.75 as cut-off to separate the two groups. p < 0.05 was considered significant.
Figure 3
Figure 3
Serum levels of AAT in NSCLC patients increase with advanced tumor stages and are prognostic for the patient’s outcome. (A) ELISA based quantification of serum AAT in 170 NSCLC patients. (B) Serum concentrations of AAT in patients with stage cancer I, II and III. (C–F) Kaplan-Meier overall survival curves using 2.66 mg/mL AAT as cut-off to separate the two groups. p < 0.05 was considered significant.
Figure 4
Figure 4
Elevated plasma CRP levels and a high neutrophil to lymphocyte ratio (NLR) are prognostic factors for the survival of NSCLC patients. (A) ELISA- based quantification of serum CRP levels in 338 NSCLC patients. (B) Serum concentrations of CRP in patients with cancer stage I, II and III. (C) Correlation between serum concentration of AAT and CRP. (D) Neutrophil-to lymphocyte ratio in 120 NSCLC patients. (E) Neutrophil-to-lymphocyte ratio in patients with cancer stage I, II and III. (F) Correlation between neutrophil-to-lymphocyte ratio and serum AAT concentration. (G) and (I) Kaplan-Meier overall and disease-free survival curves generated based on 16.5 mg/l cut-off of CRP to separate the two groups of patients. (H) and (J) Kaplan-Meier overall and disease-free survival curves generated based on cut-off of 3.1 NLR to separate the two groups of patients. p < 0.05 was considered significant. r > 0.5 was considered as correlation.
Figure 4
Figure 4
Elevated plasma CRP levels and a high neutrophil to lymphocyte ratio (NLR) are prognostic factors for the survival of NSCLC patients. (A) ELISA- based quantification of serum CRP levels in 338 NSCLC patients. (B) Serum concentrations of CRP in patients with cancer stage I, II and III. (C) Correlation between serum concentration of AAT and CRP. (D) Neutrophil-to lymphocyte ratio in 120 NSCLC patients. (E) Neutrophil-to-lymphocyte ratio in patients with cancer stage I, II and III. (F) Correlation between neutrophil-to-lymphocyte ratio and serum AAT concentration. (G) and (I) Kaplan-Meier overall and disease-free survival curves generated based on 16.5 mg/l cut-off of CRP to separate the two groups of patients. (H) and (J) Kaplan-Meier overall and disease-free survival curves generated based on cut-off of 3.1 NLR to separate the two groups of patients. p < 0.05 was considered significant. r > 0.5 was considered as correlation.
Figure 5
Figure 5
Exogenously added AAT induces cancer cell migration, increases viability and resistance against staurosporine-induced apoptosis. (A) SERPINA1 expression relative to housekeeping gene POLR2A in H1975 and H661 cell lines. Data presented as the mean ± SD from three independent measurements. (B) Confocal immunofluorescence staining images of AAT protein (green) in H1975 and H661 in control and AAT (2 mg/mL) treated cells for 18 hours in serum-free medium. Nuclei were defined by DAPI (blue). Scale bar: 30 µm. (C) and (D) Migratory properties of H1975 and H661 cells without and with pre-treatment of AAT (2 mg/mL). The migrated cells were stained with 0.1% crystal violet. The graphs indicate data from three independent experiments as mean ± SD. p < 0.05 was considered as significant. (E) H1975 and H661 cells were treated with 50 nM staurosporine (STS) alone or together with AAT (0.05–2 mg/mL) for 18 hours and lactate dehydrogenase (LDH) release was measured. Each point is a mean ± SD from six independent experiments. (F) H1975 and H661 cells were treated with 50 nM STS alone or together with AAT (0.05–2 mg/mL) for 18 hours. Annexin V surface expression was determined by flow cytometry. Experiments were repeated four times. Each point represents a mean ± SD. p < 0.05 was considered as significant.
Figure 5
Figure 5
Exogenously added AAT induces cancer cell migration, increases viability and resistance against staurosporine-induced apoptosis. (A) SERPINA1 expression relative to housekeeping gene POLR2A in H1975 and H661 cell lines. Data presented as the mean ± SD from three independent measurements. (B) Confocal immunofluorescence staining images of AAT protein (green) in H1975 and H661 in control and AAT (2 mg/mL) treated cells for 18 hours in serum-free medium. Nuclei were defined by DAPI (blue). Scale bar: 30 µm. (C) and (D) Migratory properties of H1975 and H661 cells without and with pre-treatment of AAT (2 mg/mL). The migrated cells were stained with 0.1% crystal violet. The graphs indicate data from three independent experiments as mean ± SD. p < 0.05 was considered as significant. (E) H1975 and H661 cells were treated with 50 nM staurosporine (STS) alone or together with AAT (0.05–2 mg/mL) for 18 hours and lactate dehydrogenase (LDH) release was measured. Each point is a mean ± SD from six independent experiments. (F) H1975 and H661 cells were treated with 50 nM STS alone or together with AAT (0.05–2 mg/mL) for 18 hours. Annexin V surface expression was determined by flow cytometry. Experiments were repeated four times. Each point represents a mean ± SD. p < 0.05 was considered as significant.
Figure 6
Figure 6
Silencing or overexpressing SERPINA1 gene affects cancer cell colony formation, migration, viability and resistance to apoptosis. (A) and (B) Cancer colony number per area in SERPINA1 siRNA-treated H1975 cells or SERPINA1 overexpressing H661 cells. Each point represents a separate experiment. Data presented as mean ± SD. p < 0.05 was considered as significant. (C) and (D) The migratory abilities of H1975 cells after SERPINA1-knockdown and H661 cells after SERPINA1 overexpression with/without addition of AAT. The graphs indicate data from three independent experiments as mean ± SD. p < 0.05 was considered as significant. (E) LDH release rate after silencing or overexpression of SERPINA1. H1975 and H661 cells were treated with 50 nM STS alone or together with AAT (2 mg/mL) for 18 h after SERPINA1 knockout or overexpression, respectively. All experiments were performed in duplicates and repeated three times. Each point represents a mean ± SD. p < 0.05 was considered as significant. (F) H1975 and H661 cells were treated with 50 nM STS alone or together with AAT (2 mg/mL) for 18 h. Annexin V surface expression was determined by flow cytometry. All experiments were performed in duplicates and repeated three times. Each point represents a mean ± SD. p < 0.05 was considered as significant. NTP: non-target-pool siRNA and pCVM6 as control vector.
Figure 6
Figure 6
Silencing or overexpressing SERPINA1 gene affects cancer cell colony formation, migration, viability and resistance to apoptosis. (A) and (B) Cancer colony number per area in SERPINA1 siRNA-treated H1975 cells or SERPINA1 overexpressing H661 cells. Each point represents a separate experiment. Data presented as mean ± SD. p < 0.05 was considered as significant. (C) and (D) The migratory abilities of H1975 cells after SERPINA1-knockdown and H661 cells after SERPINA1 overexpression with/without addition of AAT. The graphs indicate data from three independent experiments as mean ± SD. p < 0.05 was considered as significant. (E) LDH release rate after silencing or overexpression of SERPINA1. H1975 and H661 cells were treated with 50 nM STS alone or together with AAT (2 mg/mL) for 18 h after SERPINA1 knockout or overexpression, respectively. All experiments were performed in duplicates and repeated three times. Each point represents a mean ± SD. p < 0.05 was considered as significant. (F) H1975 and H661 cells were treated with 50 nM STS alone or together with AAT (2 mg/mL) for 18 h. Annexin V surface expression was determined by flow cytometry. All experiments were performed in duplicates and repeated three times. Each point represents a mean ± SD. p < 0.05 was considered as significant. NTP: non-target-pool siRNA and pCVM6 as control vector.
Figure 7
Figure 7
Validation of AAT-regulated genes in H1975 and H661 by qPCR. (A) and (B) Gene expression relative to housekeeping gene POLR2A of selected genes from RNA-seq analysis of H1975 and H661. Data presented as the mean ± SD from three independent measurements. (C) Gene expression relative to housekeeping gene POLR2A of genes involved in angiogenesis and hypoxia. * p < 0.05, ** p < 0.005, *** p < 0.001.

Similar articles

Cited by

References

    1. Devesa S.S., Bray F., Vizcaino A.P., Parkin D.M. International lung cancer trends by histologic type: Male:Female differences diminishing and adenocarcinoma rates rising. Int. J. Cancer. 2005;117:294–299. doi: 10.1002/ijc.21183. - DOI - PubMed
    1. Torre L.A., Bray F., Siegel R.L., Ferlay J., Lortet-Tieulent J., Jemal A. Global cancer statistics, 2012. Cancer J. Clin. 2015;65:87–108. doi: 10.3322/caac.21262. - DOI - PubMed
    1. Goldstraw P., Chansky K., Crowley J., Rami-Porta R., Asamura H., Eberhardt W.E., Nicholson A.G., Groome P., Mitchell A., Bolejack V., et al. The iaslc lung cancer staging project: Proposals for revision of the tnm stage groupings in the forthcoming (eighth) edition of the tnm classification for lung cancer. J. Thorac. Oncol. 2016;11:39–51. doi: 10.1016/j.jtho.2015.09.009. - DOI - PubMed
    1. Roxburgh C.S., McMillan D.C. Role of systemic inflammatory response in predicting survival in patients with primary operable cancer. Future Oncol. 2010;6:149–163. doi: 10.2217/fon.09.136. - DOI - PubMed
    1. Yu Y., Qian L., Cui J. Value of neutrophil-to-lymphocyte ratio for predicting lung cancer prognosis: A meta-analysis of 7219 patients. Mol. Clin. Oncol. 2017;7:498–506. doi: 10.3892/mco.2017.1342. - DOI - PMC - PubMed