. 2019 Sep 5;20(1):453.
doi: 10.1186/s12859-019-3031-y.

Fast and accurate average genome size and 16S rRNA gene average copy number computation in metagenomic data

Affiliations

Fast and accurate average genome size and 16S rRNA gene average copy number computation in metagenomic data

Emiliano Pereira-Flores et al. BMC Bioinformatics. .

Abstract

Background: Metagenomics caused a quantum leap in microbial ecology. However, the inherent size and complexity of metagenomic data limit its interpretation. The quantification of metagenomic traits in metagenomic analysis workflows has the potential to improve the exploitation of metagenomic data. Metagenomic traits are organisms' characteristics linked to their performance. They are measured at the genomic level taking a random sample of individuals in a community. As such, these traits provide valuable information to uncover microorganisms' ecological patterns. The Average Genome Size (AGS) and the 16S rRNA gene Average Copy Number (ACN) are two highly informative metagenomic traits that reflect microorganisms' ecological strategies as well as the environmental conditions they inhabit.

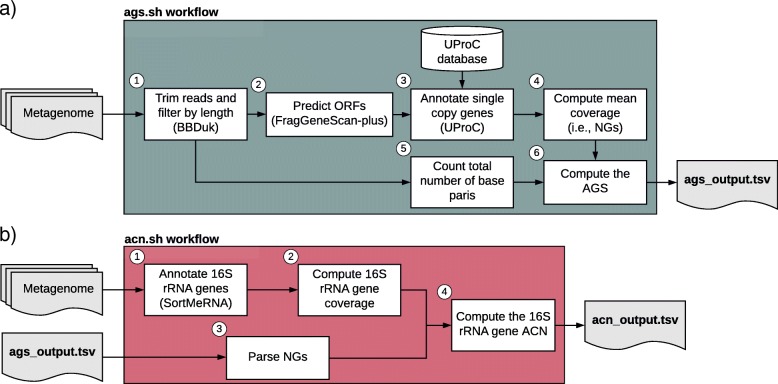
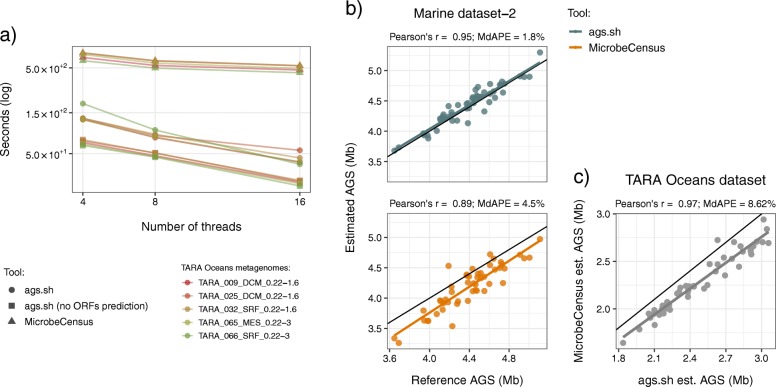
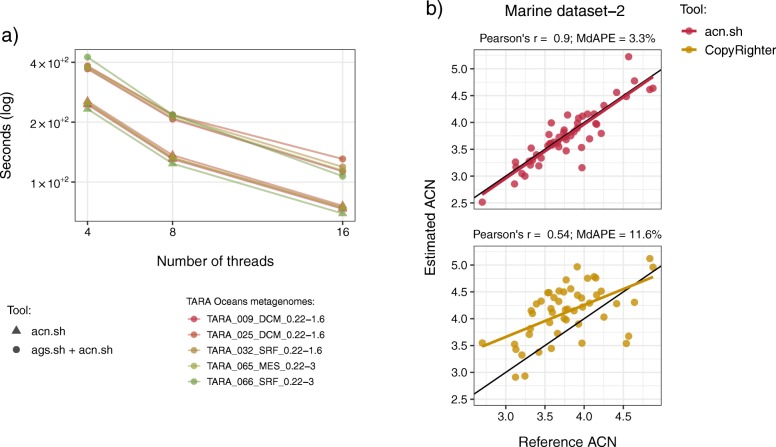
Results: Here, we present the ags.sh and acn.sh tools, which analytically derive the AGS and ACN metagenomic traits. These tools represent an advance on previous approaches to compute the AGS and ACN traits. Benchmarking shows that ags.sh is up to 11 times faster than state-of-the-art tools dedicated to the estimation AGS. Both ags.sh and acn.sh show comparable or higher accuracy than existing tools used to estimate these traits. To exemplify the applicability of both tools, we analyzed the 139 prokaryotic metagenomes of TARA Oceans and revealed the ecological strategies associated with different water layers.

Conclusion: We took advantage of recent advances in gene annotation to develop the ags.sh and acn.sh tools to combine easy tool usage with fast and accurate performance. Our tools compute the AGS and ACN metagenomic traits on unassembled metagenomes and allow researchers to improve their metagenomic data analysis to gain deeper insights into microorganisms' ecology. The ags.sh and acn.sh tools are publicly available using Docker container technology at https://github.com/pereiramemo/AGS-and-ACN-tools .

Keywords: 16S rRNA gene average copy number; Average genome size; Functional traits; Metagenomics; Microbial ecology.


Conflict of interest statement

The authors declare that they have no competing interests.

Figures

Fig. 1
Fig. 1
Workflows implemented in the ags.sh and acn.sh tools. a ags.sh workflow consists of the following steps: 1) Filtering out and trimming reads to obtain an appropriate read length range using the BBduk tool [29] (optional step); 2) Predicting the Open Reading Frames (ORFs) with FragGeneScan-plus [30] (optional step); 3) Annotating the single-copy genes in the ORF’s amino acid sequences with UProC [32]; 4) Computing the Number of Genomes (NGs) as the mean gene coverage of the single-copy genes; 5) Counting the total number of base pairs; 6) Computing the Average Genome Size (AGS) as the ratio of the total number of base pairs to the NGs. b The tasks performed by acn.sh are as follows: 1) Annotating the 16S rRNA genes with SortMeRNA [34]; 2) Computing the 16S rRNA gene coverage as the number of annotated base pairs divided by the 16S rRNA gene length; 3) Parsing the NGs from the ags.sh output; 4) Computing the ratio of the 16S rRNA gene coverage to the NGs to derive the 16S rRNA gene Average Copy Number (ACN)
Fig. 2
Fig. 2
Benchmarking the running time and accuracy ags.sh against MicrobeCensus. a Plot comparing the running time of ags.sh with MicrobeCensus. We compared the wall-clock runtime between both tools using 4, 8, and 16 threads, in five TARA Oceans metagenomes subsampled to two million paired-end reads. We also compared the ags.sh runtime using previously predicted Open Reading Frames (ORFs). When the ORF prediction procedure was included, ags.sh was 11 times faster than MicrobeCensus using 16 threads. b Scatter plots comparing the accuracy of the AGS computed by ags.sh (upper panel) and MicrobeCensus (lower panel) with the reference AGS in the metagenomes of the Marine dataset-2. c Scatter plot comparing the AGS computed by ags.sh and MicrobeCensus in 50 TARA Oceans metagenomes, randomly subsampled to two million reads. The black line shown in the scatter plots from b) and c) represents the one-to-one relationship. The absolute percentage error was computed as 100 x |(AGSref - AGSest)/AGSref|, where AGSest and AGSref are the estimated and reference AGS, respectively. MdAPE acronym stands for Median Absolute Percentage Error
Fig. 3
Fig. 3
Evaluating the running time of acn.sh and benchmarking its accuracy against CopyRighter. a Plot showing the wall-clock runtime of acn.sh, and the running time of ags.sh plus acn.sh, using 4, 8, and 16 threads, for the computation of the 16S rRNA gene Average Copy Number (ACN) in five TARA Oceans metagenomes subsampled to two million paired-end reads. b Scatter plot comparing the ACN computed by acn.sh (upper panel) and CopyRighter (lower panel) with the reference ACN in the metagenomes of the Marine dataset-2. The black line shown in the plot represents the one-to-one relationship. Similarly as above, we applied the following formula to compute the absolute percentage error: 100 x |(ACNref - ACNest)/ACNref|, where ACNest and ACNref are the estimated and reference ACN, respectively
Fig. 4
Fig. 4
Exploratory analyses performed on TARA Oceans metagenomes. a Scatter plot comparing the AGS and ACN in the matching subset of 63 TARA Oceans metagenomes representing the surface, deep chlorophyll maximum and mesopelagic water layers (SRF, DCM, and MES, respectively) in 21 sampling sites. The box plots in the lower and left-hand side panels show the distributions of the Average Genome Size (AGS) and 16S rRNA gene Average Copy Number (ACN) in the SRF, DCM, and MES water layers. For the sake of clarity, two metagenomes with relatively large AGS or ACN values were not included in the plot. These are the TARA_076_DCM_0.22–3 with an AGS = 5,036,010 bp and TARA_064_DCM_0.22–3 with an ACN = 2.4. b Scatter plots comparing the AGS with the log relative abundance of the Herbiconiux and Candidatus Pelagibacter genera (upper and lower panel, respectively) in TARA Oceans metagenomes. Herbiconiux and Candidatus Pelagibacter genera had the strongest positive and negative Pearson’s correlations with the AGS, respectively. c Scatter plot comparing the ACN with the log relative abundance of the Glaciecola genus in TARA Oceans metagenomes. This genus showed the strongest positive Pearson’s correlation with the ACN. The abundance of these genera was computed by Sunagawa et al. based on the annotation of 16S rDNA Operational Taxonomic Units (OTUs). d Scatter plot comparing the AGS with the functional richness of TARA Oceans metagenomes. The functional richness was computed by Sunagawa et al. based on the abundance estimation of eggNOG orthologous groups

Similar articles

Cited by

References

    1. Gilbert JA, Dupont CL. Microbial metagenomics: beyond the genome. Annu Rev Mar Sci. 2011;3:347–371. doi: 10.1146/annurev-marine-120709-142811. - DOI - PubMed
    1. Violle C, Reich PB, Pacala SW, Enquist BJ, Kattge J. The emergence and promise of functional biogeography. Proc Natl Acad Sci. 2014;111(38):13690–13696. doi: 10.1073/pnas.1415442111. - DOI - PMC - PubMed
    1. Krause S, Le Roux X, Niklaus PA, Van Bodegom PM, Lennon JT, Bertilsson S, et al. Trait-based approaches for understanding microbial biodiversity and ecosystem functioning. Front Microbiol. 2014;5:251. doi: 10.3389/fmicb.2014.00251. - DOI - PMC - PubMed
    1. Martiny JB, Jones SE, Lennon JT, Martiny AC. Microbiomes in light of traits: a phylogenetic perspective. Science. 2015;350(6261):aac9323. doi: 10.1126/science.aac9323. - DOI - PubMed
    1. Fierer N, Barberán A, Laughlin DC. Seeing the forest for the genes: using metagenomics to infer the aggregated traits of microbial communities. Front Microbiol. 2014;5:614. doi: 10.3389/fmicb.2014.00614. - DOI - PMC - PubMed

Substances