

Analytical Treatment Interruption after Short-Term Antiretroviral Therapy in a Postnatally Simian-Human Immunodeficiency Virus-Infected Infant Rhesus Macaque Model
- PMID: 31488511
- PMCID: PMC6945967
- DOI: 10.1128/mBio.01971-19
Analytical Treatment Interruption after Short-Term Antiretroviral Therapy in a Postnatally Simian-Human Immunodeficiency Virus-Infected Infant Rhesus Macaque Model
Abstract
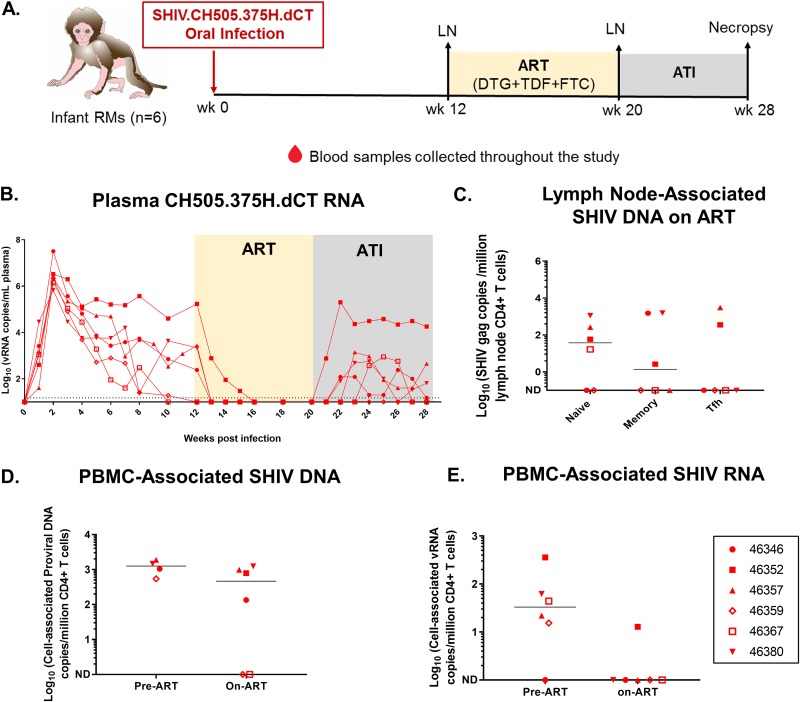
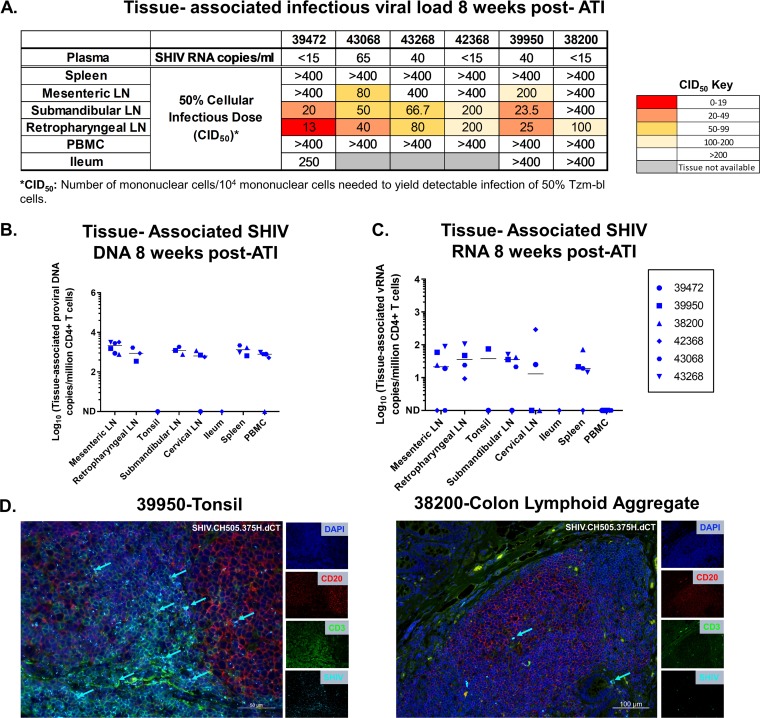
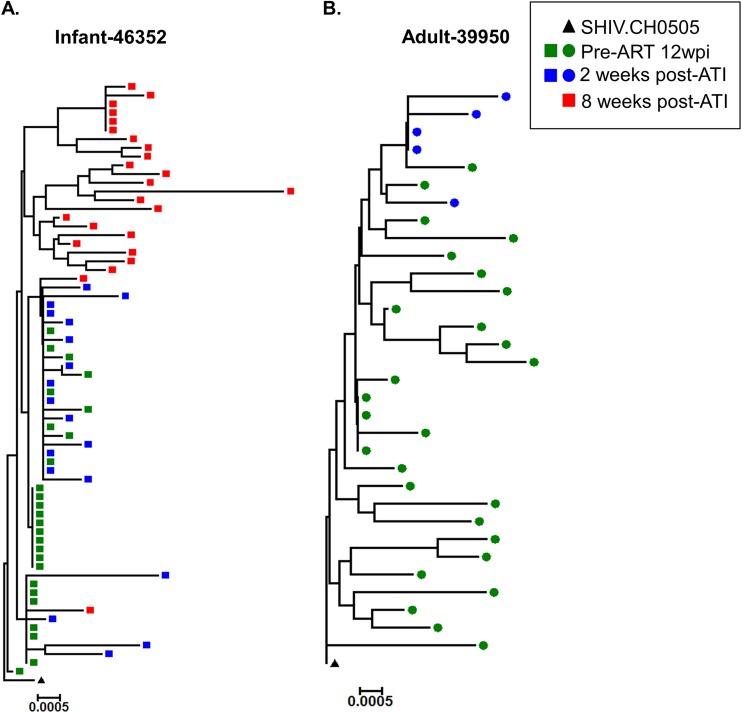
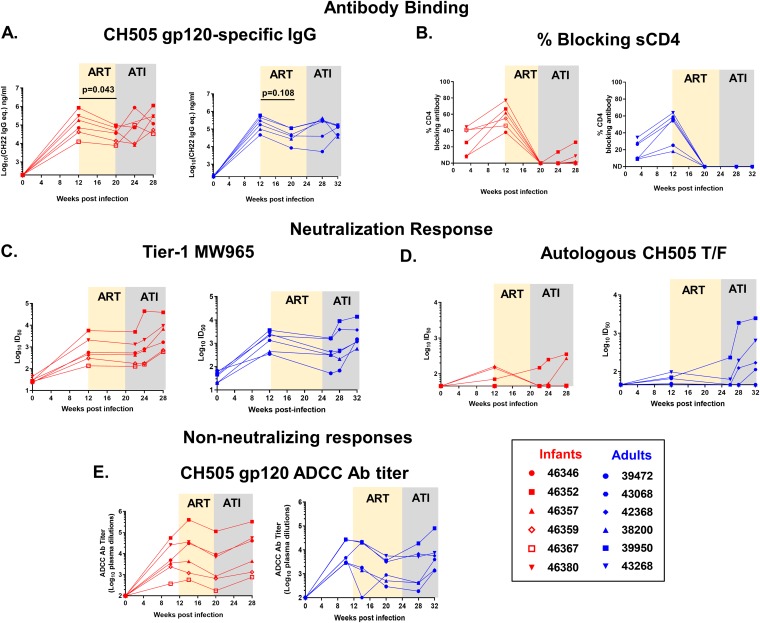
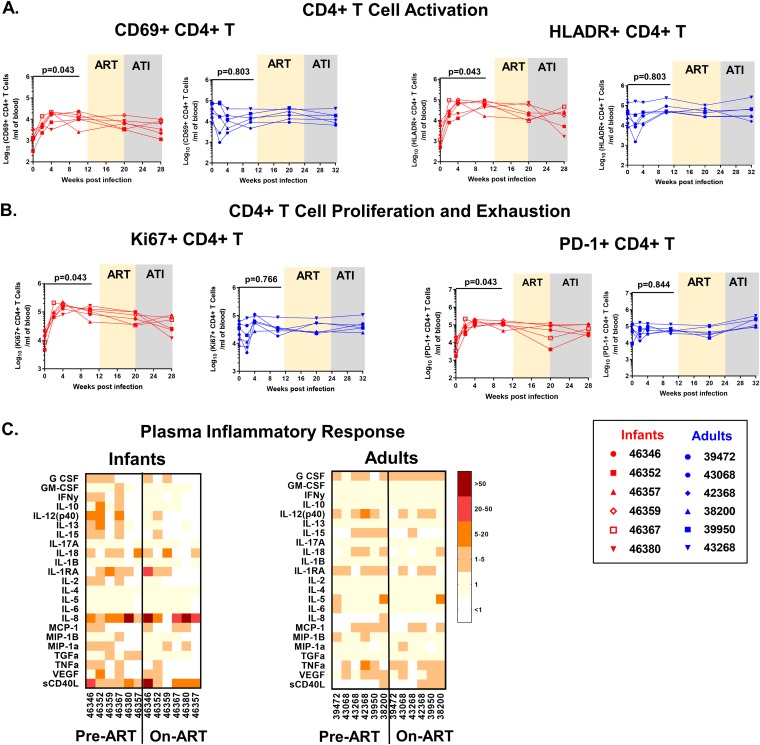
To achieve long-term viral remission in human immunodeficiency virus (HIV)-infected children, novel strategies beyond early antiretroviral therapy (ART) will be necessary. Identifying clinical predictors of the time to viral rebound upon ART interruption will streamline the development of novel therapeutic strategies and accelerate their evaluation in clinical trials. However, identification of these biomarkers is logistically challenging in infants, due to sampling limitations and the potential risks of treatment interruption. To facilitate the identification of biomarkers predicting viral rebound, we have developed an infant rhesus macaque (RM) model of oral simian-human immunodeficiency virus (SHIV) SHIV.CH505.375H.dCT challenge and analytical treatment interruption (ATI) after short-term ART. We used this model to characterize SHIV replication kinetics and virus-specific immune responses during short-term ART or after ATI and demonstrated plasma viral rebound in 5 out of 6 (83%) infants. We observed a decline in humoral immune responses and partial dampening of systemic immune activation upon initiation of ART in these infants. Furthermore, we monitored SHIV replication and rebound kinetics in infant and adult RMs and found that both infants and adults demonstrated equally potent virus-specific humoral immune responses. Finally, we validated our models by confirming a well-established correlate of the time to viral rebound, namely, the pre-ART plasma viral load, as well as identified additional potential humoral immune correlates. Thus, this model of infant ART and viral rebound can be used and further optimized to define biomarkers of viral rebound following long-term ART as well as to preclinically assess novel therapies to achieve a pediatric HIV functional cure.IMPORTANCE Novel interventions that do not rely on daily adherence to ART are needed to achieve sustained viral remission for perinatally infected children, who currently rely on lifelong ART. Considering the risks and expense associated with ART interruption trials, the identification of biomarkers of viral rebound will prioritize promising therapeutic intervention strategies, including anti-HIV Env protein therapeutics. However, comprehensive studies to identify those biomarkers are logistically challenging in human infants, demanding the need for relevant nonhuman primate models of HIV rebound. In this study, we developed an infant RM model of oral infection with simian-human immunodeficiency virus expressing clade C HIV Env and short-term ART followed by ATI, longitudinally characterizing the immune responses to viral infection during ART and after ATI. Additionally, we compared this infant RM model to an analogous adult RM rebound model and identified virologic and immunologic correlates of the time to viral rebound after ATI.
Keywords: HIV reservoir; SHIV; analytical treatment interruption; pediatric HIV cure.
Copyright © 2019 Goswami et al.
Figures


Similar articles
-
SMAC Mimetic Plus Triple-Combination Bispecific HIVxCD3 Retargeting Molecules in SHIV.C.CH505-Infected, Antiretroviral Therapy-Suppressed Rhesus Macaques.J Virol. 2020 Oct 14;94(21):e00793-20. doi: 10.1128/JVI.00793-20. Print 2020 Oct 14. J Virol. 2020. PMID: 32817214 Free PMC article.
-
Assessing the impact of autologous virus neutralizing antibodies on viral rebound time in postnatally SHIV-infected ART-treated infant rhesus macaques.Epidemics. 2024 Sep;48:100780. doi: 10.1016/j.epidem.2024.100780. Epub 2024 Jun 27. Epidemics. 2024. PMID: 38964130 Free PMC article.
-
Simian-Human Immunodeficiency Virus SHIV.C.CH505 Persistence in ART-Suppressed Infant Macaques Is Characterized by Elevated SHIV RNA in the Gut and a High Abundance of Intact SHIV DNA in Naive CD4+ T Cells.J Virol. 2020 Dec 22;95(2):e01669-20. doi: 10.1128/JVI.01669-20. Print 2020 Dec 22. J Virol. 2020. PMID: 33087463 Free PMC article.
-
Brain macrophages harbor latent, infectious simian immunodeficiency virus.AIDS. 2019 Dec 1;33 Suppl 2(Suppl 2):S181-S188. doi: 10.1097/QAD.0000000000002269. AIDS. 2019. PMID: 31789817 Free PMC article. Review.
-
Viral and Host Biomarkers of HIV Remission Post Treatment Interruption.Curr HIV/AIDS Rep. 2022 Jun;19(3):217-233. doi: 10.1007/s11904-022-00607-z. Epub 2022 Apr 19. Curr HIV/AIDS Rep. 2022. PMID: 35438384 Review.
Cited by
-
Leveraging antigenic seniority for maternal vaccination to prevent mother-to-child transmission of HIV-1.NPJ Vaccines. 2022 Jul 30;7(1):87. doi: 10.1038/s41541-022-00505-w. NPJ Vaccines. 2022. PMID: 35907918 Free PMC article.
-
Therapeutic vaccination of SIV-infected, ART-treated infant rhesus macaques using Ad48/MVA in combination with TLR-7 stimulation.PLoS Pathog. 2020 Oct 26;16(10):e1008954. doi: 10.1371/journal.ppat.1008954. eCollection 2020 Oct. PLoS Pathog. 2020. PMID: 33104758 Free PMC article.
-
More than the Infinite Monkey Theorem: NHP Models in the Development of a Pediatric HIV Cure.Curr HIV/AIDS Rep. 2024 Feb;21(1):11-29. doi: 10.1007/s11904-023-00686-6. Epub 2024 Jan 16. Curr HIV/AIDS Rep. 2024. PMID: 38227162 Free PMC article. Review.
-
Understanding Viral and Immune Interplay During Vertical Transmission of HIV: Implications for Cure.Front Immunol. 2021 Oct 21;12:757400. doi: 10.3389/fimmu.2021.757400. eCollection 2021. Front Immunol. 2021. PMID: 34745130 Free PMC article. Review.
-
A novel HIV triple broadly neutralizing antibody (bNAb) combination-based passive immunization of infant rhesus macaques achieves durable protective plasma neutralization levels and mediates anti-viral effector functions.PLoS One. 2024 Nov 11;19(11):e0312411. doi: 10.1371/journal.pone.0312411. eCollection 2024. PLoS One. 2024. PMID: 39527587 Free PMC article.
References
-
- UNAIDS. 2018. Global HIV & AIDS statistics—2018 fact sheet 2018. http://www.unaids.org/en/resources/fact-sheet.
-
- UNAIDS. 2015. Access to antiretroviral therapy in Africa—status report on progress towards the 2015 targets. http://www.unaids.org/sites/default/files/media_asset/20131219_AccessART....
-
- Viani RM, Peralta L, Aldrovandi G, Kapogiannis BG, Mitchell R, Spector SA, Lie YS, Weidler JM, Bates MP, Liu N, Wilson CM, Adolescent Medicine Trials Network for HIV/AIDS Interventions. 2006. Prevalence of primary HIV-1 drug resistance among recently infected adolescents: a multicenter adolescent medicine trials network for HIV/AIDS interventions study. J Infect Dis 194:1505–1509. doi:10.1086/508749. - DOI - PubMed
Publication types
MeSH terms
Substances
Grants and funding
- UM1 AI126620/AI/NIAID NIH HHS/United States
- P30 AI050409/AI/NIAID NIH HHS/United States
- UM1 AI100645/AI/NIAID NIH HHS/United States
- P51 OD011132/OD/NIH HHS/United States
- UM1 AI126619/AI/NIAID NIH HHS/United States
- P51 OD011107/OD/NIH HHS/United States
- T32 CA009111/CA/NCI NIH HHS/United States
- P01 AI131251/AI/NIAID NIH HHS/United States
- R01 AI118549/AI/NIAID NIH HHS/United States
- P01 AI117915/AI/NIAID NIH HHS/United States
- R01 AI106380/AI/NIAID NIH HHS/United States
- P30 AI064518/AI/NIAID NIH HHS/United States
- P30 AI045008/AI/NIAID NIH HHS/United States
- R01 DE025444/DE/NIDCR NIH HHS/United States
- R01 AI131331/AI/NIAID NIH HHS/United States
- K01 OD024877/OD/NIH HHS/United States
- P01 AI131276/AI/NIAID NIH HHS/United States
- P30 AI050410/AI/NIAID NIH HHS/United States
LinkOut - more resources
Full Text Sources
Other Literature Sources
