. 2019 Oct 25;294(43):15795-15807.
doi: 10.1074/jbc.RA119.010666. Epub 2019 Sep 5.

Interaction of the tetratricopeptide repeat domain of aryl hydrocarbon receptor-interacting protein-like 1 with the regulatory Pγ subunit of phosphodiesterase 6

Affiliations

Interaction of the tetratricopeptide repeat domain of aryl hydrocarbon receptor-interacting protein-like 1 with the regulatory Pγ subunit of phosphodiesterase 6

Ravi P Yadav et al. J Biol Chem. .

Abstract

Phosphodiesterase-6 (PDE6) is key to both phototransduction and health of rods and cones. Proper folding of PDE6 relies on the chaperone activity of aryl hydrocarbon receptor-interacting protein-like 1 (AIPL1), and mutations in both PDE6 and AIPL1 can cause a severe form of blindness. Although AIPL1 and PDE6 are known to interact via the FK506-binding protein domain of AIPL1, the contribution of the tetratricopeptide repeat (TPR) domain of AIPL1 to its chaperone function is poorly understood. Here, we demonstrate that AIPL1-TPR interacts specifically with the regulatory Pγ subunit of PDE6. Use of NMR chemical shift perturbation (CSP) mapping technique revealed the interface between the C-terminal portion of Pγ and AIPL1-TPR. Our solution of the crystal structure of the AIPL1-TPR domain provided additional information, which together with the CSP data enabled us to generate a model of this interface. Biochemical analysis of chimeric AIPL1-AIP proteins supported this model and also revealed a correlation between the affinity of AIPL1-TPR for Pγ and the ability of Pγ to potentiate the chaperone activity of AIPL1. Based on these results, we present a model of the larger AIPL1-PDE6 complex. This supports the importance of simultaneous interactions of AIPL1-FK506-binding protein with the prenyl moieties of PDE6 and AIPL1-TPR with the Pγ subunit during the folding and/or assembly of PDE6. This study sheds new light on the versatility of TPR domains in protein folding by describing a novel TPR-protein binding partner, Pγ, and revealing that this subunit imparts AIPL1 selectivity for its client.

Keywords: HSP90; X-ray crystallography; chaperone; nuclear magnetic resonance (NMR); phosphodiesterases; photoreceptor; phototransduction; small-angle X-ray scattering (SAXS); tetratricopeptide repeat domain.


Conflict of interest statement

The authors declare that they have no conflicts of interest with the contents of this article

Figures
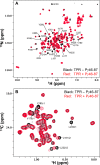
Figure 1.
Figure 1.
NMR spectra of human uniformly 15N- and 13C-methyl (IVL)–labeled AIPL1 TPR domain acquired in the presence and absence of Pγ46–87. A, overlay of 15N/1H HSQC spectra. B, overlay of 13C/1H HSQC spectra. The significantly perturbed backbone amide and methyl peaks upon Pγ peptide binding are labeled using the WT protein sequence numbering. In these experiments, the TPR and Pγ peptide concentrations used were 157 and 166 μm, respectively.
Figure 2.
Figure 2.
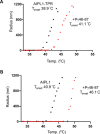
Thermal denaturation, as determined by DLS, for 165 μm AIPL1–TPR (A) and for 135 μm AIPL1(1–316) (B) in the absence (squares) or presence of 330 μm of Pγ46–87 (circles). Representative experiments are shown. For experiments performed in triplicate, Tm-onset (°C) values are: AIPL1–TPR, 39.0 ± 0.4; AIPL1–TPR + Pγ46–87, 41.7 ± 0.3; AIPL1(1–316), 41.0 ± 0.3; and AIPL1(1–316) + Pγ46–87, 45.4 ± 0.2 (means ± S.E.). Temp., temperature.
Figure 3.
Figure 3.
A, kinetics of association and dissociation for AIPL1–TPR and biotinylated Pγ46–87 coupled to a streptavidin biosensor as determined using BLI. Representative curves are shown. The processed data curves are black, and the nonlinear regression fits from the 1:1 binding model are red (association; kon = 0.8 ± 0.1 × 10⁵ m−1 s−1) and blue (dissociation; kd = 0.38 ± 0.02 s−1) (means ± S.E.). B, the steady-state binding curve obtained from data in A; KD = 3.0 μm. For n = 5 experiments, KD = 4.1 ± 1.4 μm (means ± S.E.). C, kinetics of association and dissociation for AIPL1–TPR and biotinylated Pγ63–87 coupled to a streptavidin biosensor as determined using BLI. Representative curves are shown (black). The nonlinear regression fits from the 1:1 binding model are red (association; kon = 1.6 ± 0.1 × 10⁵ m−1 s−1) and blue (dissociation; kd = 0.49 ± 0.02 s−1) (means ± S.E.). D, the steady-state binding curve obtained from data in C; KD = 4.6 μm. For n = 6 experiments, KD = 5.0 ± 0.6 μm (means ± S.E.).
Figure 4.
Figure 4.
NMR spectra of human uniformly 15N- and 13C-methyl (IVL)–labeled AIPL1 TPR domain acquired in the presence and absence of Pγ63–87. A, overlay of 15N/1H HSQC spectra. B, overlay of 13C/1H HSQC spectra. The significantly perturbed backbone amide and methyl peaks upon Pγ peptide binding are labeled using the WT protein sequence numbering. In these experiments, the used TPR and Pγ peptide concentrations were 157 and 163 μm, respectively.
Figure 5.
Figure 5.
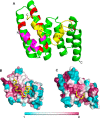
A, crystal structure of the human AIPL1 TPR domain. Residues AIPL1(180–314) are resolved in electron density. TPR repeats I (helices α1 and α2), II (helices α3 and α4), and III (helices α5 and α6) are shown in red, yellow, and blue, respectively. B, overlay of the structures of AIPL1–TPR (green) and AIP–TPR (orange) complexed with the HSP90 C terminus, SRMEEVD (magenta) (PDB code 4AIF). C and D, electrostatic surface representations (units KbT/ec) of AIPL1–TPR (C) and AIP–TPR (D). The color scale shows electrostatic potential: red indicates negative, and blue indicates positive.
Figure 6.
Figure 6.
A, structural model of the human AIPL1 TPR domain in complex with Pγ63–87. The Pγ63–87 peptide was docked into the crystal structure (aa 180–314) of human AIPL1 TPR domain using the NMR restraints obtained from the analysis of Pγ peptide binding to the protein. The Pγ α1 and α2 secondary helix structures were derived from the PDB structure (PDB code 1FQJ). The Pγ peptide is shown in yellow. The red and magenta ribbons indicate the TPR residues that were significantly perturbed (with Δδppm ≥ 0.053 ppm) and most severely perturbed (with Δδppm ≥ 0.10 ppm) by the binding of the Pγ peptide, respectively. B and C, surface representations for AIPL1–TPR (B) and AIP–TPR (C) colored by residue conservations scores derived from ConSurf analysis of a sample of 87 AIPL1–TPR orthologs (B) and 89 AIP–TPR orthologs (C). The sequences for the analysis with maximal identity of 97% and minimal identity of 60% were collected from the UniProt database. The color scale is as follows: 9, magenta, conserved; and 1, cyan, variable. Pγ63–87 (B) and the C terminus of HSP90 (C) are shown as yellow tubes.
Figure 7.
Figure 7.
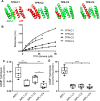
A, cartoon representations of AIPL1–AIP TPR chimeras. B, steady-state binding curves for AIPL1–TPR chimeras and biotinylated Pγ63–87 coupled to a streptavidin biosensor as determined using BLI. For the shown representative curves, the Kdm) values are: TPR-C1, 28; TPR-C2, 118; TPR-C3, 104; and TPR-C4, 41. For experiments performed in triplicate, the Kdm) values are: TPR-C1, 33 ± 3; TPR-C2, 110 ± 20; TPR-C3, 125 ± 15; and TPR-C4, 43 ± 1 (means ± S.E.). C, cGMP hydrolysis in extracts of HEK293T cells co-transfected with PDE6C, AIPL1 or AIPL1–AIP chimeras. D, cGMP hydrolysis in extracts of HEK293T cells transfected as in C except with addition of the Pγ vector (untransfected control is subtracted). Because Pγ is the inhibitory subunit of PDE6, the samples with co-expression of Pγ were treated with trypsin to selectively remove Pγ before conducting the assay. The data were analyzed by one-way analysis of variance with Tukey's multiple comparisons follow-up test. Whiskers represent minimum and maximum. Boxes represent interquartile range. The line represents the median, and dots represent data points. The average PDE activity values (nmol min−1 mg−1) in C and D are: AIPL1, 0.10 ± 0.01 and 10.5 ± 0.8; AIPL1-C1, 0.04 ± 0.01 and 2.7 ± 0.3; AIPL1-C3, 0.06 ± 0.01 and 2.4 ± 0.4; and AIPL1-C4, 0.03 ± 0.01 and 2.1 ± 0.3 (means ± S.E., n ≥ 5).
Figure 8.
Figure 8.
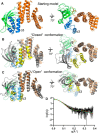
A, a starting model of AIPL1(1–316) generated using the structures of AIPL1–FKBP and AIPL1–TPR using Modeler. The FKBP domain of AIPL1 and its insert region are rendered in green and blue, respectively. The TPR domain is shown in orange. B, a representative closed conformation of AIPL1(1–316) from MD6 trajectory is shown in gray with the insert region shown in yellow. Superimposed is the starting model shown in transparent colors as in A. TPR α1–α3 were used in superimposition. C, a representative open conformation of AIPL1(1–316) from MD5 trajectory is shown as in B. D, experimental SAXS data for AIPL1(1–316) (black curve). The theoretical SAXS profiles calculated for models in A (red curve), B (green dashed curve), and C (blue dashed curve) fit the data with χ2 values of 1.67, 1.27, and 1.25, respectively.
Figure 9.
Figure 9.
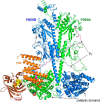
Model of the AIPL1–PDE6 complex. The model was generated by superimposing a representative open conformation of AIPL1(1–316) from MD15 simulation of the AIPL1–Pγ63–87 complex onto the structure of rod PDE6 (PDB code 6MZB). The PDE6A and PDE6B catalytic subunits are shown in green and blue, respectively. The Pγ subunits are shown in magenta and gray. The AIPL1 FKBP and TPR domains are rendered in brown and orange, respectively. The farnesyl moiety is shown as yellow spheres, and the C-terminal residue present in PDE6 structure is shown as spheres colored by atom type. For clarity, the complex is shown only for the PDEA subunit.

References

    1. Arshavsky V. Y., and Burns M. E. (2014) Current understanding of signal amplification in phototransduction. Cell. Logist. 4, e29390 10.4161/cl.29390 - DOI - PMC - PubMed
    1. Cote R. H. (2004) Characteristics of photoreceptor PDE (PDE6): similarities and differences to PDE5. Int. J. Impot. Res. 16, S28–S33 10.1038/sj.ijir.3901212 - DOI - PubMed
    1. Farber D. B., and Lolley R. N. (1974) Cyclic guanosine monophosphate: elevation in degenerating photoreceptor cells of the C3H mouse retina. Science 186, 449–451 10.1126/science.186.4162.449 - DOI - PubMed
    1. Bowes C., Li T., Danciger M., Baxter L. C., Applebury M. L., and Farber D. B. (1990) Retinal degeneration in the rd mouse is caused by a defect in the β subunit of rod cGMP-phosphodiesterase. Nature 347, 677–680 10.1038/347677a0 - DOI - PubMed
    1. Pittler S. J., and Baehr W. (1991) Identification of a nonsense mutation in the rod photoreceptor cGMP phosphodiesterase β-subunit gene of the rd mouse. Proc. Natl. Acad. Sci. U.S.A. 88, 8322–8326 10.1073/pnas.88.19.8322 - DOI - PMC - PubMed

Publication types

Substances