. 2019 Sep 30;146(19):dev178590.
doi: 10.1242/dev.178590.

Maintenance of spatial gene expression by Polycomb-mediated repression after formation of a vertebrate body plan

Affiliations

Maintenance of spatial gene expression by Polycomb-mediated repression after formation of a vertebrate body plan

Julien Rougeot et al. Development. .

Abstract

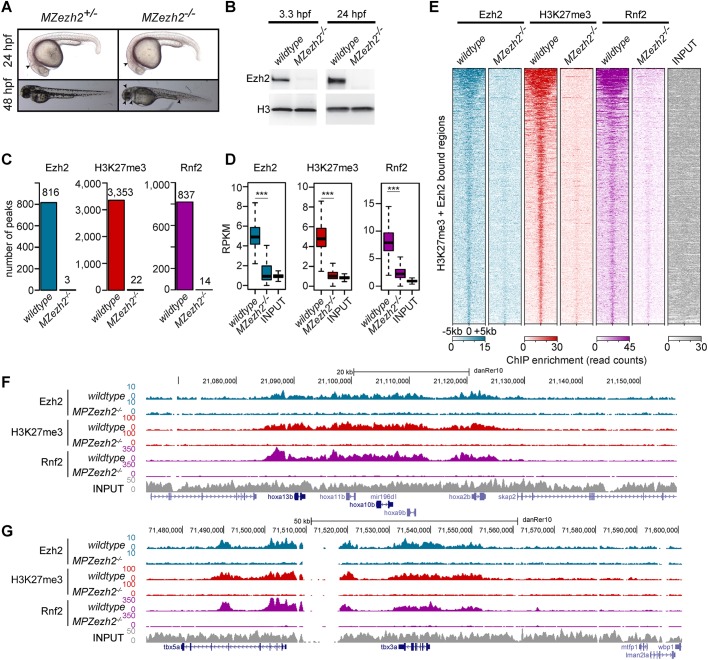
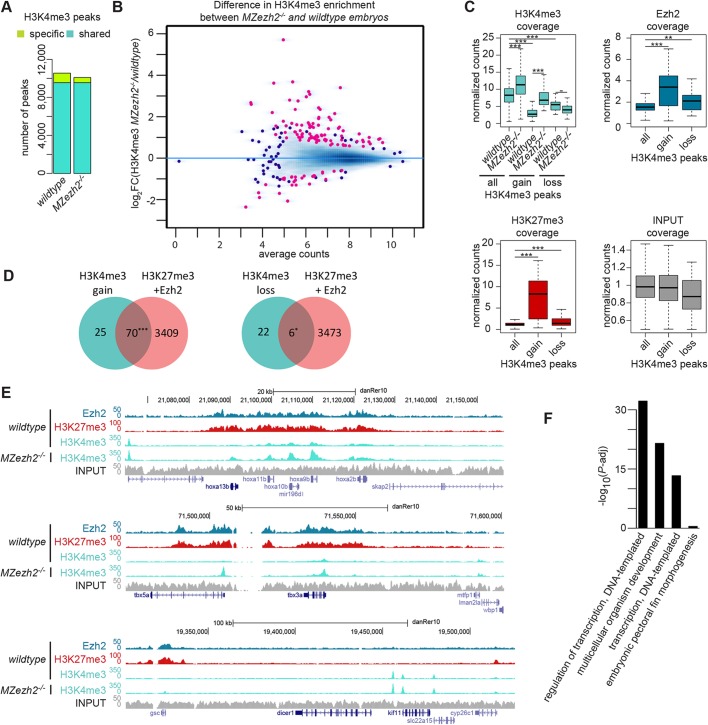
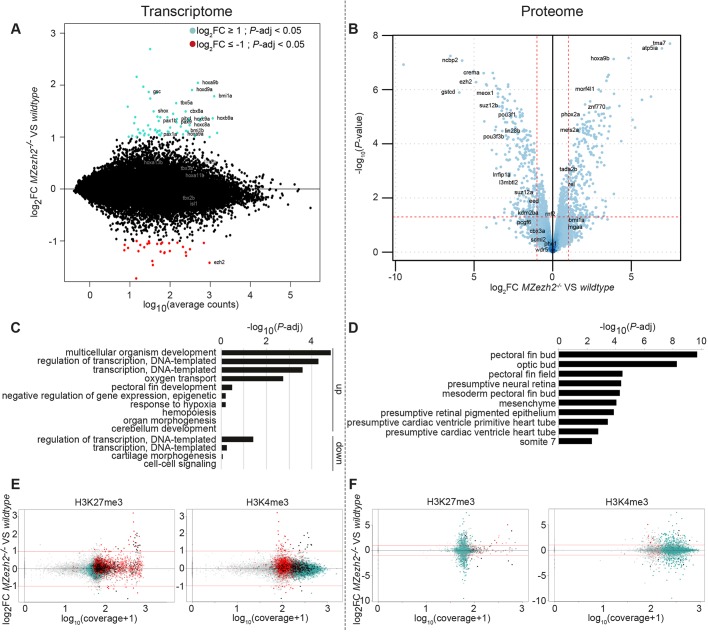
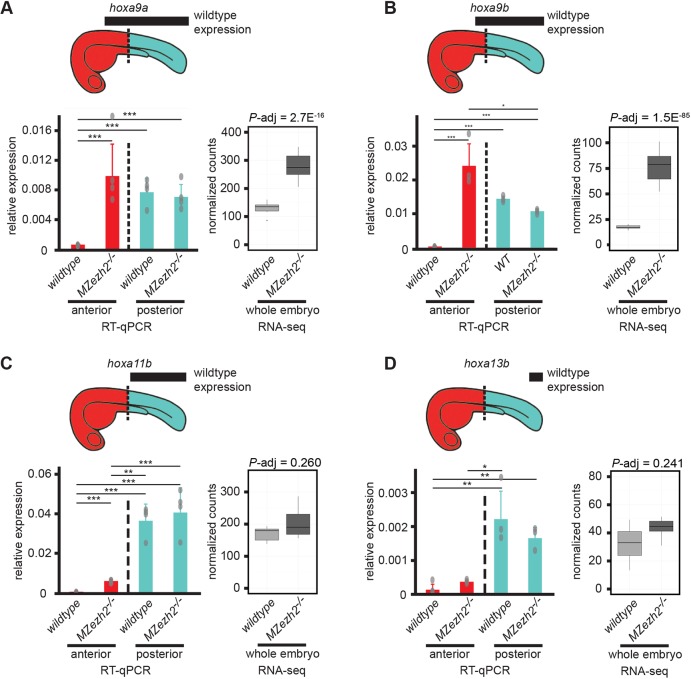
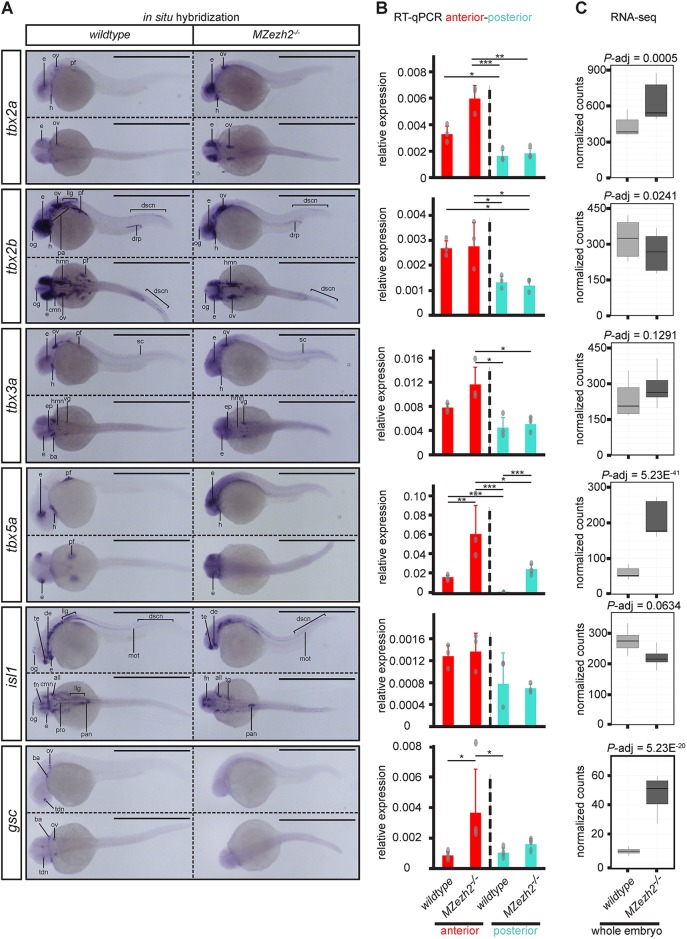
Polycomb group (PcG) proteins are transcriptional repressors that are important regulators of cell fate during embryonic development. Among them, Ezh2 is responsible for catalyzing the epigenetic repressive mark H3K27me3 and is essential for animal development. The ability of zebrafish embryos lacking both maternal and zygotic ezh2 to form a normal body plan provides a unique model for comprehensively studying Ezh2 function during early development in vertebrates. By using a multi-omics approach, we found that Ezh2 is required for the deposition of H3K27me3 and is essential for proper recruitment of Polycomb group protein Rnf2. However, despite the complete absence of PcG-associated epigenetic mark and proteins, only minor changes in H3K4me3 deposition and gene and protein expression occur. These changes were mainly due to local dysregulation of transcription factors outside their normal expression boundaries. Altogether, our results in zebrafish show that Polycomb-mediated gene repression is important immediately after the body plan is formed to maintain spatially restricted expression profiles of transcription factors, and we highlight the differences that exist in the timing of PcG protein action between vertebrate species.

Keywords: ChIP-seq; Ezh2; Polycomb; Proteomics; Transcriptomics; Zebrafish.


Conflict of interest statement

Competing interestsThe authors declare no competing or financial interests.

Figures

Fig. 1.
Fig. 1.
MZezh2 mutant (MZezh2−/−) embryos lack Ezh2, H3K27me3 and Rnf2 binding to the chromatin. (A) MZezh2+/− (developing as wild-type embryos) and MZezh2−/− embryos at 24 and 48 hpf. At 24 hpf, MZezh2−/− embryos lack a clear mid-hindbrain boundary compared with heterozygous embryos (arrowhead). At 48 hpf, MZezh2−/− embryos showed pleiotropic phenotypes compared with heterozygous embryos, such as small eyes, small brain, heart edema and blood accumulation in the blood island (arrowheads). (B) Western blot analysis of Ezh2 at 3.3 hpf and 24 hpf of wild-type and MZezh2−/− embryos. Histone H3 was used as a loading control. Results presented are representative of three biological replicates. (C) Number of peaks called after Ezh2, H3K27me3 and Rnf2 ChIP-seq of wild-type and MZezh2−/− embryos at 24 hpf. Each peak set was obtained by the intersection of two independent biological replicates. (D) Box plots of Ezh2, H3K27me3 and Rnf2 RPKM-normalized coverage after respective ChIP-seq in wild-type and in MZezh2−/− embryos at 24 hpf. The input control was obtained from wild-type embryos at 24 hpf. Coverages were calculated based on peaks detected in wild-type embryos. ***P<0.001 (t-test). The box represents the first quartile, median and third quartile. The whiskers below and above the box represent the minimum and maximum values. (E) Heatmaps for Ezh2, H3K27me3 and Rnf2 subsampled counts after ChIP-seq in 24 hpf wild-type and MZezh2−/− embryos. Heatmaps are ordered based on coverage intensity in Ezh2 and H3K23me3 ChIP-seq performed in wild types. Windows of 10 kb regions for all H3K27me3 or Ezh2 peaks in 24 hpf wild-type embryos are shown. The input track obtained from 24 hpf wild-type embryos was used as control and was not subsampled. (F,G) UCSC genome browser snapshot depicting the loss of Ezh2, H3K27me3 and Rnf2 after ChIP-seq in 24 hpf MZezh2−/− embryos compared with wild-type embryos for (F) the hoxab gene cluster and (G) the tbx5a gene. Colors represent ChIP-seq for different proteins: blue, Ezh2; red, H3K27me3; purple, Rnf2; gray, input control.
Fig. 2.
Fig. 2.
MZezh2 mutant (MZezh2−/−) embryos show an increase in H3K4me3 preferentially on H3K27me3 targets. (A) Number of peaks called after H3K4me3 ChIP-seq in wild-type and MZezh2 mutant (MZezh2−/−) embryos at 24 hpf. Turquoise and green represent peaks shared by the two conditions and peaks specific for one condition, respectively. Each peak set was obtained by the intersection of three independent biological replicates. (B) MA plot showing the fold change (log2-transformed) in H3K4me3 peak coverages in 24 hpf MZezh2−/− and wild-type embryos as a function of the normalized average count between the two conditions (log10-transformed) as calculated using DiffBind on the union of H3K4me3 peaks detected in both wild-type and MZezh2 mutant conditions. Red, log2FC≥1 or ≤−1 and P-adj<0.05; blue, P-adj≥0.05. When dot concentration is too high, dots are replaced by density for better visualization. (C) Box plots of subsampled counts after ChIP-seq for H3K4me3 in wild-type and MZezh2−/− embryos and for Ezh2 and H3K27me3 in wild-type embryos at 24 hpf. Box plots display union of all H3K4me3 peaks detected in MZezh2−/− or wild-type embryos (all) and H3K4me3 peaks enriched (gain) or decreased (loss) in MZezh2−/− embryos compared with wild type as detected by DiffBind. Coverages are average of normalized counts between the triplicates for H3K4me3 and duplicates for Ezh2 and H3K27me3. The input track obtained from 24 hpf wild-type embryos was used as a control. ***P<0.001, **P<0.01 (one-way ANOVA with post-hoc tests). The box represents the first quartile, median and third quartile. The whiskers below and above the box represent the minimum and maximum values. (D) Venn diagrams presenting the overlap between peaks with increased or decreased H3K4me3 levels (gain or loss), as detected by DiffBind with the presence of Ezh2 or H3K27me3 peaks within a ±1 kb window. ***P<0.001, *P<0.05 (χ2 test). (E) UCSC browser snapshots of three genomic loci in wild-type and MZezh2−/− embryos at 24 hpf. In C and E, blue, red, turquoise and gray represent ChIP-seq for Ezh2, H3K27me3, H3K4me3 and input control, respectively. (F) Gene ontology analysis of the closest genes restricted to two regions 2 kb upstream or downstream from H3K4me3 peaks enriched in MZezh2−/−.
Fig. 3.
Fig. 3.
Loss of maternal zygotic ezh2 results in overexpression of specific developmental genes. (A) MA plot showing the fold change (log2-transformed) between gene expression in 24 hpf MZezh2 mutant (MZezh2−/−) and wild-type embryos as a function of the normalized average count between the two conditions (log10-transformed), as calculated with DEseq2. Log2FC≥1 and P-adj<0.05, turquoise; log2FC≤−1 and P-adj<0.05, red. For wild-type and MZezh2−/− embryos, six and seven biological replicates were used, respectively. (B) Volcano plot showing the P-value (-log10-transformed) as a function of the fold-change (log2-transformed) between protein expression level in MZezh2−/− compared with wild-type embryos at 24 hpf. Data were obtained from biological triplicates for each condition. (C) Gene ontology of biological processes associated with genes upregulated (up) or downregulated (down) in MZezh2−/− embryos compared with wild-type embryos at 24 hpf. (D) Analysis of anatomical terms associated with proteins upregulated and downregulated in MZezh2−/− embryos compared with wild-type embryos at 24 hpf. (E,F) Dot plots showing the fold change (log2-transformed) between gene expression in 24 hpf MZezh2−/− and wild-type embryos detected by RNA-seq (E) or proteome analysis (F) as a function of the H3K27me3 (left panel) or H3K4me3 (right panel) coverage [log10(coverage+1) transformed]. Red, turquoise, black and gray dots represent genes associated with MACS2-detected peaks for H3K27me3, H3K4me3, both marks or none, respectively.
Fig. 4.
Fig. 4.
Loss of maternal and zygotic ezh2 results in ectopic expression of Hox genes. (A-D) Expression analysis of (A) hoxa9a, (B) hoxa9b, (C) hoxa11b and (D) hoxa13b at 24 hpf. Bar plots on the left side of each panel represent relative expression of indicated Hox genes in the anterior half (red) and posterior half (turquoise) of wild-type and MZezh2 mutant (MZezh2−/−) embryos. Boxplots represent normalized counts from RNA-seq experiments in MZezh2−/− and wild-type whole embryo lysates at 24 hpf. Above is a schematic representation of 1 dpf embryos. Black boxes represent the expression domains of the Hox genes in wild-type embryos based on published data (Thisse, 2004). Dashed lines represent the demarcation between anterior (red) and posterior (turquoise) parts of the embryo used for RT-qPCR analysis. Each experiment was performed at least in triplicate for 20 pooled anterior or posterior larval halves. For RT-qPCR, relative expression was calculated based on expression of the housekeeping gene actb1. Data are mean±s.e.m. and overlaid dot plots represent individual RT-qPCR samples. Relative expression was compared between anterior or posterior parts in MZezh2−/− and wild-type embryos (one-way ANOVA with post-hoc tests, ***P<0.001, **P<0.01, *P<0.05). For RNA-seq, adjusted P-values were extracted from differential expression analysis with DEseq2. The box represents the first quartile, median and third quartile. The whiskers below and above the box represent the minimum and maximum values.
Fig. 5.
Fig. 5.
Transcription factor expression is spatially dysregulated in MZezh2 mutant (MZezh2−/−) embryos. (A-C) Spatial expression analysis by (A) in situ hybridization, (B) RT-qPCR on anterior half and posterior half, and (C) RNA-seq results of transcription factors tbx2a, tbx2b, tbx3a, tbx5a, isl1 and gsc in 24 hpf embryos. Scale bars: 1 mm. Experiments were performed in biological duplicates of a least 15 pooled embryos for in situ hybridization and in triplicates or quadruplicates of 20 pooled larval halves for RT-qPCR. Relative expression was calculated based on expression of the housekeeping gene actb1. Data are mean±s.e.m. in B with dots representing individual RT-qPCR samples. Relative expression was compared between anterior (red) or posterior (turquoise) parts in MZezh2−/− and wild-type embryos (one-way ANOVA with post-hoc tests, ***P<0.001, **P<0.01, *P<0.05). (C) Box plots represent normalized counts from RNA-seq experiments in whole MZezh2−/− and wild type after differential expression analysis with DEseq2. all, anterior lateral lane ganglion; ba, branchial arch; cmn, cranial motor neurons; de, diencephalon; drp, distal region of the pronephros; dscn, dorsal spinal cord neurons; e, eye; ep, epiphysis; fn, forebrain nuclei; h, heart; hmn, hindbrain motor neurons; llg, lateral lane ganglion; mot, primary motor neurons; og, olfactory ganglion; ov, otic vesicle; pa, pharyngeal arches; pan, pancreas; pf, pectoral fin; pro, pronephros; sc, spinal cord; tdn, telencephalon and diencephalon nuclei; te, telencephalon; vg, ventral ganglion. The box represents the first quartile, median and third quartile. The whiskers below and above the box represent the minimum and maximum values.

Similar articles

Cited by

References

    1. Brock H. W. and Fisher C. L. (2005). Maintenance of gene expression patterns. Dev. Dyn. 232, 633-655. 10.1002/dvdy.20298 - DOI - PubMed
    1. Chittock E. C., Latwiel S., Miller T. C. R. and Müller C. W. (2017). Molecular architecture of polycomb repressive complexes. Biochem. Soc. Trans. 45, 193-205. 10.1042/BST20160173 - DOI - PMC - PubMed
    1. Chrispijn N. D., Andralojc K. M., Castenmiller C. and Kamminga L. M. (2018). Gene expression profile of a selection of Polycomb Group genes during zebrafish embryonic and germ line development. PLoS ONE 13, e0200316 10.1371/journal.pone.0200316 - DOI - PMC - PubMed
    1. Chrispijn N. D., Elurbe D. M., Mickoleit M., Aben M., de Bakker D. E. M., Andralojc K. M., Huisken J., Bakkers J. and Kamminga L. M. (2019). Loss of the Polycomb group protein Rnf2 results in derepression of tbx-transcription factors and defects in embryonic and cardiac development. Sci. Rep. 9, 4327 10.1038/s41598-019-40867-1 - DOI - PMC - PubMed
    1. Ciruna B., Weidinger G., Knaut H., Thisse B., Thisse C., Raz E. and Schier A. F. (2002). Production of maternal-zygotic mutant zebrafish by germ-line replacement. Proc. Natl. Acad. Sci. USA 99, 14919-14924. 10.1073/pnas.222459999 - DOI - PMC - PubMed

Publication types

MeSH terms