. 2019 Oct;30(10):1953-1967.
doi: 10.1681/ASN.2018121259. Epub 2019 Sep 5.

Computational Segmentation and Classification of Diabetic Glomerulosclerosis

Affiliations

Computational Segmentation and Classification of Diabetic Glomerulosclerosis

Brandon Ginley et al. J Am Soc Nephrol. 2019 Oct.

Abstract

Background: Pathologists use visual classification of glomerular lesions to assess samples from patients with diabetic nephropathy (DN). The results may vary among pathologists. Digital algorithms may reduce this variability and provide more consistent image structure interpretation.

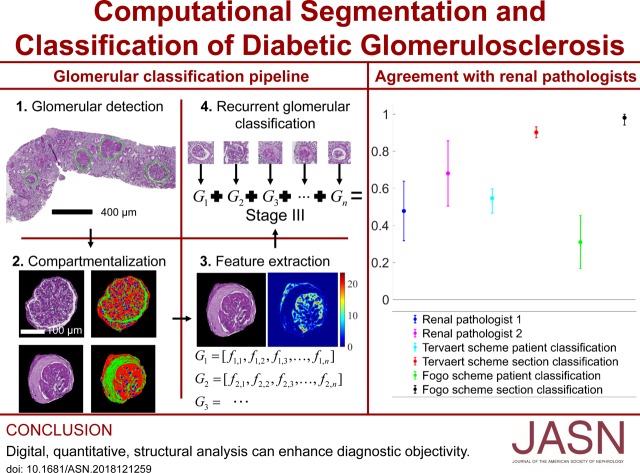
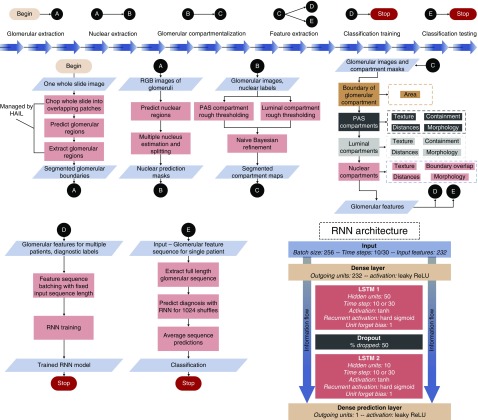
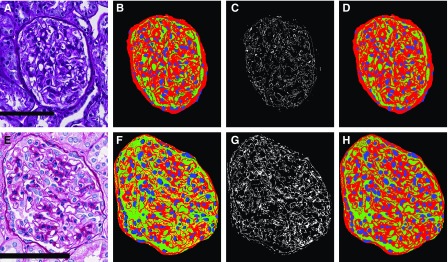
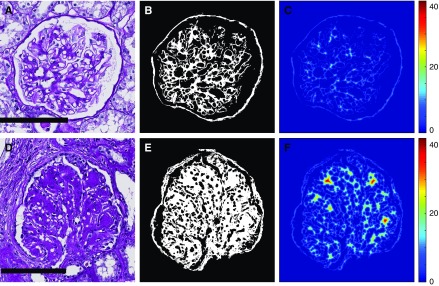
Methods: We developed a digital pipeline to classify renal biopsies from patients with DN. We combined traditional image analysis with modern machine learning to efficiently capture important structures, minimize manual effort and supervision, and enforce biologic prior information onto our model. To computationally quantify glomerular structure despite its complexity, we simplified it to three components consisting of nuclei, capillary lumina and Bowman spaces; and Periodic Acid-Schiff positive structures. We detected glomerular boundaries and nuclei from whole slide images using convolutional neural networks, and the remaining glomerular structures using an unsupervised technique developed expressly for this purpose. We defined a set of digital features which quantify the structural progression of DN, and a recurrent network architecture which processes these features into a classification.

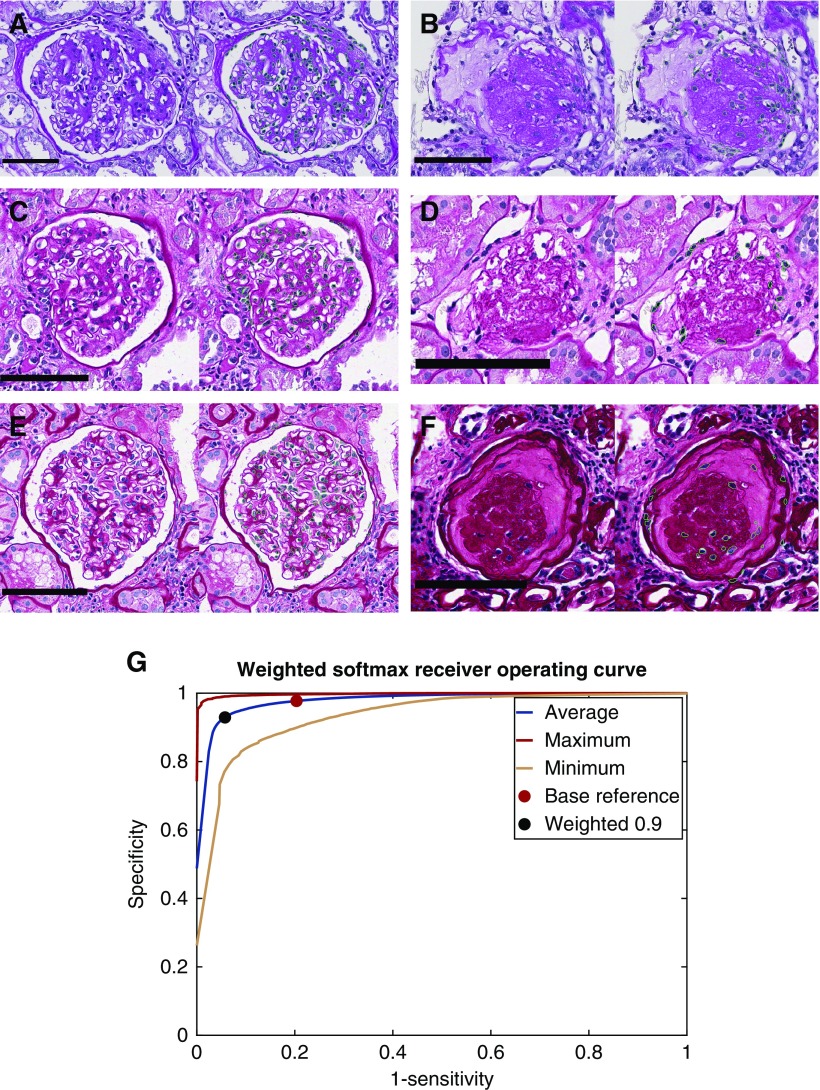
Results: Our digital classification agreed with a senior pathologist whose classifications were used as ground truth with moderate Cohen's kappa κ = 0.55 and 95% confidence interval [0.50, 0.60]. Two other renal pathologists agreed with the digital classification with κ1 = 0.68, 95% interval [0.50, 0.86] and κ2 = 0.48, 95% interval [0.32, 0.64]. Our results suggest computational approaches are comparable to human visual classification methods, and can offer improved precision in clinical decision workflows. We detected glomerular boundaries from whole slide images with 0.93±0.04 balanced accuracy, glomerular nuclei with 0.94 sensitivity and 0.93 specificity, and glomerular structural components with 0.95 sensitivity and 0.99 specificity.

Conclusions: Computationally derived, histologic image features hold significant diagnostic information that may augment clinical diagnostics.

Keywords: Computational renal pathology; Digital pathology; Image analysis; Tervaert's classification; diabetic nephropathy; glomerulus.


Figures

None
Graphical abstract
Figure 1.
Figure 1.
General overview of our computational pipeline and recurrent architecture. ReLU, rectified linear unit.
Figure 2.
Figure 2.
Accurate detection of glomerular boundaries from WSIs depicting PAS stained renal tissue. (A) Detection of glomeruli in human biopsy sample sourced and prepared in institute-2, with a purple appearance. (B) Detection of human glomeruli sourced from institute-2, prepared in a different institute than (A and C), with a pink appearance. Occasionally, two closely abutting glomeruli will be identified as one doublet object. (C) Detection of human glomeruli sourced from institute-2, prepared in a different institute than (A and B), with reddish-pink appearance. (D) Detection of glomeruli in mouse kidney sections. Scale bars, 400 µm.
Figure 3.
Figure 3.
Nuclear boundaries detected from varied, PAS stained glomerulus images with high accuracy. (A) Detection of nuclei from institute- 1 and preparation-1 in a glomerulus. Green boundaries in images indicate the perimeter of the detected nuclear region. (B) Detection of nuclei from institute-1, preparation-1, in a sclerotic glomerulus. (C and D) Detection of nuclei in glomeruli from institute-2, preparation-2, for a glomerulus and a sclerotic glomerulus. (E and F) Detection of nuclei in glomeruli from institute-2, preparation-3, for a glomerulus and a sclerotic glomerulus. (G) Receiver operating curve for the nuclear detection method calculated as the average, minimum, and maximum of a 22-image holdout set. Red dot indicates the network’s performance without any weighting on the network’s output. Black dot indicates the network’s performance when the network’s output is weighted toward the nuclear class with weight 0.9 (a weight of 1 would result in every pixel in the image detected as nuclear). Scale bars, 100 µm.
Figure 4.
Figure 4.
Glomerular components are detected consistently in images with varying presentation. (B) Glomerular component precursor mask. Red, PAS+ precursor mask; green, luminal precursor mask; blue, nuclear detections from DeepLab V2. (C) White pixels indicate regions from the glomerular component precursor mask which either have no detected label or are detected as both luminal and PAS+. (D) Naïve Bayesian classification correction of the glomerular component precursor mask, where every pixel has specifically one class label belonging to one of PAS+ (red), lumina (green), or nuclei (blue). (E–H) Identical computation as that shown in (A–D), but with a glomerulus from institute-2, preparation-3. Scale bars, 100 µm.
Figure 5.
Figure 5.
Intracompartmental distance features continuously quantitate mesangial thickening on PAS+ regions of DN glomeruli. (A) Example of glomerulus with mild mesangial thickening. (B) PAS+ precursor mask for glomerulus in image (A), used as an estimate for mesangial regions. (C) Distance transform of the image shown in (B), resulting in maximum value calculated at 18.4. (D) Example of glomerulus with extensive mesangial thickening, including Kimmelstiel–Wilson nodules. (E) PAS+ precursor mask for glomerulus in (D). (F) Distance transform of the image shown in (E), with maximum value calculated at 42. Compared with (C), it can be seen that this analysis yields higher values for thicker PAS+ structures, and lower values for thinner ones. Scale bars, 100 µm.

Comment in

  • Machine Learning Comes to Nephrology.
    Lemley KV. Lemley KV. J Am Soc Nephrol. 2019 Oct;30(10):1780-1781. doi: 10.1681/ASN.2019070664. Epub 2019 Sep 5. J Am Soc Nephrol. 2019. PMID: 31488608 Free PMC article. No abstract available.

References

    1. CDC : Diabetes report card. 2014. Available at: https://www.cdc.gov/diabetes/library/reports/congress.html
    1. Tervaert TW, Mooyaart AL, Amann K, Cohen AH, Cook HT, Drachenberg CB, et al. .: Renal Pathology Society : Pathologic classification of diabetic nephropathy. J Am Soc Nephrol 21: 556–563, 2010 - PubMed
    1. Chen LC, Papandreou G, Kokkinos I, Murphy K, Yuille AL: DeepLab: Semantic image segmentation with deep convolutional nets, atrous convolution, and fully connected CRFs. IEEE Trans Pattern Anal Mach Intell 40: 834–848, 2018 - PubMed
    1. Lutnick B, Ginley B, Govind D, McGarry SD, LaViolette PS, Yacoub R, et al. : An integrated iterative annotation technique for easing neural network training in medical image analysis. Nat Mach Intell 1: 112–119, 2019 - PMC - PubMed
    1. Otsu N: A threshold selection method from gray-level histograms. IEEE Trans Syst Man Cybern Syst 9: 62–66, 1976

Publication types

MeSH terms