. 2019 Oct;30(10):1968-1979.
doi: 10.1681/ASN.2019020144. Epub 2019 Sep 5.

Deep Learning-Based Histopathologic Assessment of Kidney Tissue

Affiliations

Deep Learning-Based Histopathologic Assessment of Kidney Tissue

Meyke Hermsen et al. J Am Soc Nephrol. 2019 Oct.

Abstract

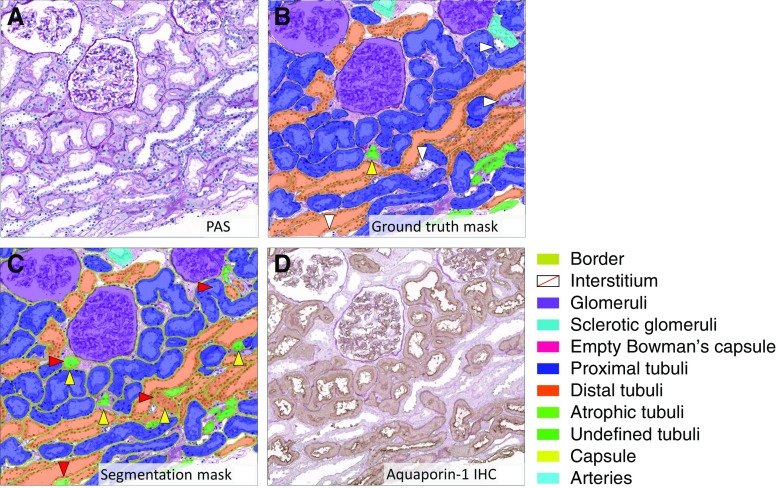
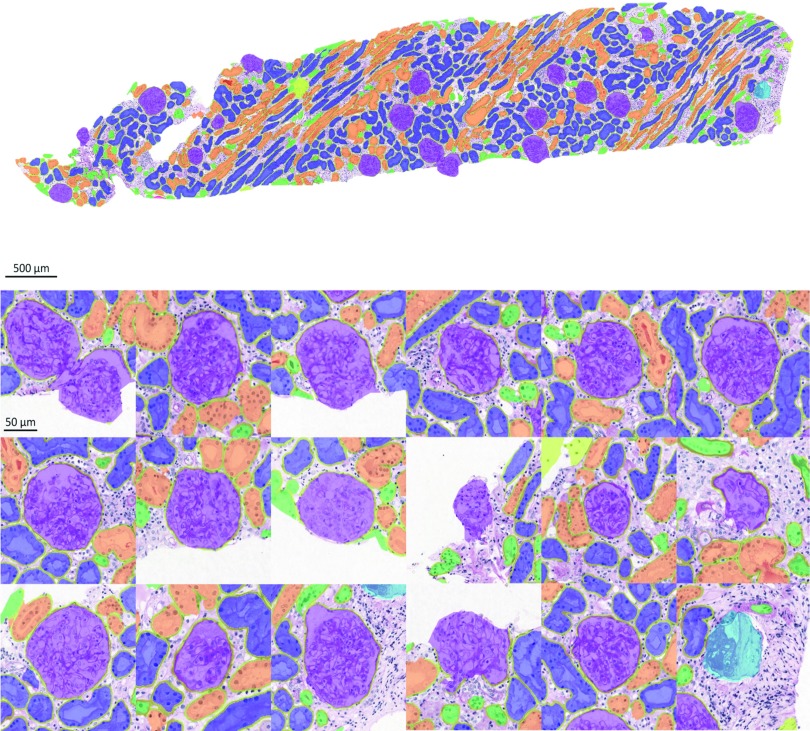
Background: The development of deep neural networks is facilitating more advanced digital analysis of histopathologic images. We trained a convolutional neural network for multiclass segmentation of digitized kidney tissue sections stained with periodic acid-Schiff (PAS).

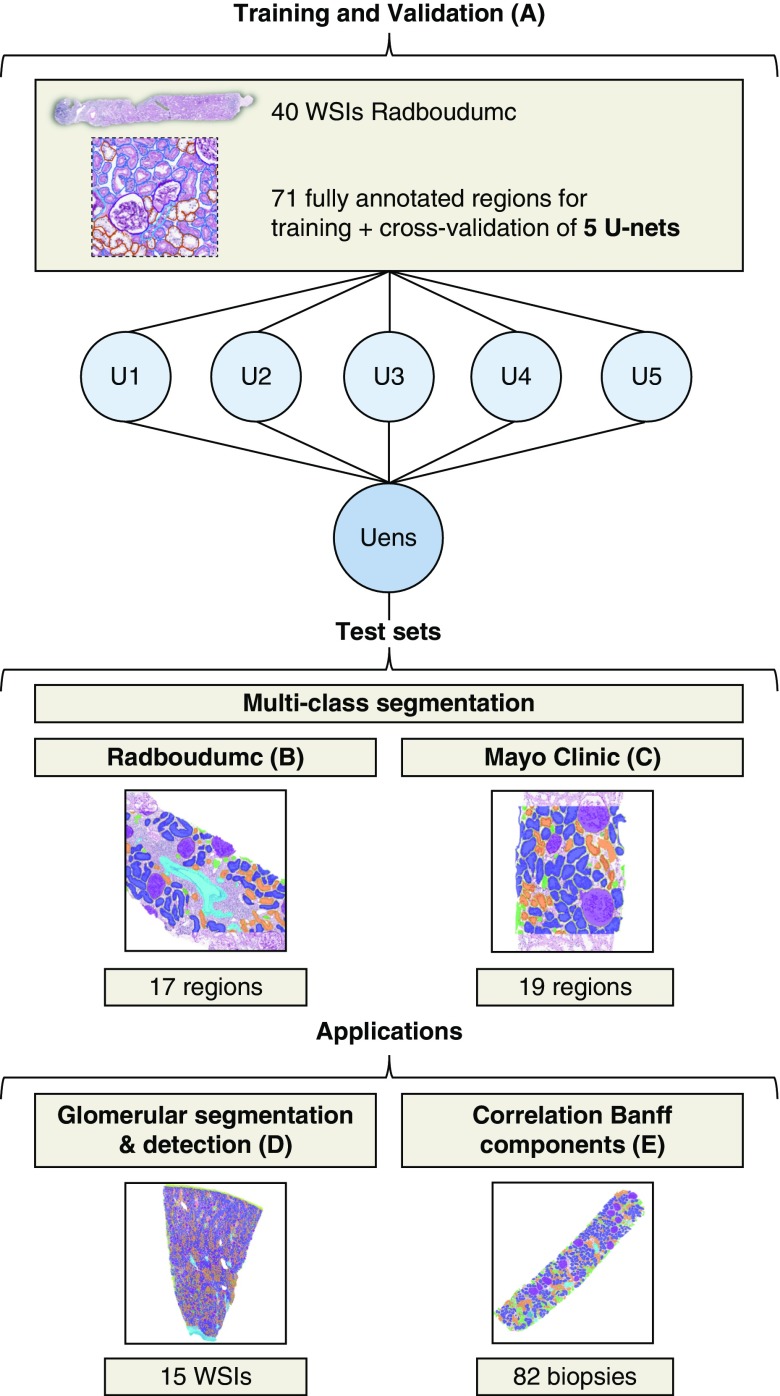
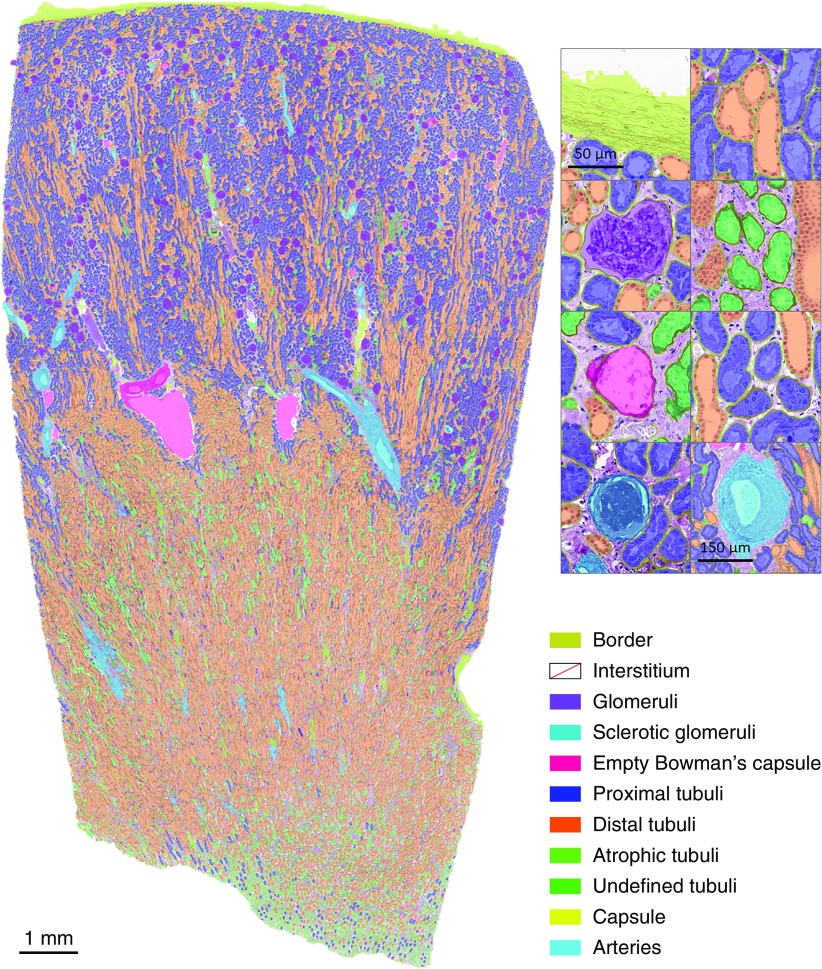
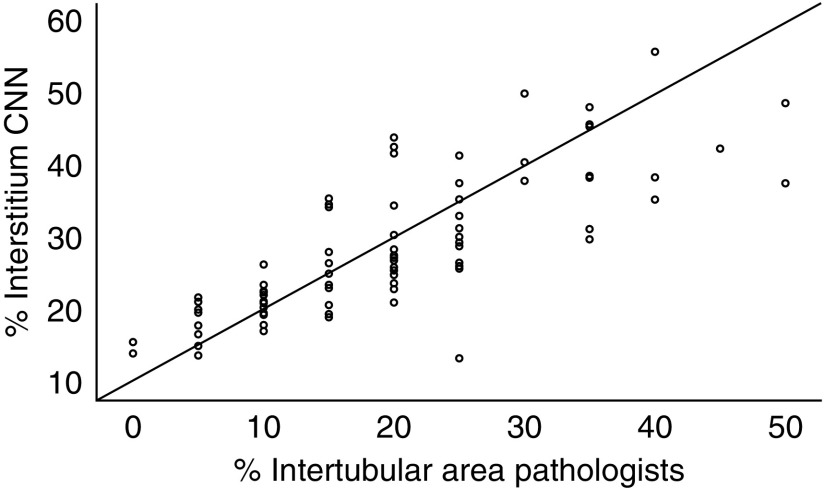
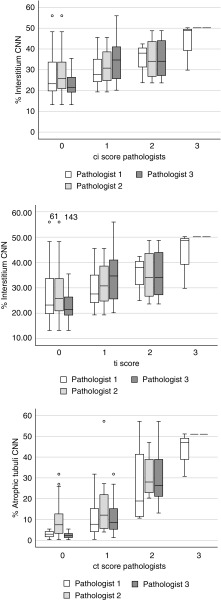
Methods: We trained the network using multiclass annotations from 40 whole-slide images of stained kidney transplant biopsies and applied it to four independent data sets. We assessed multiclass segmentation performance by calculating Dice coefficients for ten tissue classes on ten transplant biopsies from the Radboud University Medical Center in Nijmegen, The Netherlands, and on ten transplant biopsies from an external center for validation. We also fully segmented 15 nephrectomy samples and calculated the network's glomerular detection rates and compared network-based measures with visually scored histologic components (Banff classification) in 82 kidney transplant biopsies.

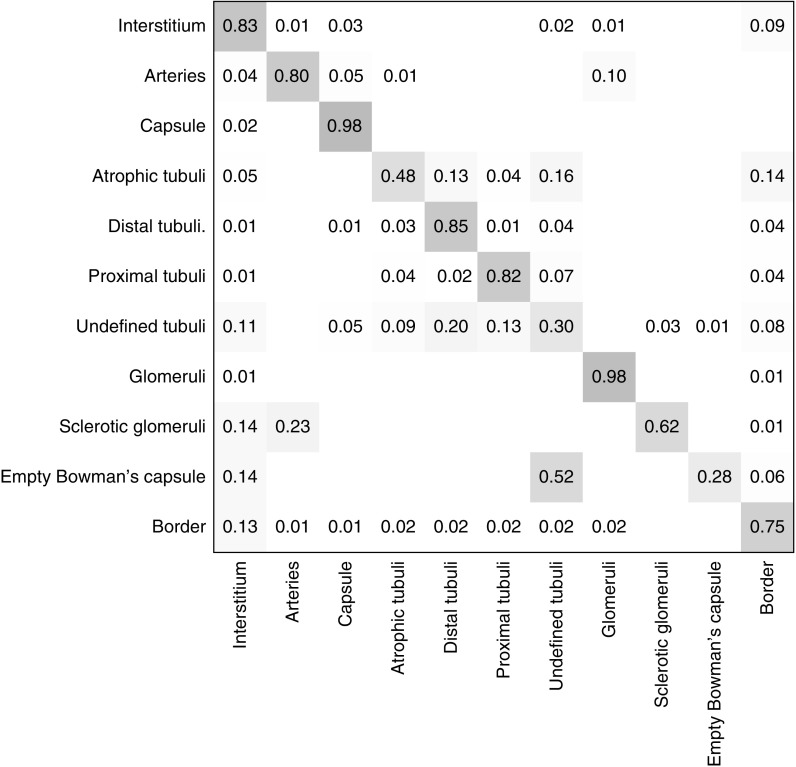
Results: The weighted mean Dice coefficients of all classes were 0.80 and 0.84 in ten kidney transplant biopsies from the Radboud center and the external center, respectively. The best segmented class was "glomeruli" in both data sets (Dice coefficients, 0.95 and 0.94, respectively), followed by "tubuli combined" and "interstitium." The network detected 92.7% of all glomeruli in nephrectomy samples, with 10.4% false positives. In whole transplant biopsies, the mean intraclass correlation coefficient for glomerular counting performed by pathologists versus the network was 0.94. We found significant correlations between visually scored histologic components and network-based measures.

Conclusions: This study presents the first convolutional neural network for multiclass segmentation of PAS-stained nephrectomy samples and transplant biopsies. Our network may have utility for quantitative studies involving kidney histopathology across centers and provide opportunities for deep learning applications in routine diagnostics.

Keywords: Banff classification; deep learning; histopathology; kidney transplantation.


Figures

None
Graphical abstract
Figure 1.
Figure 1.
A summarizing overview of the image sets used and their corresponding objectives. (A) Five U-nets were trained using kidney biopsies from Radboudumc and applied as an ensemble (Uens) on several data sets. The multiclass segmentation performance was assessed on (B) ten kidney transplant biopsies from Radboudumc, and (C) ten kidney transplant biopsies from Mayo Clinic as an external data set. Data set D was used to assess the network’s ability to segment and detect glomeruli on WSI level in 15 large tissue specimens obtained after nephrectomies. Data set E served to assess the CNN’s routine examination of 82 kidney transplant biopsies using the Banff classification.
Figure 2.
Figure 2.
Region of PAS-stained slide with ground truth, segmentation by the CNN, and immunohistochemical staining (Aquaporin-1). (A) Represents regions that were used for testing of the CNN (PAS, Radboudumc). (B) The mask of the manually produced annotations (ground truth). (C) The CNN’s result. (D) For illustrative purposes, the PAS slide was restained using anti-Aquaporin-1 antibody, highlighting proximal tubuli. Red arrowhead highlights inconsistency between CNN and ground truth; yellow arrowhead highlights inconsistency with the anti-Aquaporin-1 staining; white arrowhead highlights annotation error. The ground truth and the output of the network overlap largely with the immunohistochemical staining, illustrating the high quality of both.
Figure 3.
Figure 3.
Confusion matrix for the U-net ensemble on the Radboudumc test set for multiclass segmentation performance in kidney transplant biopsies. Confusion matrices provide insight on how predictions are distributed over the different classes. In this figure, the ground truth labels are given vertically and the predicted labels by the CNN are written on the horizontal axis. Here can be seen that, e.g., 98% of all pixels with ground truth label glomeruli, were classified as glomeruli by the CNN ensemble.
Figure 4.
Figure 4.
Full segmentation of a tumor nephrectomy specimen by the CNN on WSI level. Left: segmentation result on low magnification. Top right: segmentation result depicted for specific structures on high magnification.
Figure 5.
Figure 5.
Full segmentation of a transplant biopsy on whole-biopsy level. The (sclerotic) glomeruli segmentations by the CNN are depicted in high magnification in the lower panel; all are correct. The CNN could not separate the two closely adjacent glomeruli (top left), leading to a count of 17 nonsclerotic glomeruli and one sclerotic glomerulus (bottom right).
Figure 6.
Figure 6.
Bland–Altman plots representing the glomerular counts per WSI by three nephropathologists and the glomerular count by the CNN.
Figure 7.
Figure 7.
Scatterplot visualizing the correlation between CNN-based area percentage interstitium and the average intertubular area percentage estimated by two pathologists.
Figure 8.
Figure 8.
Box plots visualizing the CNN’s quantification of interstitium and atrophic tubuli and the ci, ti, and ct lesion scores per pathologist. Top: percentage area of interstitium scored by the CNN and the ci score per pathologist. Middle: percentage area of interstitium scored by the CNN and the ti score per pathologist. Bottom: percentage of atrophic tubuli scored by the CNN and the ct score per pathologist. Each bar represents one pathologist.

Comment in

  • Machine Learning Comes to Nephrology.
    Lemley KV. Lemley KV. J Am Soc Nephrol. 2019 Oct;30(10):1780-1781. doi: 10.1681/ASN.2019070664. Epub 2019 Sep 5. J Am Soc Nephrol. 2019. PMID: 31488608 Free PMC article. No abstract available.
  • Artificial intelligence in nephropathology.
    Boor P. Boor P. Nat Rev Nephrol. 2020 Jan;16(1):4-6. doi: 10.1038/s41581-019-0220-x. Nat Rev Nephrol. 2020. PMID: 31597956 No abstract available.

References

    1. Racusen LC, Solez K, Colvin RB, Bonsib SM, Castro MC, Cavallo T, et al. .: The Banff 97 working classification of renal allograft pathology. Kidney Int 55: 713–723, 1999 - PubMed
    1. Loupy A, Haas M, Solez K, Racusen L, Glotz D, Seron D, et al. .: The Banff 2015 kidney meeting report: Current challenges in rejection classification and prospects for adopting molecular pathology. Am J Transplant 17: 28–41, 2017 - PMC - PubMed
    1. Servais A, Meas-Yedid V, Noël LH, Martinez F, Panterne C, Kreis H, et al. .: Interstitial fibrosis evolution on early sequential screening renal allograft biopsies using quantitative image analysis. Am J Transplant 11: 1456–1463, 2011 - PubMed
    1. Grimm PC, Nickerson P, Gough J, McKenna R, Stern E, Jeffery J, et al. .: Computerized image analysis of Sirius Red-stained renal allograft biopsies as a surrogate marker to predict long-term allograft function. J Am Soc Nephrol 14: 1662–1668, 2003 - PubMed
    1. Kato T, Relator R, Ngouv H, Hirohashi Y, Takaki O, Kakimoto T, et al. .: Segmental HOG: New descriptor for glomerulus detection in kidney microscopy image. BMC Bioinformatics 16: 316–332, 2015 - PMC - PubMed

Publication types