. 2019 Sep 20;365(6459):eaax1971.
doi: 10.1126/science.aax1971. Epub 2019 Sep 5.

A lineage-resolved molecular atlas of C. elegans embryogenesis at single-cell resolution

Affiliations

A lineage-resolved molecular atlas of C. elegans embryogenesis at single-cell resolution

Jonathan S Packer et al. Science. .

Abstract

Caenorhabditis elegans is an animal with few cells but a wide diversity of cell types. In this study, we characterize the molecular basis for their specification by profiling the transcriptomes of 86,024 single embryonic cells. We identify 502 terminal and preterminal cell types, mapping most single-cell transcriptomes to their exact position in C. elegans' invariant lineage. Using these annotations, we find that (i) the correlation between a cell's lineage and its transcriptome increases from middle to late gastrulation, then falls substantially as cells in the nervous system and pharynx adopt their terminal fates; (ii) multilineage priming contributes to the differentiation of sister cells at dozens of lineage branches; and (iii) most distinct lineages that produce the same anatomical cell type converge to a homogenous transcriptomic state.


Conflict of interest statement

Competing interests: The authors have no competing interests.

Figures

Fig 1.
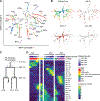
Fig 1.. UMAP projection shows tissues and developmental trajectories in C. elegans embryogenesis.
(A) UMAP projection of the 81,286 cells from our sc-RNA-seq dataset that passed our initial QC. This UMAP does not include 4,738 additional cells that were initially filtered, but were later whitelisted and included in downstream analyses. Color indicates the age of the embryo that a cell came from, estimated from correlation to a whole-embryo RNA-seq time series (22) and measured in minutes after an embryo’s first cell cleavage. (B) Positions of cells from four samples of synchronized embryos on the UMAP plot. (C) Histogram of estimated embryo time for all cells in the dataset. (D) Bar plot showing for bins of embryo time, the percentage of cells in that embryo time bin that we were able to assign to a terminal cell type or pre-terminal lineage. (E) Scatter plot showing correlation of the number of cells of a given anatomical cell class in a single embryo (X axis, log scale) with the number of cells recovered in our data (Y axis, log scale). Each point corresponds to a cell class. Only cells with estimated embryo time >= 390 minutes are included in the counts (many earlier cells are still dividing). Red line is a linear fit, excluding points with y = 0.
Fig 2.
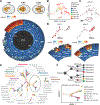
Fig 2.. Annotation of the early lineage.
(A) Diagram showing the position of early mesoderm (MS lineage) cells marked by expression of ceh-51. The lineage radiograph shows the average fluorescent intensity (log10 scaled) of a CEH-51::GFP protein fusion measured by live imaging. The inner rings show the generation of the founder cells, AB (which produces almost exclusively ectoderm and pharynx), MS (mesoderm and pharynx), C (muscle and ectoderm) and P3, which gives rise to P4 (germline) and D (muscle). Daughter cells are named by their relative positions at mitosis (e.g. ABa is the anterior daughter of AB, ABal is left daughter of ABa). (B) UMAP projection of 926 early-stage cells (estimated embryo time <= 150 minutes), colored by embryo time. E lineage and germline cells are excluded and shown separately in Figs S7 and S12, as they differentiate early compared to other lineages. (C) Same UMAP as (B), colored by ceh-51 expression (red indicates cells with >0 UMIs for ceh-51). (D) Expression of hnd-1 and pha-4 measured by sc-RNA-seq (UMAP) and live imaging of GFP protein fusions (radiograph). (E) Cropped section of a UMAP of 8,083 neuron/glia/rectal progenitor cells with embryo time <= 250 minutes (Fig. S15). This plot shows the section of that UMAP that corresponds to the 3,233 cells from the ABpxp ectodermal lineage (“ABpxp” is short-hand for two symmetric lineages, ABplp and ABprp). Colored bold annotations highlight specific lineages that are discussed in the text. (F) Lineage tree for the ABpxppp sub-lineage, highlighting cells that are present in the circled section of (E). The (co-)expression pattern of marker genes identifies branches in the UMAP that correspond to specific ABpxppp descendants. Additional ABpxppp descendants not shown in this panel are annotated in (E), below the circled section.
Fig 3.
Fig 3.. Developmental trajectories of ciliated neurons.
(A) UMAP of 10,740 ciliated neurons and precursors. Colors correspond to cell identity. Text labels indicate terminal cell types. Numbers 1–16 indicate parents of 1 ADE-ADA, 2 CEP-URX 3 PHB-HSN 4 IL1 5 OLL 6 OLQ 7 ASJ-AUA 8 ASE 9 ASI 10 ASK 11 ADF-AWB 12 ASG-AWA 13 ADL 14 ASH-RIB 15 AFD-RMD 16 AWC-SAA (purple) and BAG-SMD (red). 4–6, 8–10, and 13 are listed as parents of only one cell type as the sister cells die. Numbers 17–20 indicate grandparents of 17 IL1 (= IL2 parent) 18 OLQ-URY 19, 20 ASE-ASJ-AUA. Differentiated PHA was not conclusively identified but may co-cluster with PHB. The parent of PHA is not present in this UMAP, but was located separately within the area annotated as “rectal cells” in the UMAP in Fig. S3. The tiny cluster labeled with an asterisk (*) is putatively AWC-ON on the basis of srt-28 expression. (B) UMAP plot colored by embryo time (colors matched to Fig. 1A) and gene expression (red indicates >0 reads for the listed gene). egl-21 codes for an enzyme that is essential for processing neuropeptides (51). Its expression is used as a proxy for the onset of neuron differentiation. mcm-7 codes for a DNA replication licensing factor. Loss of mcm-7 expression in each UMAP trajectory approximately marks the boundary between neuroblasts and terminal cells. unc-130 is known to be expressed in the ASG-AWA neuroblast but neither terminal cell (52). (C) Cartoon illustrating the lineage of the ASE, ASJ, and AUA neurons. (D) Heatmap showing patterns of differential transcription factor expression associated with branches in the ASE-ASJ-AUA lineage. Expression values are log-transformed, then centered and scaled by standard deviation for each row (gene).
Fig 4.
Fig 4.. Full vs. incomplete convergence of lineages producing common cell types.
(A) UMAP of 854 IL1/2 neurons and progenitors colored by estimated embryo time (cells selected on the basis of annotations in Figs. 3A and S15). (B) IL1/2 UMAP colored by ast-1 expression level (log2 size-factor normalized UMI counts). (C) IL1/2 UMAP colored by expression of unc-39, a gene specific to branch 1. (D) Heatmap showing the average expression level of lineage specific and terminal cell type specific genes over time for each of the 3 branches. (E) Fig. S5A shows a UMAP of body wall muscle and mesoderm cells. This panel is a zoomed-in view of that UMAP, including only 17,520 BWM cells, which are grouped into “bands” based on marker gene expression patterns (here, a cell is considered to express a gene if it or >= 2 of 5 of its nearest neighbors have >0 reads for the gene). (F) Physical positions of cells in each BWM band (colors matched to panel E) in the embryo at 430 minutes. Adapted from Fig. 8B of (16). (G) Transcriptome Jensen-Shannon distance for posterior (orange+green bands in panel E) BWM vs. row 2 (blue band) or row 1 (pink band) head BWM over time. Heterogeneity between BWM subsets persists throughout development and may reflect functional differences.
Fig 5.
Fig 5.. Correlation between cell lineage and the transcriptome in the ectoderm.
(A) Jensen-Shannon (JS) distance between the transcriptomes of pairs of ectodermal cells (AB lineage), faceted by cell generation and lineage distance. AB5 refers to the cell generation produced by 5 divisions of the AB founder cell, and likewise for generations AB6–9. The “transcriptome” of a given anatomical cell is defined as the average gene expression profile of all sc-RNA-seq cells annotated as that anatomical cell. Pairs of bilaterally symmetric cells are excluded from the statistics. (B) Estimates of the extent to which lineage predicts the transcriptome in AB5–9. (C) Distribution of the number of “lineage signature transcription factors”—TFs that distinguish a cell from its sister—for all cells in AB5–9. The outlier points in AB8 are instances where a terminal epidermal cell is a sister of a neuroblast. (D) Proportion of lineage signature transcription factors for a cell in a given generation that have expression maintained in 0, 1, or 2 of the cell’s daughters in the subsequent generation. (E) Proportion of lineage signature TFs for which expression in a given cell was maintained from the cell’s parent vs. newly activated after the parent’s division.

Comment in

  • Mapping worm embryogenesis.
    Clyde D. Clyde D. Nat Rev Genet. 2019 Nov;20(11):630. doi: 10.1038/s41576-019-0179-2. Nat Rev Genet. 2019. PMID: 31548660 No abstract available.

References

    1. Qiu X et al., Single-cell mRNA quantification and differential analysis with Census. Nat. Methods 14, 309–315 (2017). - PMC - PubMed
    1. Cao J et al., Comprehensive single-cell transcriptional profiling of a multicellular organism. Science 357, 661–667 (2017). - PMC - PubMed
    1. Fincher CT, Wurtzel O, de Hoog T, Kravarik KM, Reddien PW, Cell type transcriptome atlas for the planarian Schmidtea mediterranea. Science (2018), doi:10.1126/science.aaq1736. - DOI - PMC - PubMed
    1. Plass M et al., Cell type atlas and lineage tree of a whole complex animal by single-cell transcriptomics. Science 360 (2018), doi:10.1126/science.aaq1723. - DOI - PubMed
    1. Tabula Muris Consortium et al., Single-cell transcriptomics of 20 mouse organs creates a Tabula Muris. Nature. 562, 367–372 (2018). - PMC - PubMed

Publication types