. 2019 Sep 5;10(1):3991.
doi: 10.1038/s41467-019-11867-6.

Patient-derived lung cancer organoids as in vitro cancer models for therapeutic screening

Affiliations

Patient-derived lung cancer organoids as in vitro cancer models for therapeutic screening

Minsuh Kim et al. Nat Commun. .

Abstract

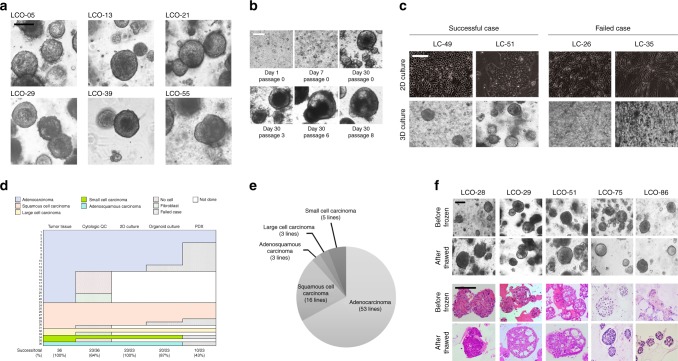
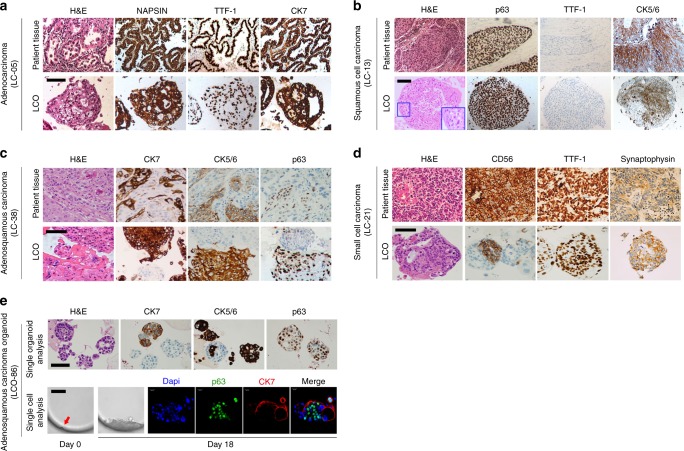
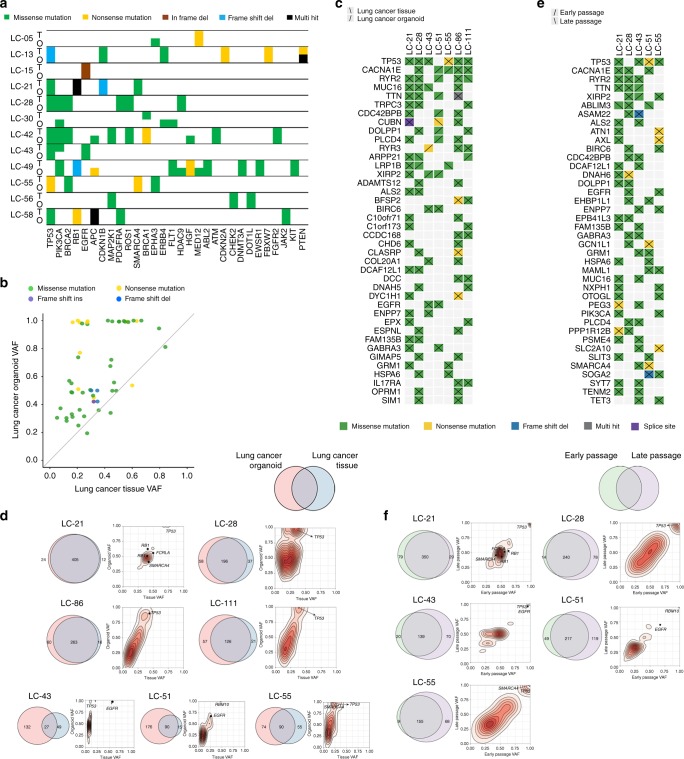
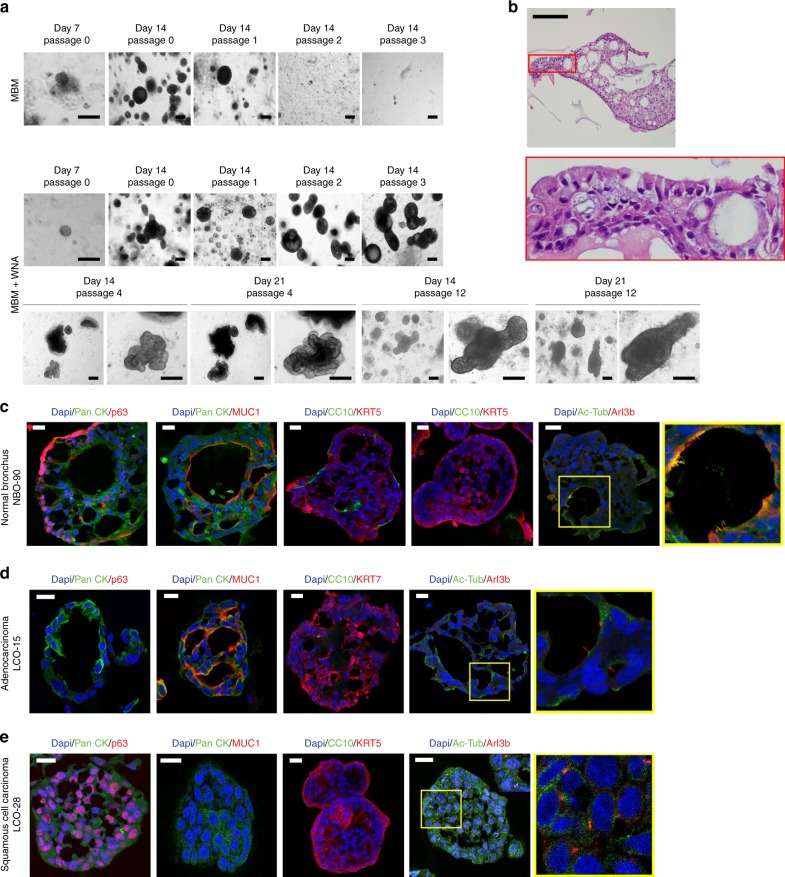
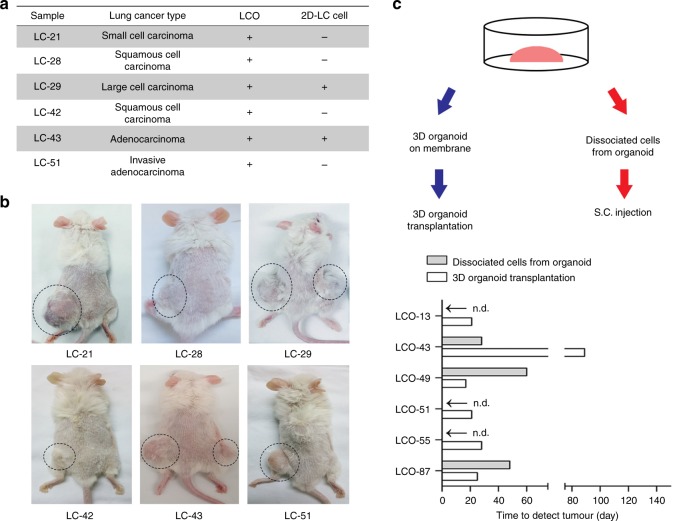
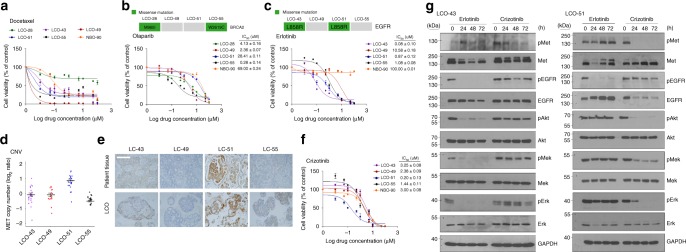
Lung cancer shows substantial genetic and phenotypic heterogeneity across individuals, driving a need for personalised medicine. Here, we report lung cancer organoids and normal bronchial organoids established from patient tissues comprising five histological subtypes of lung cancer and non-neoplastic bronchial mucosa as in vitro models representing individual patient. The lung cancer organoids recapitulate the tissue architecture of the primary lung tumours and maintain the genomic alterations of the original tumours during long-term expansion in vitro. The normal bronchial organoids maintain cellular components of normal bronchial mucosa. Lung cancer organoids respond to drugs based on their genomic alterations: a BRCA2-mutant organoid to olaparib, an EGFR-mutant organoid to erlotinib, and an EGFR-mutant/MET-amplified organoid to crizotinib. Considering the short length of time from organoid establishment to drug testing, our newly developed model may prove useful for predicting patient-specific drug responses through in vitro patient-specific drug trials.


Conflict of interest statement

The authors declare no competing interests.

Figures

Fig. 1
Fig. 1
LCOs established for the lung cancer biobank. a Bright-field microscopy images of LCOs cultured for 2 weeks. Scale bar, 100 μm. The information of LCOs in these images; LCO-05, LCO-36, and LCO-55; adenocarcinoma, LCO-13; squamous cell carcinoma, LCO-21; small cell carcinoma, LCO-29; large cell carcinoma. b Representative images of long-term cultured LCOs. This LCO was derived from LC-49. Scale bar, 200 μm. c Representative images of successful and failed 2D and 3D cultures derived from lung cancers with different tissue composition. Scale bar, 200 μm. d The graph showing the successful or failed cases according to cancer tissue quality and the establishment rate of each cancer models according to lung cancer subtypes. Cytologic QC, cytologic quality check. e Pie chart showing the subtypes of established 80 LCOs for the lung cancer biobank. The information of 80 LCOs is shown in Table 2. f Bright-field microscopy images and H&E staining images of LCOs before freezing and after thawing. Scale bar, 200 μm. The information of LCOs in these images: LCO-28 — squamous cell carcinoma; LCO-29 — large cell carcinoma; LCO-51 — adenocarcinoma; LCO-75 — small cell carcinoma; LCO-86 — adenosquamous carcinoma
Fig. 2
Fig. 2
LCOs recapitulate the characteristics of the original tissues. ad H&E-stained and IHC-stained images of LCOs and their original LC tissues. The enlarged images in blue boxes of b showed cytoplasmic keratinisation of individual squamous carcinoma cells. Scale bars, 100 μm. e H&E and IHC-stained images of an adenosquamous carcinoma organoid (upper panel). Individual organoids expressed either adenocarcinoma marker (CK7) or squamous cell carcinoma markers (CK5/6 or p63). Some single organoids showed mixed cell pattern composed of CK7+ and CK7− cells, CK5/6+ and CK5/6− cells, and p63+ and p63− cells. Scale bar, 100 μm. Bright field microscopy and immunofluorescence (IF) images of an adenosqumaous carcinoma organoid originated from a single cell (lower panel). The immunofluorescence staining was performed at Day 18 after seeding. The organoid from a single cell was composed of p63+/CK7− cells and p63−/CK7+ cells. The red arrow indicated a single cell seeded in a micro-well. Scale bar in bright-field microscopy images, 100 μm. Scale bar in IF images, 20 μm
Fig. 3
Fig. 3
LCOs retain the genetic characteristics of the original tissues after long-term cultured. a Heat-map analysis of the top 30 mutations in LCOs and their corresponding LC tissues. O LCO, T patient tissue. b Comparison of VAF of genetic alterations detected in LCOs and LC tissues. c Heatmap showing somatic mutations affecting cancer genes in LC tissues and paired LCOs. d Venn diagrams indicating the number of somatic mutations present in each LC tissues and their paired LCOs. e Heatmap showing somatic mutations affecting cancer genes in early passage and late passage organoids. f Venn diagrams indicating the number of somatic mutations present in early passage and late passage organoids
Fig. 4
Fig. 4
Organ-like structures of the NBOs and LCOs. a Bright-field microscopy images of a NBO, NBO-90. NBO-90 was cultured in MBM and MBM + WNA (W; Wnt3A, N; Noggin, A; A83-01). Scale bars, 200 μm. b H&E staining image of NBO-90. Scale bar, 100 μm. ce Immunofluorescence images showing the expression of pancytokeratin, p63, MUC1, KRT5, KRT7, CC10, and cilia co-stained with acetylated α-tubulin (Ac-Tub) and Arl13b (The enlarged images in yellow boxes showed cilia co-stained with Ac-Tub and Arl13b). Nuclei (blue) were stained with DAPI. Scale bar, 20 μm
Fig. 5
Fig. 5
PDXs from LCOs maintain the characteristics of the original tissues. a List of PDXs established by transplanting LCOs or injecting 2D-LC cells. Transplanted LCOs and injected 2D-LC cells that formed tumours in mice are marked as “+”, and the LCOs and 2D-LC cells that did not form tumours are marked as “−”. b Images of mice used to establish PDXs. LCOs (left) and 2D-LC cells (right) were simultaneously transplanted or injected into the same mouse. Circles indicate the formed tumours. c Experimental design and results. Bar graph showing the number of days until tumour formation. n.d: tumour not detected
Fig. 6
Fig. 6
LCOs as a platform for predicting therapeutic responses. a Dose-response curves after 6 days of treatment with docetaxel. The cell viability was measured by luminescence signal intensities. b and c Dose-response curves after 6 days of treatment with olaparib b or erlotinib c. The indicated drug concentrations were used to treat two LCO lines with mutations (green box), another two LCO lines without mutations (grey box) and the NBO. Representative viability curves were generated from luminescence signal intensities. d The copy number variation (CNV) graph showing MET copy number amplification in the four LCO lines. e IHC-stained images showing c-MET expression in the four patient tissues and LCOs. Scale bar, 100 μm. f Dose-response curves after treatment with indicated drug concentrations of crizotinib in four LCOs and a NBO. Representative viability curves were generated from the luminescence signal intensities. g Immunoblot analysis showing changed protein expressions mediating EGFR signalling and c-Met signalling transduction after treating erlotinib and crizotinib. Two LCOs, LCO-43 and LCO-51 were treated with 1 μM erlotinib and 1 μM crizotinib for 24, 48 and 72 h. GAPDH was used as a loading control. Full-length blot is shown in the supplementary information, and the gels have been run under the same experimental conditions. All error bars in ac and f indicate SEM, n = 3. In b, c and f IC50 values are the average ± SD of each condition analysed in triplicate. When error bars are not visible they are smaller than the size of the symbol

References

    1. Li S, et al. Enhanced recovery programs in lung cancer surgery: systematic review and meta-analysis of randomized controlled trials. Cancer Manag. Res. 2017;9:657–670. doi: 10.2147/CMAR.S150500. - DOI - PMC - PubMed
    1. Herbst. RS, Heymach JV, Lippman SM. Lung cancer. N. Engl. J. Med. 2008;359:1367–1380. doi: 10.1056/NEJMra0802714. - DOI - PMC - PubMed
    1. Reck M, et al. Pembrolizumab versus chemotherapy for PD-L1-positive non-small-cell lung cancer. N. Engl. J. Med. 2016;375:1823–1833. doi: 10.1056/NEJMoa1606774. - DOI - PubMed
    1. Sachs N, Clevers H. Organoid cultures for the analysis of cancer phenotypes. Curr. Opin. Genet. Dev. 2014;24:68–73. doi: 10.1016/j.gde.2013.11.012. - DOI - PubMed
    1. Chen Z, Fillmore CM, Hammerman PS, Kim CF, Wong KK. Non-small-cell lung cancers: a heterogeneous set of diseases. Nat. Rev. Cancer. 2014;14:535–546. doi: 10.1038/nrc3775. - DOI - PMC - PubMed

Publication types