. 2019 Sep 5;10(1):4017.
doi: 10.1038/s41467-019-11734-4.

Neural sensitization improves encoding fidelity in the primate retina

Affiliations

Neural sensitization improves encoding fidelity in the primate retina

Todd R Appleby et al. Nat Commun. .

Abstract

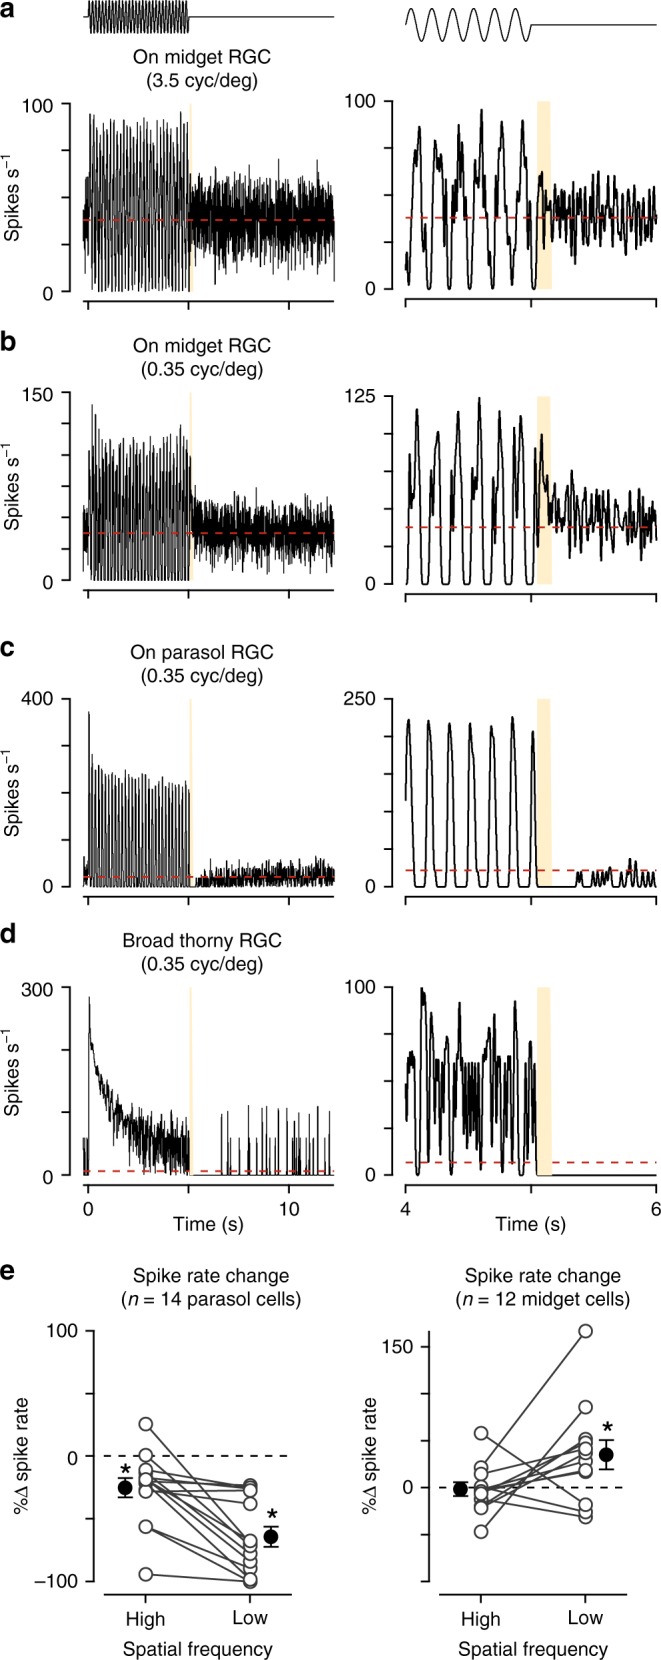
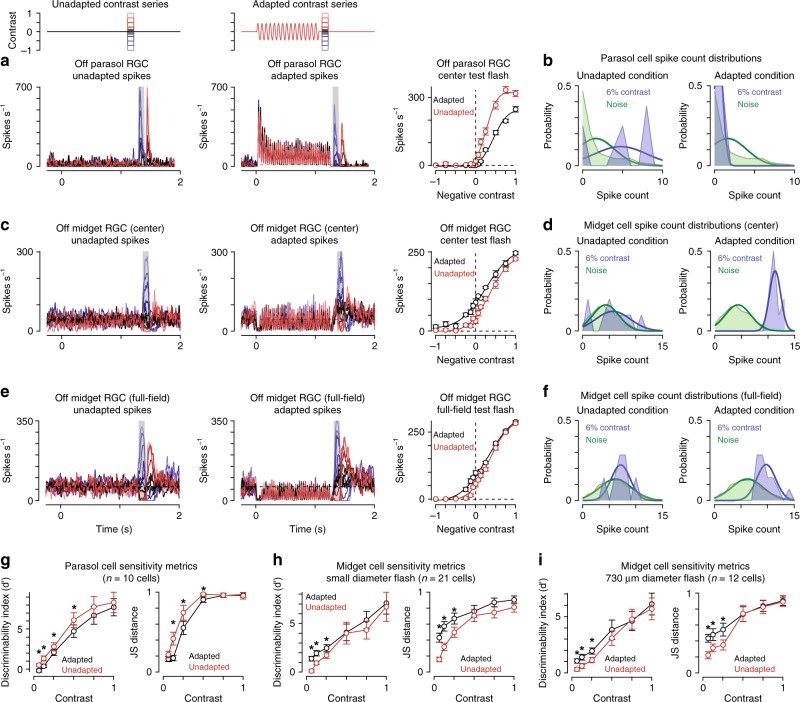
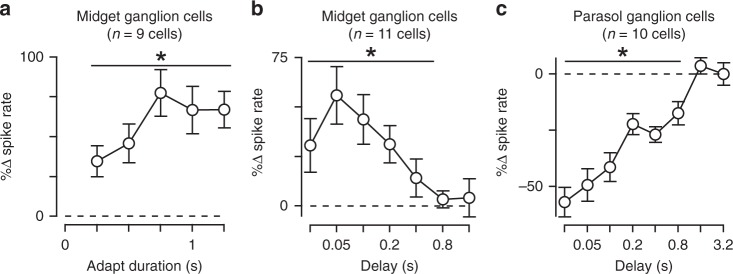
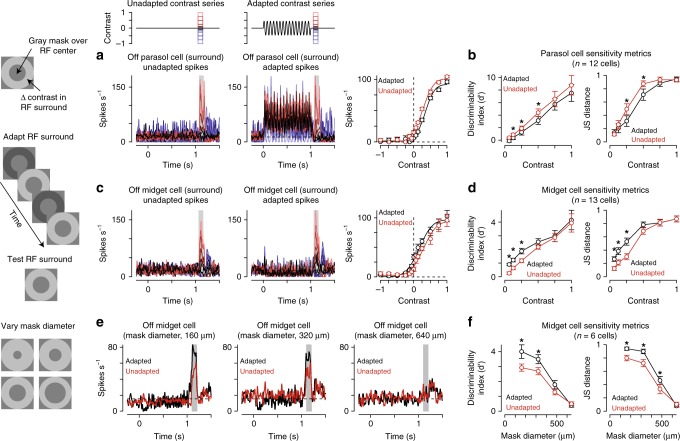
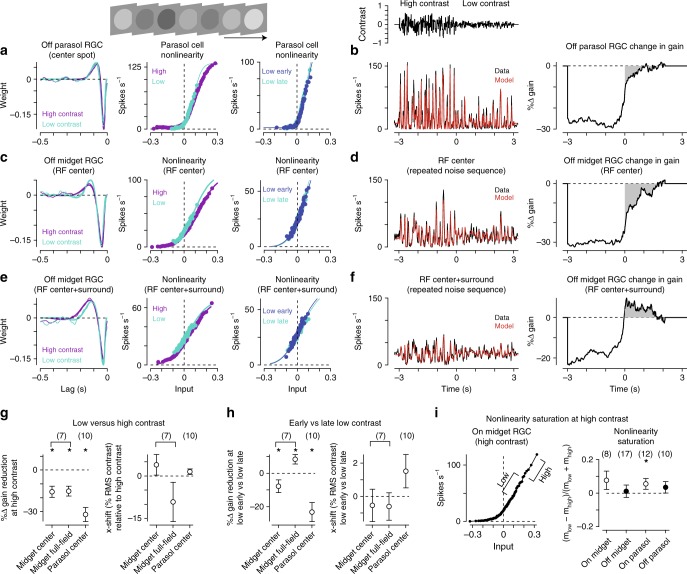
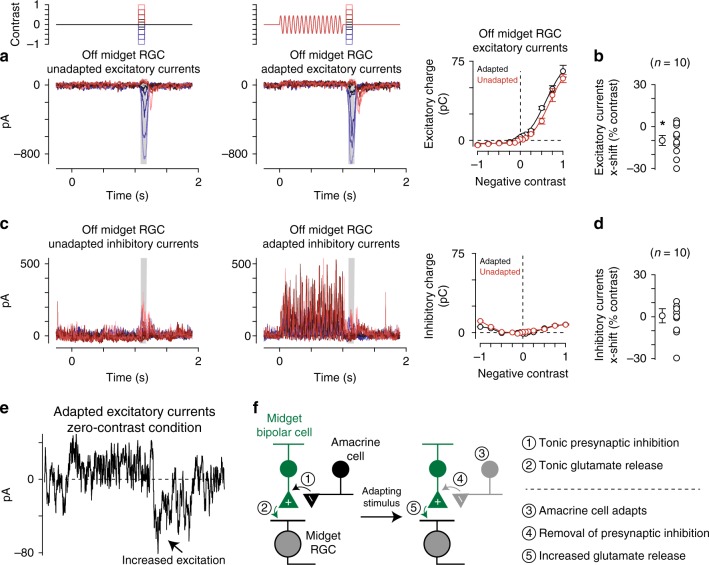
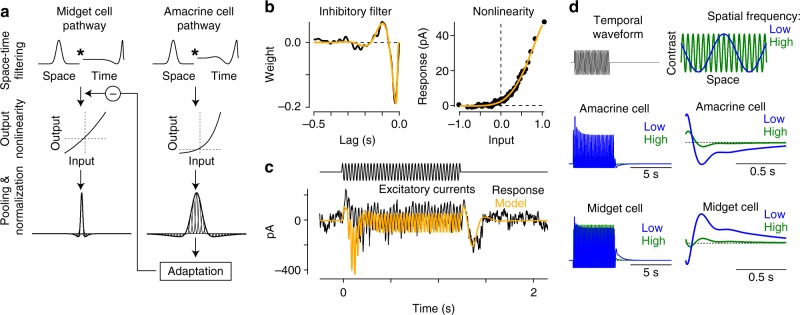
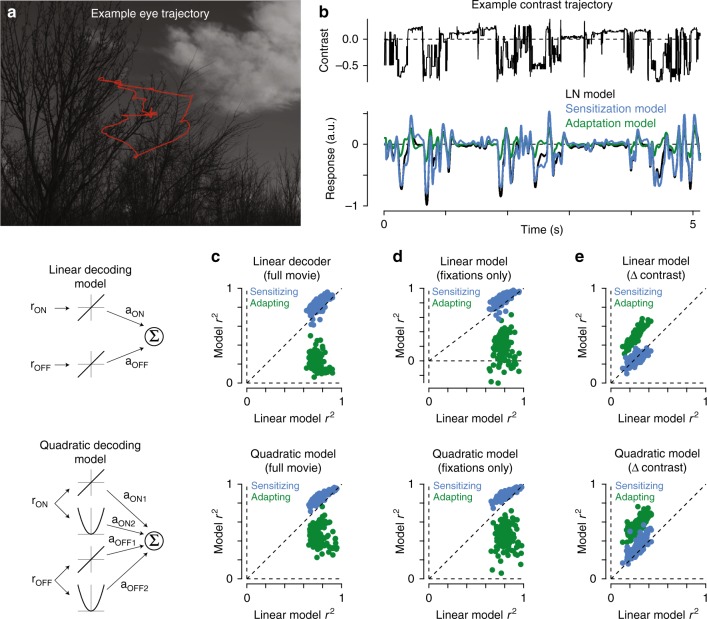
An animal's motion through the environment can induce large and frequent fluctuations in light intensity on the retina. These fluctuations pose a major challenge to neural circuits tasked with encoding visual information, as they can cause cells to adapt and lose sensitivity. Here, we report that sensitization, a short-term plasticity mechanism, solves this difficult computational problem by maintaining neuronal sensitivity in the face of these fluctuations. The numerically dominant output pathway in the macaque monkey retina, the midget (parvocellular-projecting) pathway, undergoes sensitization under specific conditions, including simulated eye movements. Sensitization is present in the excitatory synaptic inputs from midget bipolar cells and is mediated by presynaptic disinhibition from a wide-field mechanism extending >0.5 mm along the retinal surface. Direct physiological recordings and a computational model indicate that sensitization in the midget pathway supports accurate sensory encoding and prevents a loss of responsiveness during dynamic visual processing.


Conflict of interest statement

The authors declare no competing interests.

Figures

Fig. 1
Fig. 1
Midget and parasol ganglion cells exhibit opposing forms of plasticity. a Spike rate in an On midget ganglion cell to a high spatial frequency grating presented for 5 s (temporal frequency, 6 Hz; spatial frequency, 3.5 cycles degree–1). The spike rate immediately after grating offset showed little change relative to the period prior to grating onset. Right: Zoom of transition period. b Spike responses from the same cell as in a to a low spatial frequency grating (0.35 cycles degree–1). Spiking showed a transient increase following the offset of high contrast, consistent with contrast sensitization. c Spike rate in an On parasol ganglion cell to a low spatial frequency drifting grating (0.35 cycles degree–1). After the offset of high contrast, the spike rate declined below the level prior to grating onset (red dashed line). d Same as a in a broad thorny (On-Off type) ganglion cell. e Change in spike rate for the period directly after grating offset relative to period prior to grating onset in parasol (left) and midget ganglion cells (right). Spiking in parasol cells was significantly reduced for both spatial frequencies (p < 6.0 × 10–3; n = 14 cells) and significantly increased in midget cells for the low spatial frequency grating (p = 3.4 × 10–2; n = 12 cells). Statistical significance calculated using the Wilcoxon signed rank test
Fig. 2
Fig. 2
Midget ganglion cells display contrast sensitization. a Spike responses from an Off parasol ganglion cell to a series of spots centered over the receptive field. Spots were either presented alone (left) or 50 ms following the offset of an adapting stimulus (middle). Shaded regions indicate sampling windows. Right: Average spike rate across the shaded regions. The wide-field adaptation evoked a decrease in the slope (gain) of the contrast-response curve (black) relative to the unadapted control condition (red). b Spike count distributions for the Off parasol cell in (a) to a −6% contrast flash and the noise condition in which a flash was not presented (i.e., 0% contrast). The adapting stimulus decreased spiking at low contrast and shifted the low-contrast distribution toward the noise distribution (right) relative to the unadapted condition (left). c Same as (a) for an Off midget ganglion cell. Right: Average spike rate across the shaded regions. The wide-field adaptation evoked a leftward shift in the contrast-response curve (black) relative to the unadapted control condition (red). d Same as (b) for the Off midget cell in (c). The adapting stimulus increased spike counts at low contrast, increasing the separation between the low-contrast and noise distributions. e Spike responses of an Off midget cell to wide-field test flashes in the absence (left) or presence (middle) of the adapting stimulus. f Same as (d) for the Off midget cell in (e). g Discriminability index (left) and Jensen-Shannon distance (right) for preferred-contrast responses relative to background noise in parasol ganglion cells (n = 10). h Sensitivity indices in 21 midget ganglion cells for small diameter test flashes. Discriminability index and Jensen-Shannon distance increased significantly at low contrast (≤25%) following the adapting stimulus (p < 0.01). i Sensitivity indices in 12 midget cells for wide-field test flashes. The adapting stimulus produced a significant increase in the Jensen-Shannon distance at low contrast (6%; p = 1.5 × 10–3). Circles and bars indicate mean ± SEM. Statistical significance calculated using the Wilcoxon signed rank test
Fig. 3
Fig. 3
Time course of contrast sensitization and adaptation. a Change in spike rate for the adapted condition relative to unadapted control for adaptation periods (contrast, ±0.25–0.5; delay 0.05 s). Adaptation period was varied between 0.25 and 1.25 s (x-axis). The adapting stimulus produced a significant increase in spiking for each of the durations tested (p < 4.0 × 10–3; n = 9 cells). b Duration of contrast sensitization in midget ganglion cells. Test flashes (contrast, ±0.25–0.5) were presented at different delays (x-axis) following the offset of an adapting stimulus. Percent change in spike rate for the adapted condition relative to the unadapted condition is shown on the y-axis. Increase in spiking was statistically significant for delays ≤0.4 s (p < 7.0 × 10–3; n = 11 cells). c Same as (b) for parasol ganglion cells. The adapting stimulus significantly reduced spiking at delays ≤0.8 s (p < 7.0 × 10–3; n = 10 cells). Error bars indicate mean ± SEM. Statistical analyses were paired and significance was calculated using the Wilcoxon signed rank test
Fig. 4
Fig. 4
Sensitization arises in the receptive-field surround. a Spike responses from an Off parasol ganglion cell to a series of stimuli presented in the receptive-field surround. Annuli were presented in isolation (left) or following an adapting stimulus that was also presented in the receptive-field surround (middle). The adapting stimulus evoked a decrease in spiking at positive contrasts relative to the unadapted condition (red). b Discriminability index (d′; left) and Jensen-Shannon distance (right) for contrast responses relative to background noise in parasol ganglion cells (n = 12). Statistically significant change in sensitivity indicated with asterisk. c Responses from an Off midget ganglion cell to the surround adaptation stimulus paradigm. Consistent with weak contrast sensitization, the adapting stimulus elicited a slight leftward shift in the contrast-response function relative to the control condition (right). d Sensitivity indices in 12 midget ganglion cells for surround test flashes. e Sensitization varies with the degree of surround stimulation. Spike responses from an Off midget cell to the surround adaptation stimulus for three mask diameters. For some mask diameters, surround adaptation (black) produced larger spike responses during the surround flash relative to the unadapted condition (red). This increase in responsiveness was not present for the largest mask diameter (640 μm, right). f Sensitivity metrics for four mask diameters in midget ganglion cells (n = 6 cells). Surround adaptation produced significant larger d′ values for mask diameters ≤320 μm and Jensen-Shannon distance values for diameters ≤480 μm (p < 0.05; Wilcoxon signed rank test). Error bars indicate mean ± SEM
Fig. 5
Fig. 5
Changes in stimulus variance evoke changes in the input–output properties of midget cells. a Temporal filters (left) and input–output nonlinearities (middle) in an Off parasol cell for the high and low-contrast periods. Separate nonlinearities were also calculated for the low-contrast region directly following the transition from high-to-low contrast (low early) and for the sustained low-contrast region (low late; right). b Average spike rate (black) and linear–nonlinear model prediction (red) for the repeated contrast trajectory (left). Data and model showed high correspondence (high contrast r2, 0.87 ± 0.02; low contrast r2, 0.73 ± 0.04; n = 10 cells). Right, average gain as a function of time. Values are shown relative to the sustained low-contrast period. Shaded regions indicate the period of low contrast. c Same as a for an Off midget ganglion cell to a small spot (diameter, 80 μm) presented over the receptive-field center. d Left: Spike rate (black) and model prediction (red) for repeated contrast trajectory (high contrast r2, 0.91 ± 0.02; low contrast r2, 0.71 ± 0.07; n = 7 cells). The cell’s gain was reduced following the shift to low contrast and recovered quickly to the level of sustained gain. e Linear–nonlinear model for the cell in (c) to a large spot (diameter, 730 μm). f Responses of the cell in (b) for the large diameter spot (left). Following the transition to low contrast, gain quickly increased, exceeding the sustained level for ~2 s (right). g Left: Reduction in gain at high contrast relative to the low-contrast condition. Gain was significantly reduced at high contrast for both midget and parasol cells (n = 7 midget cells; n = 10 parasol cells; p < 0.05). Right: Horizontal shift along the x-axis for the low contrast nonlinearity relative to high contrast. Wide-field stimulation in midget cells evoked a shift of ~10% RMS contrast for the low-contrast condition indicating that lower contrasts were required to evoke the same spike rate as the high contrast condition. h Change in gain (left) and horizontal shift (right) for the early versus late low-contrast periods. i Nonlinearity saturation was measured for high contrast Gaussian noise (RMS contrast, 0.3) in midget and parasol ganglion cells. Saturation was quantified by comparing the slopes for the high and low-variance regions of the nonlinearity (left). The slope differences were near zero, indicating a lack of strong saturation in both midget and parasol ganglion cells (right); only On parasol cells showed saturation values that were significantly greater than zero (p = 4.6 × 10–2; all other p > 0.1). Error bars indicate mean ± SEM. Statistical significance for paired values determined using Wilcoxon signed rank test and unpaired values with the Wilcoxon signed rank test
Fig. 6
Fig. 6
Sensitization arises from an achromatic mechanism. a Spike responses from an Off midget ganglion cell to a chromatic (isoluminant) contrast series. Spots were either presented alone (left) or 50 ms following the offset of an achromatic adapting stimulus (right). Shaded regions indicate sampling windows. b Average spike rate across the shaded regions indicated in (a). Achromatic adaptation evoked a leftward shift in the contrast-response curve (black) relative to the unadapted control condition (red) for the chromatic test flash. c Sensitivity metrics for the achromatic adapting stimulus followed by a chromatic contrast series in eight midget ganglion cells. The adapting stimulus improved chromatic sensitivity at low contrast (contrast, ≤25; p < 0.05; Wilcoxon signed rank test). d Spike responses for the cell in (a) to a chromatic adapting stimulus. e Average spike rate during the chromatic test flashes. The chromatic adapting stimulus did not evoke a large change in the contrast-response curve relative to control. f Sensitivity metrics for the chromatic adaptation experiment. Changes in sensitivity were not significantly different relative to the unadapted control at any contrast (n = 8 cells; p > 0.1; Wilcoxon signed rank test). Circles and bars indicate mean ± SEM
Fig. 7
Fig. 7
Sensitization was present in excitatory synaptic input from midget bipolar cells. a Excitatory synaptic currents from a central Off midget ganglion cell to a series of spots (diameter, 40–80 μm) centered over the receptive field. Spots were either presented alone (left) or 50 ms following the offset of an adapting stimulus (right; diameter, 730 μm). Shaded regions indicate sampling windows. Right: Average excitatory synaptic charge across the shaded regions. The wide-field adaptation evoked a leftward shift in the contrast-response curve (black) relative to the unadapted control condition (red). b Population data from midget cells showing the x-axis shift for adapted relative to unadapted conditions in excitatory synaptic currents. The adapting stimulus evoked a significant leftward shift relative to the unadapted condition, indicating that contrast sensitization was present in the excitatory input from midget bipolar cells to midget ganglion cells (n = 10 cells; p = 1.4 × 10–2). Mean values are shown in gray. Open circles are individual cells. c Inhibitory synaptic currents from the Off midget cell in (a). Inhibitory currents did not show a noticeable shift along the x-axis (right) and were small relative to excitatory currents recorded in the same cell (compare (a) with (c)). d Horizontal shift values for inhibitory synaptic inputs as in (b). Inhibitory inputs did not show consistent leftward shifts, indicating that postsynaptic inhibition was unlikely to contribute to the contrast sensitization observed in the spike output of midget ganglion cells (n = 10 cells; p = 0.15). Error bars indicate mean ± SEM. Statistical significance determined with Wilcoxon signed rank test. e Excitatory current recordings from the Off midget cell in (a) under the condition in which the stimulus intensity returned to the mean luminance after the offset of the adapting stimulus and an additional test flash was not presented (zero-contrast condition). A sustained increase in excitatory current was observed at the offset of that stimulus. f Proposed model for contrast sensitization in midget bipolar cells. Statistical significance was determined using the Wilcoxon signed rank test
Fig. 8
Fig. 8
Sensitization model reproduces experimental results. a Sensitization model structure. Visual inputs were convolved with a spatiotemporal linear filter comprised of a Gaussian in space and a biphasic filter in time. Signals in the amacrine cell pathway were then passed through an output nonlinearity before passing to the adaptation stage of the model. The output of the amacrine cell model provided inhibitory input to the midget bipolar cell pathway upstream of the bipolar cell output nonlinearity. b Inhibitory temporal filter (left) and input–output nonlinearity (right) determined from noise recordings. These filters were then used as components of the computational model (a). c Excitatory current recording from an Off midget ganglion cell to the wide-field adapting stimulus (see Fig. 7). Model prediction (orange) was generated from excitatory synaptic current recordings to the noise stimulus in the same cell. d Model output for drifting grating stimuli at high and low spatial frequencies
Fig. 9
Fig. 9
Sensitization increases the fidelity of encoding natural movies. a Example image from the DOVES database. The observer’s eye trajectory is shown in red. b Top: temporal contrast sequence from the eye movement data in (a). Bottom: responses of the adaptation and sensitization models to the example contrast sequence. c Performance of the sensitization and adaptation (y-axis) models at reconstructing 161 natural movies in the database. Model performance is shown relative to the linear–nonlinear model performance for each movie (x-axis). Performance was measured as the Pearson correlation between the stimulus and model predictions after adjusting for temporal lag. Performance for each movie is indicated by a dot. The sensitization model outperformed the linear–nonlinear and adaptation models (p < 6.2 × 10−26). d Model performances as in (c), but restricted to periods of fixation. The sensitization model again outperformed the linear–nonlinear and adaptation models (p < 4.4 × 10−25). e Model performance for the change in contrast as a function of time. The adaptation model outperformed both the linear–nonlinear and sensitizing models at decoding the change in the contrast trajectory (p < 1.0 × 10−23). Statistical tests were paired and were determined using Wilcoxon signed rank test
Fig. 10
Fig. 10
Background motion evokes adaptation in parasol cells and sensitization in midget cells. a Averages spike rate as a function of time for an Off parasol ganglion cell a stationary texture followed by a series of test flashes centered over the cell’s receptive field (left) or following the offset of texture motion (right; speed, 11 degrees s–1). b Contrast-response functions for the cell in (a) for the measurements with a stationary texture (red) or a moving texture (black). c Sensitivity metrics for this experiment across 10 parasol cells. d Spike responses from an Off midget ganglion cell to the same experimental protocol. e Average spike rate across the shaded regions indicated in (d). The wide-field adaptation evoked a leftward shift in the contrast-response curve (black) relative to the unadapted control condition (red). f Sensitivity values for the motion experiment across 12 midget cells. Motion produced a significant increase in sensitivity at low contrast relative to the stationary condition (contrast, ≤50%; p < 0.05; Wilcoxon signed rank test). Circles and bars indicate mean ± SEM

References

    1. Srinivasan MV, Laughlin SB, Dubs A. Predictive coding: a fresh view of inhibition in the retina. Proc. R. Soc. Lond. B Biol. Sci. 1982;216:427–459. doi: 10.1098/rspb.1982.0085. - DOI - PubMed
    1. Barlow, H. B. in Current Problems in Animal Behaviour (eds Thorpe, W. H. & Zangwill, O. L.) 331–360 (Cambridge University Press, Cambridge, 1961).
    1. Laughlin S. A simple coding procedure enhances a neuron’s information capacity. Z. Naturforsch. C. 1981;36:910–912. doi: 10.1515/znc-1981-9-1040. - DOI - PubMed
    1. Baccus SA, Meister M. Fast and slow contrast adaptation in retinal circuitry. Neuron. 2002;36:909–919. doi: 10.1016/S0896-6273(02)01050-4. - DOI - PubMed
    1. Carandini M, Ferster D. A tonic hyperpolarization underlying contrast adaptation in cat visual cortex. Science. 1997;276:949–952. doi: 10.1126/science.276.5314.949. - DOI - PubMed

Publication types