. 2019 Sep 5;10(1):4007.
doi: 10.1038/s41467-019-11978-0.

Gut microbiota confers host resistance to obesity by metabolizing dietary polyunsaturated fatty acids

Affiliations

Gut microbiota confers host resistance to obesity by metabolizing dietary polyunsaturated fatty acids

Junki Miyamoto et al. Nat Commun. .

Abstract

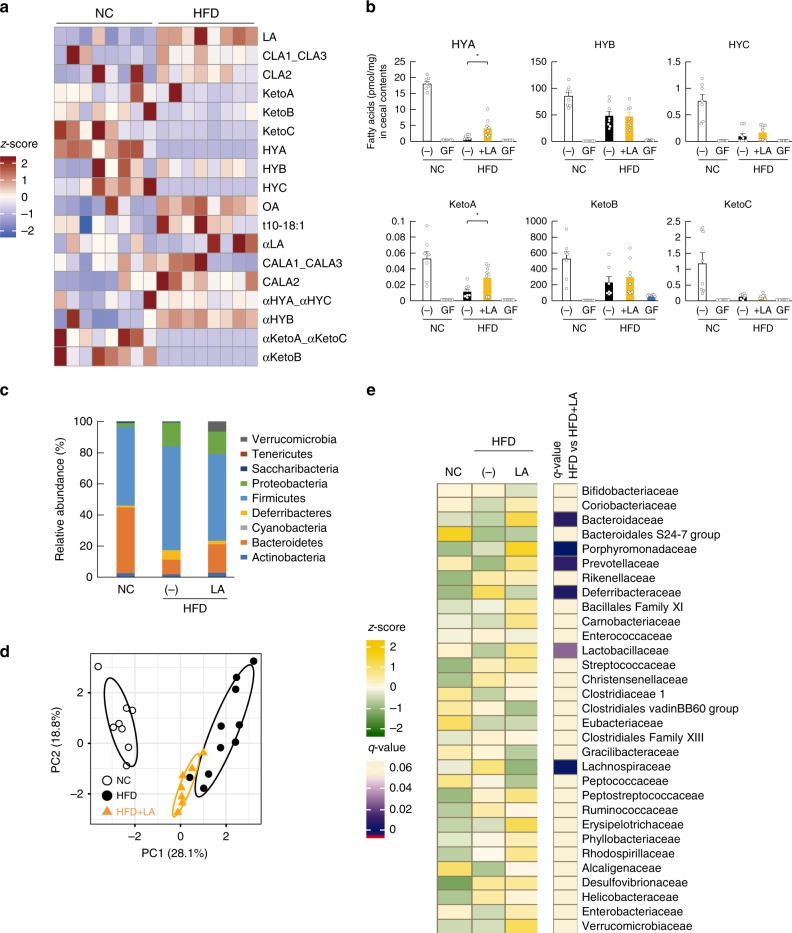
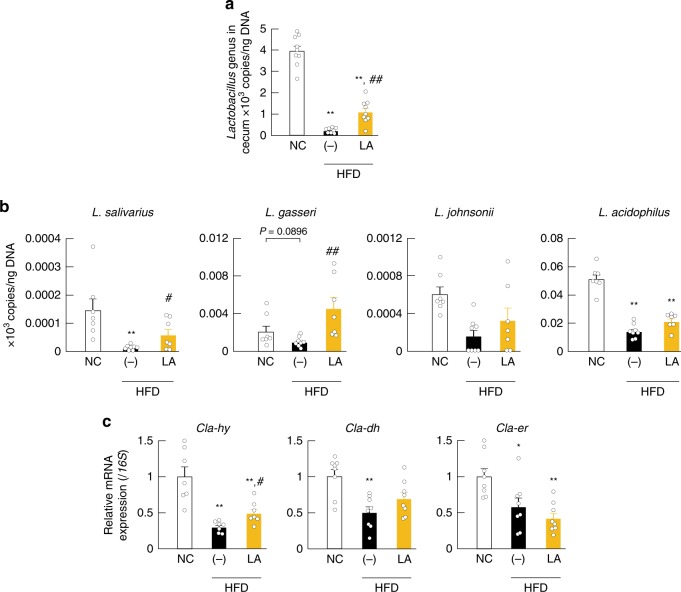
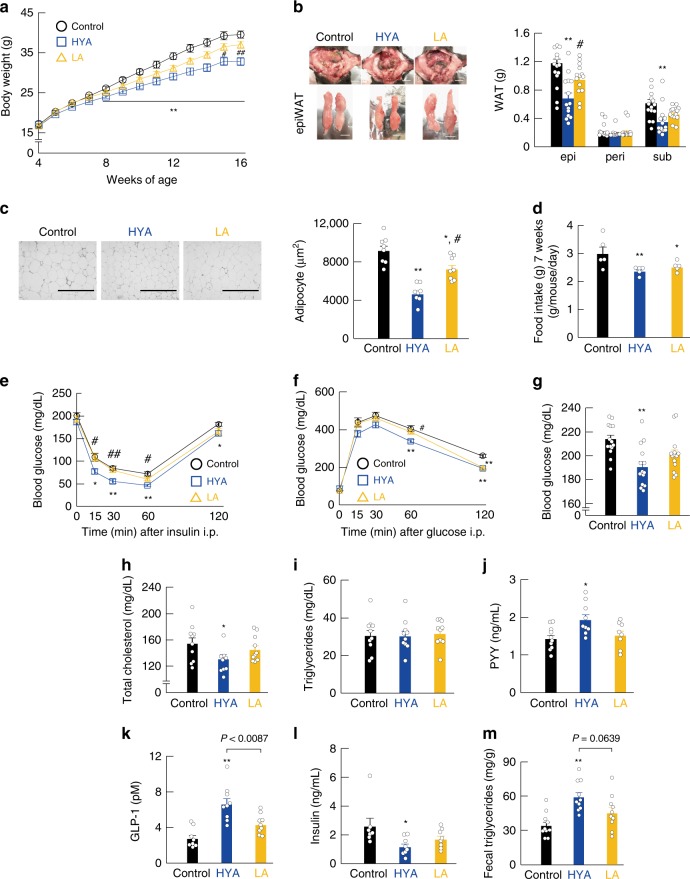
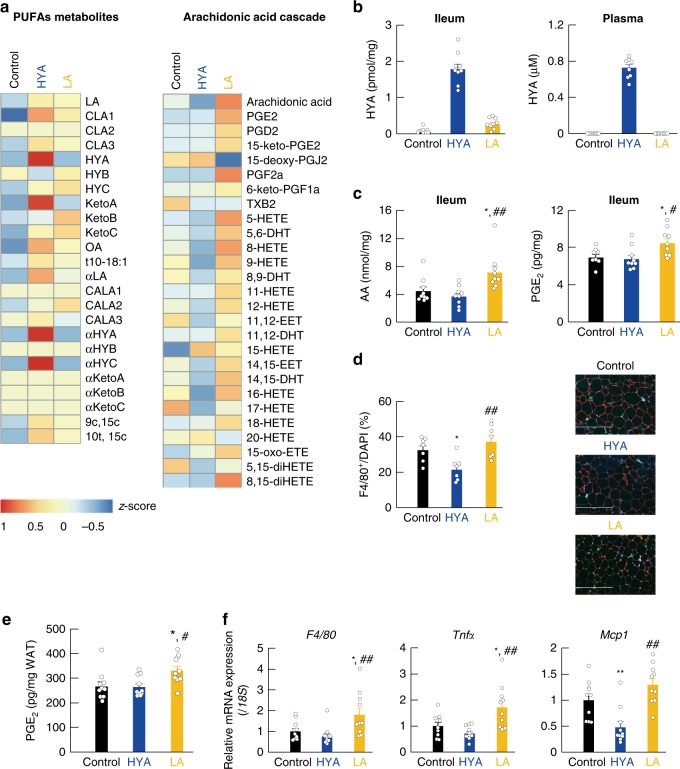
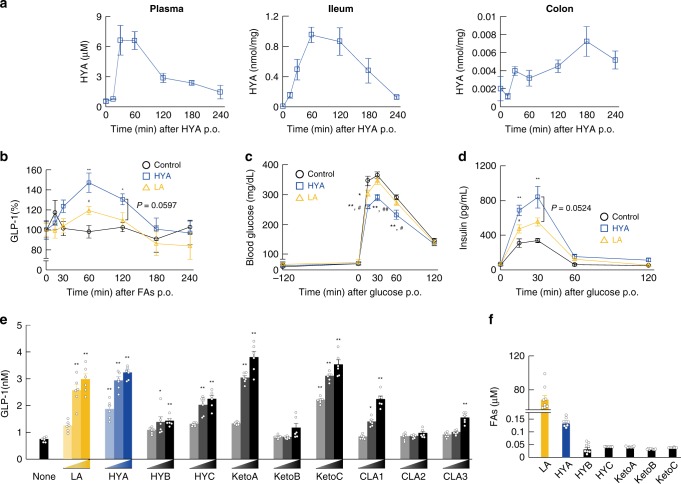
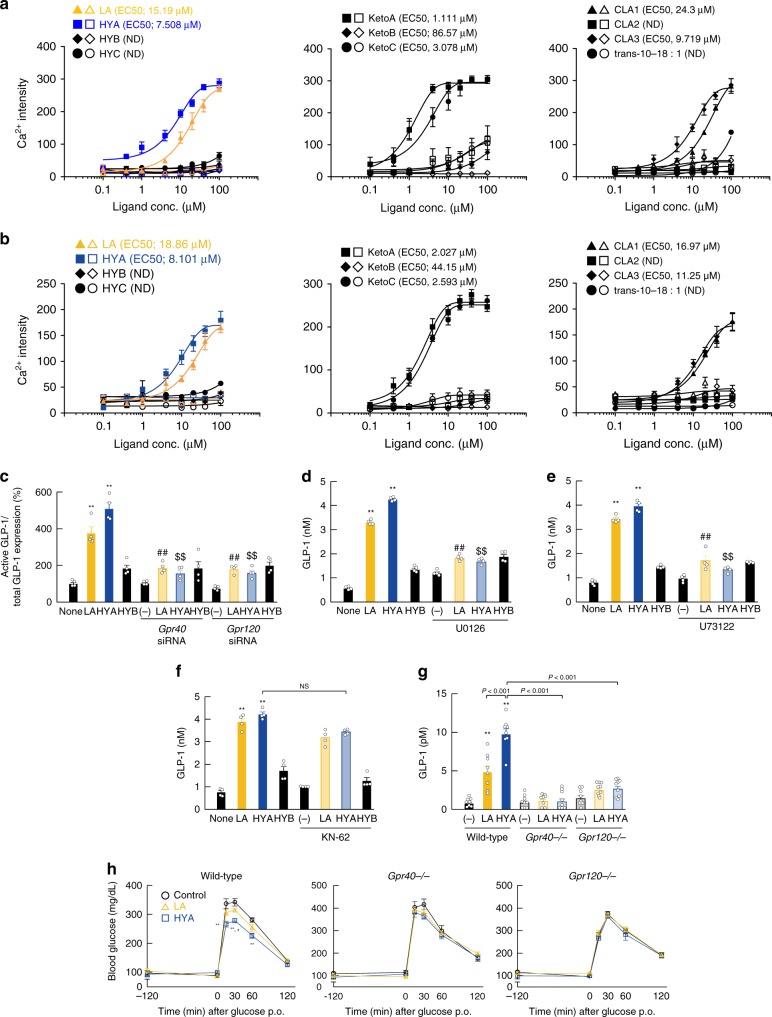
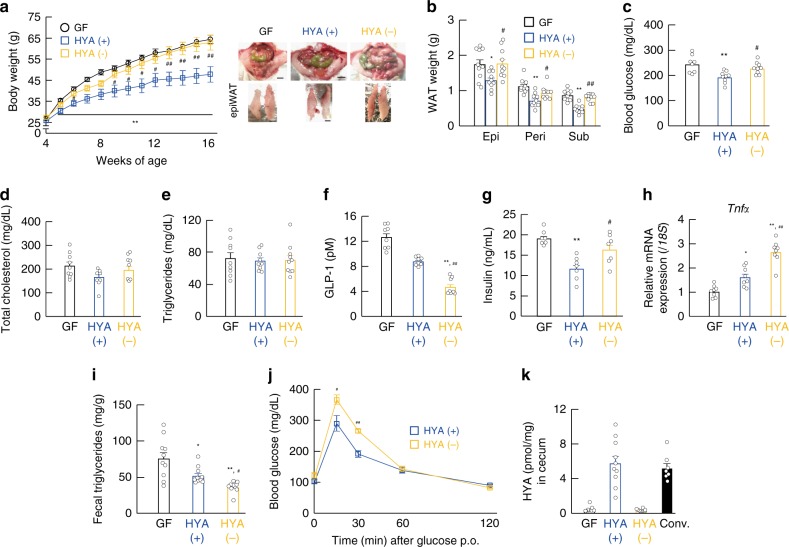
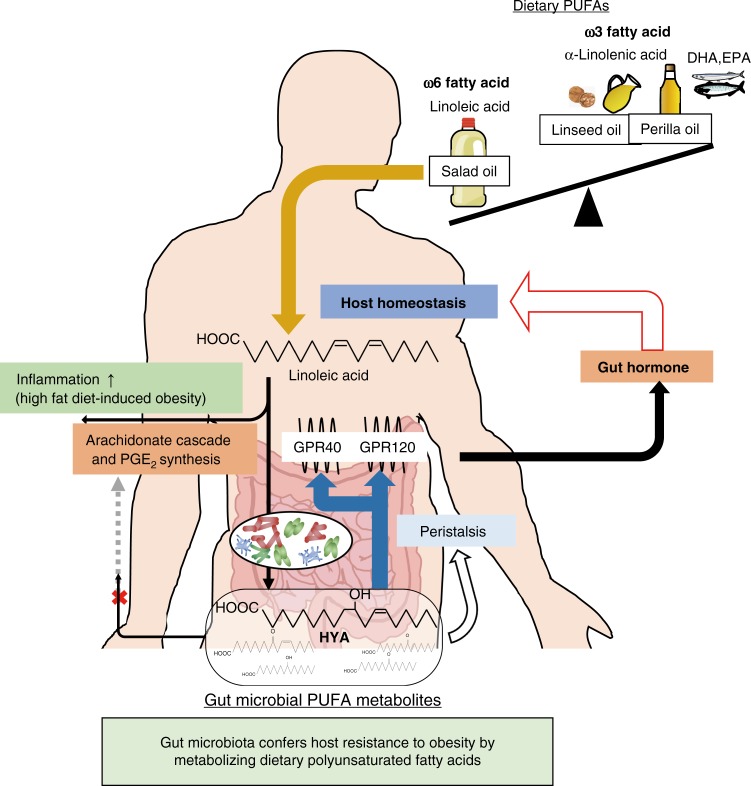
Gut microbiota mediates the effects of diet, thereby modifying host metabolism and the incidence of metabolic disorders. Increased consumption of omega-6 polyunsaturated fatty acid (PUFA) that is abundant in Western diet contributes to obesity and related diseases. Although gut-microbiota-related metabolic pathways of dietary PUFAs were recently elucidated, the effects on host physiological function remain unclear. Here, we demonstrate that gut microbiota confers host resistance to high-fat diet (HFD)-induced obesity by modulating dietary PUFAs metabolism. Supplementation of 10-hydroxy-cis-12-octadecenoic acid (HYA), an initial linoleic acid-related gut-microbial metabolite, attenuates HFD-induced obesity in mice without eliciting arachidonic acid-mediated adipose inflammation and by improving metabolic condition via free fatty acid receptors. Moreover, Lactobacillus-colonized mice show similar effects with elevated HYA levels. Our findings illustrate the interplay between gut microbiota and host energy metabolism via the metabolites of dietary omega-6-FAs thereby shedding light on the prevention and treatment of metabolic disorders by targeting gut microbial metabolites.


Conflict of interest statement

The authors declare no competing interests.

Figures

Fig. 1
Fig. 1
Effects of dietary PUFAs on gut microbiota composition and PUFA metabolites. a Heat map of gut microbial PUFA metabolites in cecal content (n = 8 per group). b LA-derived gut microbial PUFA metabolites in cecal content were quantified (n = 7, 10, 8, 8, and 8 per group for HYA; n = 8,10, 8, 8, and 8 per group for HYB; n = 7, 10, 8, 8, and 10 per group for HYC; n = 8, 10, 8, 8, and 10 per group for KetoA; n = 7, 10, 7, 8, and 8 per group for KetoB; n = 8, 9, 8, 8, and 8 per group for KetoC). *P < 0.05 (Tukey–Kramer test). ce Gut microbial composition was evaluated in order to determine the relative abundance of microbial taxa (c), diversity (d), and abundance of the bacterial domain at the family level (e) (n = 8, 10, and 7 per group). (−)_NC represents normal chow-fed mice, and (−)_HFD represents high-fat diet-fed mice. q < 0.05. Results are presented as means ± SE. Source data are provided as a Source Data file 1
Fig. 2
Fig. 2
HYA-producing lactic acid bacteria. a The abundance of Lactobacillus was analyzed by qPCR (n = 9, 8, and 9 per group). b The abundance of the Lactobacillus strains (n = 7, 8, and 7 per group) and c the relative mRNA expression of metabolite-synthesizing enzymes (Cla-hy, Cla-dh, and Cla-er; see Supplementary Fig. 1) (n = 7 per group for Cla-hy; n = 8 per group for Cla-dh and Cla-er) in cecum were analyzed by qPCR and qRT-PCR. **P < 0.01, *P < 0.05 vs. NC (Tukey–Kramer test). ##P < 0.01; #P < 0.05 vs. (−) (Tukey–Kramer test). (−)_HFD represents high-fat diet-fed mice. Results are presented as means ± SE. Source data are provided as a Source Data file 2
Fig. 3
Fig. 3
Gut microbial PUFA metabolites improve host metabolic conditions. Changes in a body weight and b representative macroscopic appearance and tissue weights (n = 14 per group). Scale bar; 1 cm. epi, epididymal; peri, perirenal; sub, subcutaneous. c Hematoxylin–eosin (H&E)–stained WAT and the mean area of adipocytes (n = 8 per group). Scale bar, 400 μm. d Daily food intake measured at 7 weeks of age (n = 5 per group). e ITT (n = 10 per group) and f GTT (n = 10 per group) were analyzed at 13–14 weeks of age. g Blood glucose (n = 14 per group), h total plasma cholesterol (n = 10, 9, and 10 per group), i triglyceride (n = 10 per group), j PYY (n = 10, 9, and 8 per group), k GLP-1 (n = 8, 9, and 9 per group), and l insulin (n = 7, 8, and 8 per group) levels were measured at the end of the experimental period. m Fecal triglyceride levels were measured at 16 weeks of age (n = 10 per group). **P < 0.01; *P < 0.05 vs. control (Tukey–Kramer test). ##P < 0.01; #P < 0.05 vs. HYA (Tukey–Kramer test). Results are presented as means ± SE. Source data are provided as a Source Data file 3
Fig. 4
Fig. 4
Gut microbial PUFA metabolites and adipose inflammatory response. a Heat map of FA profiles in the ileum (n = 4 per group). b HYA was detected in the ileum (left) and plasma (right) (n = 9 per group in the ileum; n = 9, 8, and 9 per group in the plasma). c Arachidonic acid (left) and PGE2 (right) were quantified in the ileum (n = 9 per group for arachidonic acid; n = 8, 9, and 9 per group for PGE2). d WAT sections were labeled by F4/80 (green), caveolin-1 (red), and DAPI (blue), and F4/80-positive cells were measured (n = 7 per group). Scale bar, 400 μm. e Levels of adipose PGE2 (n = 10 per group). f mRNA expression of F4/80, Tnfα, and Mcp1 in the WAT of HFD-induced obese mice (n = 10 per group). **P < 0.01; *P < 0.05 vs. control (Tukey–Kramer test). ##P < 0.01; #P < 0.05 vs. HYA (Tukey–Kramer test). Results are presented as means ± SE. Source data are provided as a Source Data file 4
Fig. 5
Fig. 5
HYA directly regulates glucose homeostasis and GLP-1 release. Individual FAs (HYA and LA; 1 g/kg) were administered by gavage, followed by a HYA quantification in plasma (left), ileum (center), and colon (right) (n = 8 animals). b Time-course changes in plasma GLP-1 from the tail vein was measured after oral administration of FAs (n = 7 animals per group). Basal GLP-1 concentration at time 0 was set as 100%. c OGTT was analyzed 2 h after individual FA administration (HYA and LA; 1 g/kg) by gavage (n = 8 animals per group). d Individual FAs were administered, and 2 h later, time-course changes in plasma insulin from the tail vein were measured after oral administration of glucose (n = 8 animals per group). **P < 0.01; *P < 0.05 vs. control (Tukey–Kramer test). ##P < 0.01; #P < 0.05 vs. HYA (Tukey–Kramer test). Results are presented as means ± SE. e STC-1 cells were treated with LA-derived gut microbial metabolites [in a dose-dependent manner (20, 100, and 200 μM)], and GLP-1 concentration was measured in culture medium (n = 6 independent cultures from three biological replicates). **P < 0.01; *P < 0.05 vs. None (Tukey–Kramer test). f LA-derived gut microbial metabolites were detected in plasma of NC-fed mice (n = 8 animals). Results are presented as means ± SE. Source data are provided as a Source Data file 5
Fig. 6
Fig. 6
HYA contributes to host metabolic condition via GPR40 and GPR120. Mobilization of [Ca2+]i induced by LA-derived gut microbial metabolites was monitored in Flp in a hGPR40 or b hGPR120 T-REx HEK293 cells. Data are presented as Ca2+ intensity. Cells were cultured for 24 h and then treated with or without 10 μg/mL doxycycline (n = 8 independent cultures with doxycycline from three biological replicates; n = 6 independent cultures without doxycycline from two biological replicates). Closed symbols represent values from cells treated with doxycycline, and open symbols denote untreated groups. cf The inhibitory effects of c Gpr40 and Gpr120 siRNA, d MEK inhibitor (U0126), e PLC inhibitor (U73122), and f CaMKII inhibitor (KN-62) on GLP-1 secretion following LA, HYA, or HYB treatment (n = 4 independent cultures from two biological replicates). **P < 0.01 vs. None (Tukey–Kramer test). ##P < 0.01; #P < 0.05 vs. LA (Tukey–Kramer test). $$P < 0.01 vs. HYA (Tukey–Kramer test). (−) represents untreated cells with siRNA or antagonist. Results are presented as means ± SE. g GLP-1 concentration and h OGTT in wild-type (left, n = 10 animals per group), Gpr40-deficient (middle, n = 8 animals per group), and Gpr120-deficient (right, n = 9, 10, and 9 animals per group) mice were analyzed 2 h after FA administration. **P < 0.01 vs. Control (Tukey–Kramer test). #P < 0.05 vs. LA (Tukey–Kramer test). (−) represents the mice without FA administrations. Results are presented as means ± SE. Source data are provided as a Source Data file 6
Fig. 7
Fig. 7
HYA-producing Lactobacillus contributes to host metabolic improvement. Changes in a body weight (n = 10, 10, and 8 per group) and b tissue weight (n = 10 per group) at 16 weeks of age were measured in GF and gnotobiotic mice suffering from HFD-induced obesity. Scale bar; 1 cm. epi, epididymal; peri, perirenal; sub, subcutaneous. c Blood glucose (n = 8, 9, and 9 per group), d total plasma cholesterol (n = 8, 7, and 7 per group), e triglyceride (n = 9, 9, and 10 per group), f GLP-1 (n = 8 per group), and g insulin (n = 7 per group) levels were measured at the end of the experimental period. h mRNA expression of Tnfα in the WAT of HFD-induced obesity (n = 8 per group). i Fecal triglyceride levels were measured at 16 weeks of age (n = 10 per group). j After colonization of lactic acid bacteria for 1 week, OGTT was assessed (n = 7 per group). **P < 0.01; *P < 0.05 vs. GF mice (Tukey–Kramer test). ##P < 0.01; #P < 0.05 vs. HYA ( + ) (Tukey–Kramer test). k Cecal HYA was quantified in GF and gnotobiotic mice at 16 weeks of age (n = 9, 10, 10, and 7 per group). Results are presented as means ± SE. Source data are provided as a Source Data file 7
Fig. 8
Fig. 8
Schematic representation. The mechanism by which gut microbial metabolism of dietary PUFAs confers host resistance to obesity

References

    1. Kahn SE, Hull RL, Utzschneider KM. Mechanisms linking obesity to insulin resistance and type 2 diabetes. Nature. 2006;444:840–846. doi: 10.1038/nature05482. - DOI - PubMed
    1. Turnbaugh PJ, et al. Diet-induced obesity is linked to marked but reversible alterations in the mouse distal gut microbiome. Cell Host Microbe. 2008;3:213–223. doi: 10.1016/j.chom.2008.02.015. - DOI - PMC - PubMed
    1. Ley RE, et al. Microbial ecology: human gut microbes associated with obesity. Nature. 2006;444:1022–1023. doi: 10.1038/4441022a. - DOI - PubMed
    1. Turnbaugh PJ, Bäckhed F, Fulton L, Gordon JI. A core gut microbiome in obese and lean twins. Nature. 2009;457:480–484. doi: 10.1038/nature07540. - DOI - PMC - PubMed
    1. Dalby MJ, Ross AW, Walker AW, Morgan PJ. Dietary uncoupling of gut microbiota and energy harvesting from obesity and glucose tolerance in mice. Cell Rep. 2017;21:1521–1533. doi: 10.1016/j.celrep.2017.10.056. - DOI - PMC - PubMed

Publication types

MeSH terms