. 2019 Jul 25;8(1):1643671.
doi: 10.1080/20013078.2019.1643671. eCollection 2019.

Refractive index to evaluate staining specificity of extracellular vesicles by flow cytometry

Affiliations

Refractive index to evaluate staining specificity of extracellular vesicles by flow cytometry

L de Rond et al. J Extracell Vesicles. .

Abstract

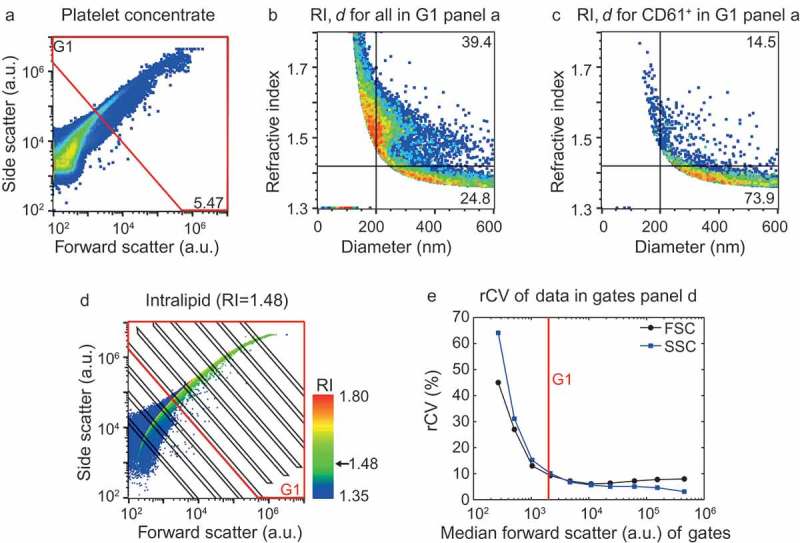
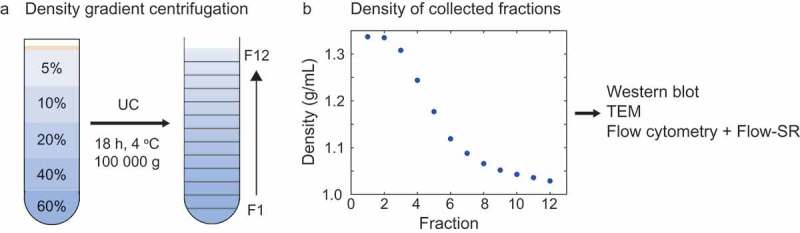
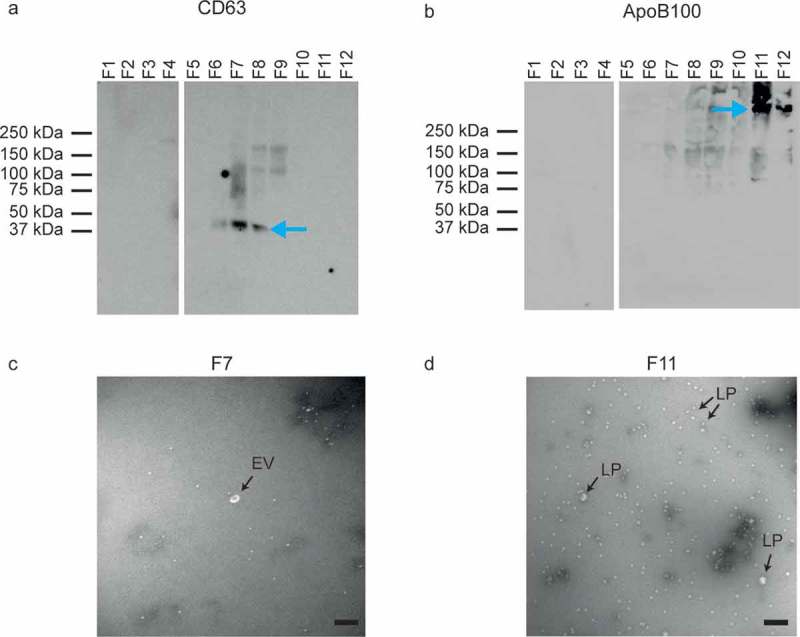
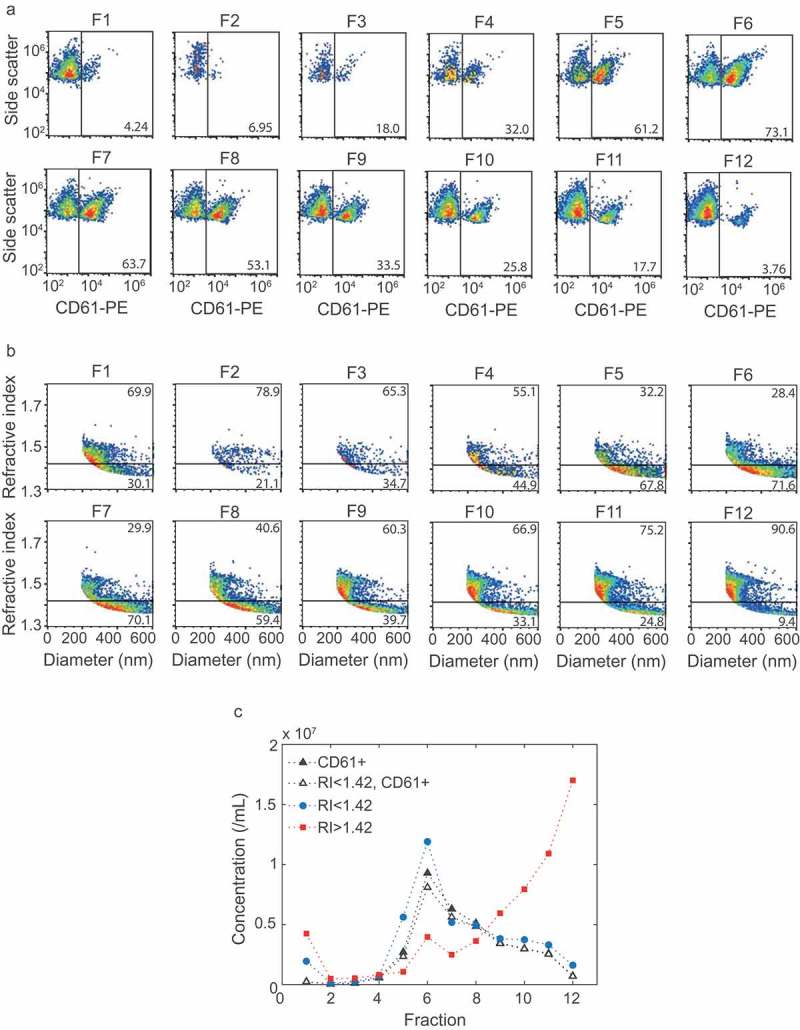
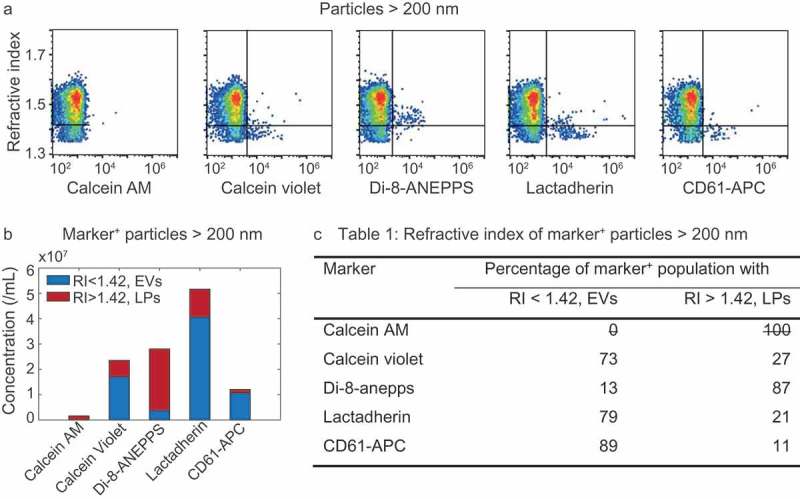
Extracellular vesicles (EVs) in plasma are commonly identified by staining with antibodies and generic dyes, but the specificity of antibodies and dyes to stain EVs is often unknown. Previously, we showed that platelet-depleted platelet concentrate contains two populations of particles >200 nm, one population with a refractive index (RI) < 1.42 that included the majority of EVs, and a second population with an RI > 1.42, which was thought to include lipoproteins. In this study, we investigated whether EVs can be distinguished from lipoproteins by the RI and whether the RI can be used to determine the specificity of antibodies and generic dyes used to stain plasma EVs. EVs and lipoproteins present in platelet-depleted platelet concentrate were separated by density gradient centrifugation. The density fractions were analyzed by Western blot and transmission electron microscopy, the RI of particles was determined by Flow-SR. The RI was used to evaluate the staining specificity of an antibody against platelet glycoprotein IIIa (CD61) and the commonly used generic dyes calcein AM, calcein violet, di-8-ANEPPS, and lactadherin in plasma. After density gradient centrifugation, EV-enriched fractions (1.12 to 1.07 g/mL) contained the highest concentration of particles with an RI < 1.42, and the lipoprotein-enriched fractions (1.04 to 1.03 g/mL) contained the highest concentration of particles with an RI > 1.42. Application of the RI showed that CD61-APC had the highest staining specificity for EVs, followed by lactadherin and calcein violet. Di-8-ANEPPS stained mainly lipoproteins and calcein AM stained neither lipoproteins nor EVs. Taken together, the RI can be used to distinguish EVs and lipoproteins, and thus allows evaluation of the specificity of antibodies and generic dyes to stain EVs.

Keywords: Exosomes; extracellular vesicles (EVs); flow cytometry; light scattering; microparticle; specificity.


Figures

Figure 1.
Figure 1.
Application of the flow cytometry scatter ratio (Flow-SR) to platelet-depleted platelet concentrate. (a) Side (SSC) versus forward scatter (FSC) plot of platelet-depleted platelet concentrate as measured by the A60-micro. (b) Refractive index (RI) versus diameter (d) plot of the events in G1 of panel a. The horizontal line indicates an RI of 1.42, the vertical line a d of 200 nm. (c) Refractive index versus diameter (d) plot of all CD61+ particles in G1 of panel a. Of all CD61+ particles >200 nm, 73.9% has an RI<1.42. (d) SSC versus FSC of intralipid (Fresenius-Kabi, Germany) which contains polydisperse particles with an RI of 1.48. The colour bar indicates the RI of the particle as derived using Flow-SR. Deviations from 1.48 are most likely due to a decrease in the signal-to-noise ratio on SSC and FSC. To quantify the relative noise, the robust coefficient of variation (rCV) on FSC and SSC was determined within the gates (black lines). (e) rCV versus median FSC intensity in the gate for FSC (black circles) and SSC (blue squares). An rCV of 10% on FSC and SSC was considered acceptable, which was found at a median FSC intensity in the gate of 2000 a.u. (red line). The resulting gate G1 (red lines) is shown in a and d and used throughout the manuscript.
Figure 2.
Figure 2.
Density gradient centrifugation to separate EVs and lipoproteins in platelet-depleted platelet concentrate. (a) Schematic representation of the Optiprep density gradient and fraction collection. The platelet-depleted platelet concentrate is loaded on top of the density gradient. (b) Density of the collected fractions as derived from 340 nm absorbance. UC: ultracentrifugation, TEM: transmission electron microscopy.
Figure 3.
Figure 3.
Analysis of EV- and lipoprotein-enriched fractions by Western blot and transmission electron microscopy (TEM). (a) Western blot for the EV-associated CD63. EVs are present in fractions (F) 6, 7 and 8. (b) Western blot for the lipoprotein-associated ApoB100. Lipoproteins are present in fractions 11 and 12. (c) TEM image of EV-enriched fraction 7. Possibly the white spherical particles are a few lipoproteins. (d) TEM image of lipoprotein-enriched fraction 11. The majority of the particles are lipoproteins (LP), but a few may be EVs. All scale bars represent 200 nm.
Figure 4.
Figure 4.
Flow cytometry and Flow-SR results for all fractions. (a) Side scatter versus CD61-PE fluorescence of particles >200 nm for all fractions. (b) Refractive index (RI) versus diameter of particles >200 nm for all fractions. The horizontal line indicates an RI of 1.42. (c) Concentration of CD61+ particles (closed black triangles), CD61+ particles with an RI < 1.42 (open black triangles), particles with an RI < 1.42 (blue circles) and RI > 1.42 (red squares) for each fraction. Fractions 6, 7 and 8 show the highest concentration of RI < 1.42 and RI < 1.42, CD61+ particles. The concentration of RI > 1.42 particles, here found to be lipoproteins, increases with fraction number. The highest concentrations of lipoproteins were found at fraction 11 and 12. Representative data of one out of three independently performed experiments are shown.
Figure 5.
Figure 5.
Refractive index (RI) of particles >200 nm stained with calcein AM, calcein violet, di-8-ANEPPS, lactadherin, and CD61-APC in platelet-free plasma. (a) RI versus marker fluorescence for particles >200 nm. The horizontal line indicates an RI of 1.42 and separates lipoproteins (LPs; top right quadrant) from EVs (bottom right quadrant). (b) Concentrations of stained (i.e. marker+) EVs (blue) and LPs (red) for the indicated fluorescent marker. (c) Percentage of marker+ particles with an RI typical for EVs and LPs for the indicated fluorescent marker. Representative data of 1 out of 2 measurements shown.
Figure A1.
Figure A1.
Flow cytometry isotype and buffer + reagent controls. (a) Side scatter versus IgG1-PE fluorescence of particles >200 nm for all fractions. (b) left panel: side versus CD61-PE fluorescence of particles >200 nm in a sample containing buffer (phosphate-buffered saline) and CD61-PE, right panel: side versus IgG1-PE fluorescence of particles >200 nm in a sample containing buffer and IgG1-PE.

References

    1. O’Driscoll L. Expanding on exosomes and ectosomes in cancer. N Engl J Med. 2015;372:2359–10. - PubMed
    1. Loyer X, Vion A-C, Tedgui A, et al. Microvesicles as cell–cell messengers in cardiovascular diseases. Circ Res. 2014;114:345–353. - PubMed
    1. Yuana Y, Sturk A, Nieuwland R. Extracellular vesicles in physiological and pathological conditions. Blood Rev. 2013;27:31–39. - PubMed
    1. Robbins PD, Morelli AE. Regulation of immune responses by extracellular vesicles. Nat Rev Immunol. 2014;14:195–208. - PMC - PubMed
    1. Coumans FAW, Brisson AR, Buzas EI, et al. Methodological guidelines to study extracellular vesicles. Circ Res. 2017;120:1632–1648. - PubMed