. 2019 Feb;1(2):276-290.
doi: 10.1038/s42255-018-0023-6. Epub 2019 Jan 14.

MANF regulates metabolic and immune homeostasis in ageing and protects against liver damage

Affiliations

MANF regulates metabolic and immune homeostasis in ageing and protects against liver damage

Pedro Sousa-Victor et al. Nat Metab. 2019 Feb.

Abstract

Aging is accompanied by altered intercellular communication, deregulated metabolic function, and inflammation. Interventions that restore a youthful state delay or reverse these processes, prompting the search for systemic regulators of metabolic and immune homeostasis. Here we identify MANF, a secreted stress-response protein with immune modulatory properties, as an evolutionarily conserved regulator of systemic and in particular liver metabolic homeostasis. We show that MANF levels decline with age in flies, mice and humans, and MANF overexpression extends lifespan in flies. MANF deficient flies exhibit enhanced inflammation and shorter lifespans, and MANF heterozygous mice exhibit inflammatory phenotypes in various tissues, as well as progressive liver damage, fibrosis, and steatosis. We show that immune cell-derived MANF protects against liver inflammation and fibrosis, while hepatocyte-derived MANF prevents hepatosteatosis. Liver rejuvenation by heterochronic parabiosis in mice further depends on MANF, while MANF supplementation ameliorates several hallmarks of liver aging, prevents hepatosteatosis induced by diet, and improves age-related metabolic dysfunction. Our findings identify MANF as a systemic regulator of homeostasis in young animals, suggesting a therapeutic application for MANF in age-related metabolic diseases.


Figures
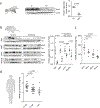
Figure 1.
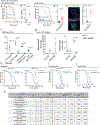
Figure 1.. MANF protein levels decline with age in flies, mice and humans.
a, Western blot analysis of MANF levels in protein extracts of WT (W1118) whole flies, 7 and 50 days old. Quantification of relative average levels of MANF, normalized to actin levels, are represented (n=3 samples/age, 5 flies/sample). b, Western blot analysis of MANF levels in protein extracts from different tissues of 4 month old and 20 month old WT (C57BL/6JN) mice. Quantification of relative average levels of MANF, normalized to tubulin levels, are represented for each tissue at each age (n=5/condition). c, MANF protein levels in plasma of WT (C57BL/6JN) mice (n=5, 10mo; n=6, 25mo; n=8, 5mo and 20mo), quantified by ELISA. d, MANF protein levels in human serum (n=24, age 21–40; n=26, age 41–69, n=10 age >60), quantified by ELISA. Data are represented as average ± s.e.m and each n represents one animal/human subject. In a and b, p values are from two-tailed Student’s t-test. In c and d, p values are from one-way ANOVA with Dunnett’s multiple comparison post-test. Full blots for a and b can be found in Supplementary Figure 11.
Figure 2.
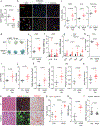
Figure 2.. MANF overexpression extends lifespan in Drosophila
a,c, Demographics of flies expressing MANF-RNAi under the control of ubiquitous (Act5c::GS, a) or hemocyte specific (HmlΔ::Gal4, c) drivers. All flies are female and fly numbers (n) are indicated for each genotype or treatment. b,d, Quantification of mitotic figures (pH3+ cells) in midguts of flies expressing MANF-RNAi under the control of ubiquitous (b, Act5c::GS: n=8 guts, (−); n=10 guts, +RU) or hemocyte specific (d, HmlΔ::Gal4,=: n=33 guts, UAS::Dicer; n=36 guts, UAS::Dicer,UAS::MANFRNAi) drivers for 14 days and 7 days, respectively. e, Representative images showing GFP expression driven by a STAT reporter in midguts of flies expressing MANF-RNAi under the control of a hemocyte specific driver (HmlΔ::Gal4) for 7 days. Scale bar: 20μm. Quantification of average GFP-intensity/midgut is shown (n=4 guts, UAS::Dicer; n=6 guts, UAS::Dicer,UAS::MANFRNAi). f, Quantification of mitotic figures (pH3+ cells) in midguts of 35 day old flies overexpressing MANF under the control of different drivers (n=5 guts, w1118: PPL::Gal4; n=6 guts, w1118: C7::Gal4 and Hml::Gal4 and UAS::MANF: PPL::Gal4; n=7 guts, w1118: NP1::Gal4 and UAS::MANF: C7::Gal4 and NP1::Gal4; n=8 guts, UAS::MANF: Hml::Gal4). g, Relative levels of MANF and Upd3 transcripts, quantified by RT-qPCR, in midguts of 35 day old flies overexpressing MANF in enterocytes (n=3/age and genotype, each n represents a pool of 8 guts). h-j, Demographics of flies overexpressing MANF in fatbody (PPL::Gal4 and LSP2::Gal4, h), hemocytes (HmlΔ::Gal4, i) or in tissues that express Upd3 (Upd3::Gal4, j). All flies are female and fly numbers (n) are indicated for each genotype. k, Statistical analysis of lifespan experiments in a,c,h,i,j. N represents the number of independent populations pooled in each lifespan graph. The number of animals (n) used to generate each lifespan graph, and for statistical analysis, are indicated in the corresponding graph. For b,d,e,f,g data are represented as average ± s.e.m. and p values are from two-tailed Student’s t-test.
Figure 3.
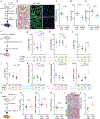
Figure 3.. Mice with reduced MANF levels develop inflammation and liver damage.
a, MANF protein levels in plasma of 5 month old MANFHet mice or WT littermates (n=9/condition). b, Representative images from 10 month old MANFHet mice, or WT littermates, immunostained against F4/80 (green) and CD68 (red). Scale bars: WAT, 200μm, 50μm inset; liver and pancreas, 100μm, 25μm inset. Quantifications of these stainings, for independent animals, are shown in Fig. 3c and Supplementary Fig. 2c. c, Quantification of the average number of activated macrophages in 10 month old MANFHet mice, or WT littermates (vWAT: n=6, WT, n=10, MANFHet; Liver: n=6, WT, n=9, MANFHet; Pancreas: n=5, WT, n=8, MANFHet). d, SA-βGal staining in vWAT of 10 month old MANFHet mice, or WT littermates. These observations were reproduced in two sets of animals with a total n=9/WT and n=10/MANFHet mice. e-g, Quantification of 4-HNE adducts in protein extracts from vWAT (e, n=8, WT; n=10, MANFHet) and relative expression, quantified by RT-qPCR, in vWAT (f, n=15, WT; n=22, MANFHet) or livers (g, n=9, WT; n=14, MANFHet) of 10 month old MANFHet mice, or WT littermates. h-m, Quantification of the average %Ym1+ cells (h), the average number of p-JNK+ cells (i), γH2Ax+ cells (j), TUNEL+ hepatocytes (k), cleaved-caspase3+ hepatocytes (l) and nuclear area (m) in livers of 10 month old MANFHet mice, or WT littermates (n=5, WT; n=9, MANFHet, see Supplementary Fig. 2e,l for representative images). n, Collagen deposition in livers of 10 month old MANFHet mice and WT littermates, quantified as the percentage of area occupied by Sirius Red stain (n=13, WT; n=16, MANFHet, see Supplementary Fig. 2m for representative images). o, Representative images stained with hematoxylin and eosin (H&E, left), immunostained against MANF (red) and co-stained with Bodipy (green, middle), or stained with OilRedO (right), from livers of 10 month old MANFHet mice, or WT littermates. Scale bars: 50μm. Quantifications of these stainings, for independent animals, are shown in Fig. 3q and Supplementary Fig. 4d. p,q, Fat content in livers of MANFHet mice and WT littermates, quantified as triglyceride content (p) or as the percentage of area occupied by OilRedO stain (q). 5mo: n=6, WT; n=7, MANFHet; 10mo: n=5, WT; n=9, MANFHet. r, MANF protein levels in human serum from NASH patients (n=18) and non-diseased age-matched subjects (ND, n=20). Data are represented as average ± s.e.m. and each n represents one animal. In a,c,e-n,q,r, p values are from two-tailed Student’s t-test. In p, p values are from one-way ANOVA with Bonferroni’s multiple comparison post-test.
Figure 4.
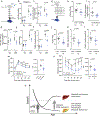
Figure 4.. Immune cell-derived MANF and hepatocyte-derived MANF contribute to liver homeostasis.
a, Experimental timeline for analysis of animals fed HFD for 6 weeks after receiving hydrodynamic tail vein (HTV) injections of plasmids expressing hMANF. b, Representative images of cryosections from livers of 4 month old WT (C57BL/6JN) mice fed HFD for 6 weeks after receiving hMANF HTV injections, stained with OilRedO (left), Bodipy (middle), or immunostained against F4/80 (green, right) and CD68 (red, right). DAPI is used to identify nuclei. Scale bars: 50μm. Quantifications of these stainings, for independent animals, are shown in Fig. 4c,e and Supplementary Fig. 5e. c-e, Quantification of fat content, as the percentage of area occupied by OilRedO stain (c), triglyceride content (d) and the average number of activated macrophages as the %CD68+ cells within the F4/80+ population (e) in livers of 4 month old WT mice fed HFD for 6 weeks after receiving hMANF HTV injections (n=5, Cntrl-HTV; n=6, hMANF-HTV). f, Experimental timeline for analysis of animals with conditional ablation of MANF in Cx3cr1-expressing monocytes/macrophages. g-m, Quantification of the average number of activated macrophages as the %CD68+ cells within the F4/80+ population (g), %Ym1+ cells within the F4/80+ population (h), p-JNK+ cells (i), γH2Ax+ cells (j), TUNEL+ hepatocytes (k), cleaved caspase3+ hepatocytes (l) and collagen deposition, as the percentage of area occupied by Sirius Red stain (m) in livers of Cx3cr1CRE-ER/+,MANFfl/fl mice, 12 weeks after tamoxifen treatment (n=6, CreER +Tam; n=7, Manffl/fl +Tam; n=8, CreER/Manffl/fl +Veh.; n=9, CreER/Manffl/fl +Tam, see Supplementary Fig. 5g for representative images for each condition). n, Experimental timeline for analysis of animals with conditional ablation of MANF in hepatocytes. o-q,s, Quantification of the average number of activated macrophages as the %CD68+ cells within the F4/80+ population (o), TUNEL+ hepatocytes (p), collagen deposition, as the percentage of area occupied by Sirius Red stain (q) and fat content, as the percentage of area occupied by OilRedO stain (s), in livers of MANFfl/fl mice, 6 weeks after injection with AAV-TBGi-Cre (n=6, TBG-eGFP; n=5, TBG-iCre). r, Representative images of cryosections from livers of MANFfl/fl mice, 6 weeks after injection with AAV-TBGi-Cre, stained with OilRedO. Scale bar: 50μm. Quantifications of these stainings, for independent animals, are shown in Fig. 4s. Data are represented as average ± s.e.m. and each n represents one animal. In c-e,o-q,s, p values are from two-tailed Student’s t-test. In g-m, p values are from one-way ANOVA with Dunnett’s multiple comparison post-test.
Figure 5.
Figure 5.. MANF is required for full liver rejuvenation by heterochronic parabiosis.
a, Experimental setup for the mouse pairs used in the heterochronic parabiosis experiment. In b-i animals from O-O pairs are represented in black, animals from O-YgWT pairs are represented in grey and animals from O-YgHet pairs are represented in red. b, Representative images of Masson’s trichrome stain in paraffin sections (Scale bar: 50μm) and Sirius Red stain in cryosections (Scale bar: 200μm) from livers of old animals of each parabiosis pair type. Arrowheads indicate collagen deposition. Quantifications of these stainings, for independent animals, are shown in Fig. 5c. c-h, Quantification of collagen deposition, as the percentage of area occupied by Sirius Red stain (c), the average number of p-JNK+ cells (d), γH2Ax+ cells (e), TUNEL+ hepatocytes (f), cleaved caspase3+ hepatocytes (g) and activated macrophages, as the %CD68+ cells within the F4/80+ population (h) in livers of young and old animals from each parabiosis pair type (n=5, O-Yg Het; n=6, O-O and O-Yg WT, see Supplementary Fig. 6b for representative images for each condition). i, Relative levels of IL-6 transcripts, quantified by RT-qPCR, in livers of young and old animals from each parabiosis pair type (n=5, O-O; n=6, O-Yg Het; n=7, O-Yg WT). j, Pie chart representing the percentage of genes affected by aging in the liver (left pie chart) rejuvenated by heterochronic parabiosis (blue on left pie chart and whole pie chart on right) in a MANF-dependent manner (red on right pie chart), n=5/condition. See also Supplementary Fig. 6h. k, Graph showing significantly enriched KEGG pathways in the dataset of liver genes affected by aging and rejuvenated by heterochronic parabiosis in a MANF-dependent manner, n=5/condition. Percentage of genes in the dataset belonging to each KEGG pathway is indicated. See also Supplementary Fig. 6i. Data are represented as average ± s.e.m. and each n represents one animal. In c-i, p values are from one-way ANOVA with Dunnett’s multiple comparison post-test. In k, p values are from Fisher Exact test.
Figure 6.
Figure 6.. MANF improves liver damage, inflammation and metabolic dysfunction in old mice.
a, Experimental timeline for analysis of young and old animals, after receiving HTV injections of plasmids expressing hMANF. b,e,f, Quantification of the average number of activated macrophages as the %CD68+ cells within the F4/80+ population (b), p-JNK+ cells (e) and TUNEL+ hepatocytes (f) in livers of young and old WT mice, 5 weeks after receiving hMANF HTV injections (n=7, Cntrl-HTV, n=6, hMANF-HTV, see Supplementary Fig. 7c,e for representative images for each condition). c,d, IL-6 (c) and IFNγ (d) levels in protein samples from livers of young and old WT mice, 5 weeks after receiving hMANF HTV injections, quantified by ELISA (n=6/condition). g, Experimental timeline for analysis of old animals, after 5 weeks treatment with hrMANF protein intra peritoneal injections. h,j-l, Quantification of the average number of activated macrophages as the %CD68+ cells within the F4/80+ population (h), γH2Ax+ cells (j), TUNEL+ hepatocytes (k) and cleaved caspase3+ hepatocytes (l) in livers of old WT mice, 5 weeks after receiving hrMANF i.p injections (n=13, Cntrl. i.p.; n=14, hrMANF i.p., see Supplementary Fig. 8c for representative images for each condition). i, IL-6 levels in protein samples from livers of old WT mice, 5 weeks after receiving hrMANF i.p injections, quantified by ELISA (n=13, Cntrl. i.p.; n=14, hrMANF i.p.). m, Glucose tolerance test of young and old WT mice, 4 weeks after receiving hMANF HTV injections. Graph represents average glucose levels in blood at the designated times after i.p. injections of glucose. p values shown are for differences between hMANF and control injections in old animals at the designated time points (n=7/condition). Graph to the right represents the average area under the curve (AUC) for each condition. n, Insulin tolerance test of old WT mice, 5 weeks after receiving hrMANF i.p. injections. Graph represents average glucose levels in blood at the designated times after i.p. injections of insulin. p values shown are for differences between hrMANF and control injections in old animals at the designated time points (n=7/condition). Graph to the right represents the average area under the curve (AUC) for each condition. o, Proposed model for the anti-geronic function of MANF. Data are represented as average ± s.e.m. and each n represents one animal. p values are from two-tailed Student’s t-test.

References

    1. Lopez-Otin C, Blasco MA, Partridge L, Serrano M & Kroemer G The hallmarks of aging. Cell 153, 1194–1217 (2013). - PMC - PubMed
    1. Franceschi C, et al. Inflamm-aging. An evolutionary perspective on immunosenescence. Annals of the New York Academy of Sciences 908, 244–254 (2000). - PubMed
    1. Villeda SA, et al. The ageing systemic milieu negatively regulates neurogenesis and cognitive function. Nature 477, 90–94 (2011). - PMC - PubMed
    1. Smith LK, et al. beta2-microglobulin is a systemic pro-aging factor that impairs cognitive function and neurogenesis. Nature medicine 21, 932–937 (2015). - PMC - PubMed
    1. Conboy IM, et al. Rejuvenation of aged progenitor cells by exposure to a young systemic environment. Nature 433, 760–764 (2005). - PubMed

Publication types