. 2019 Sep 6;11(9):2127.
doi: 10.3390/nu11092127.

Dietary Fat-Accelerating Leptin Signaling Promotes Protumorigenic Gastric Environment in Mice

Affiliations

Dietary Fat-Accelerating Leptin Signaling Promotes Protumorigenic Gastric Environment in Mice

Seiya Arita et al. Nutrients. .

Abstract

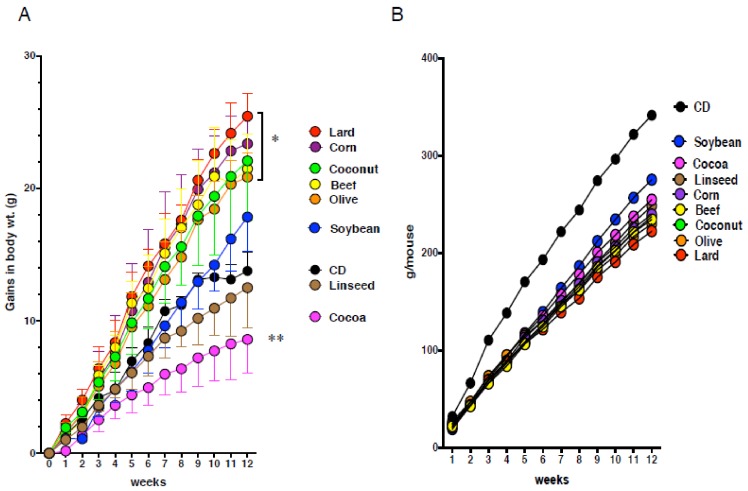
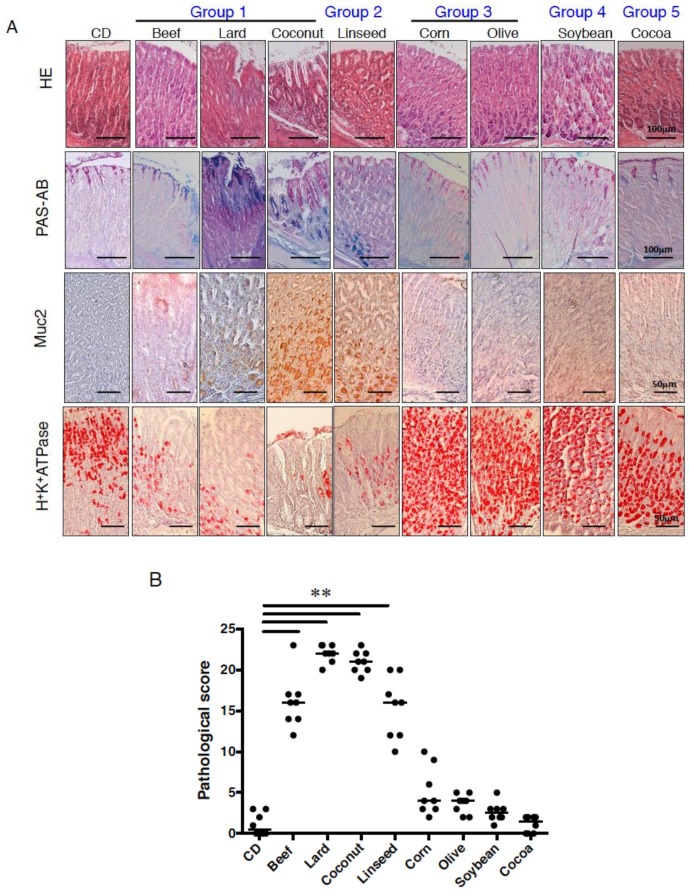
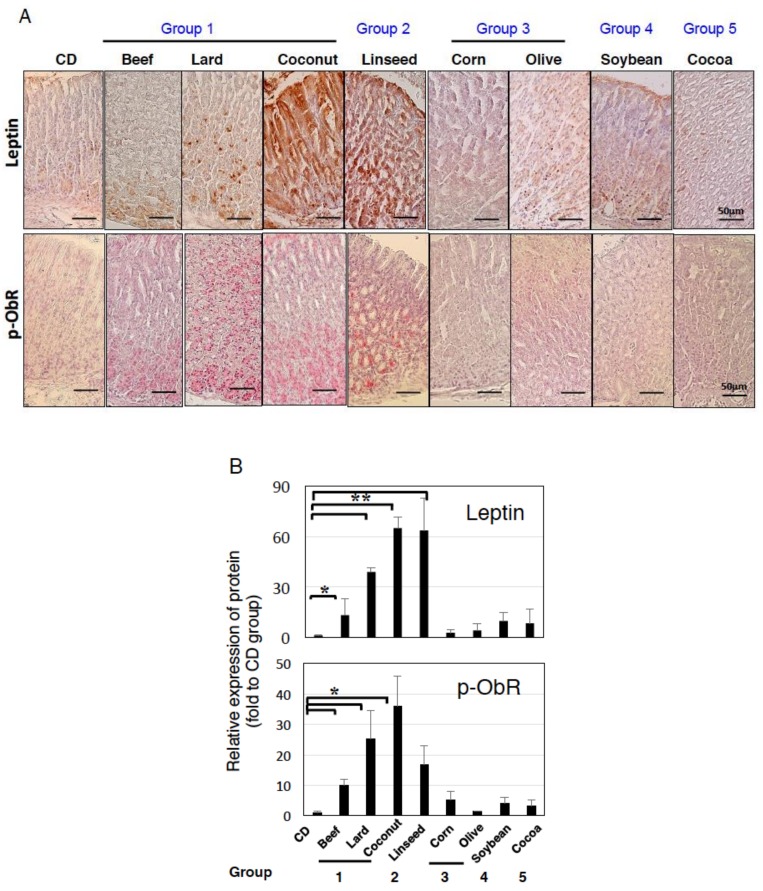
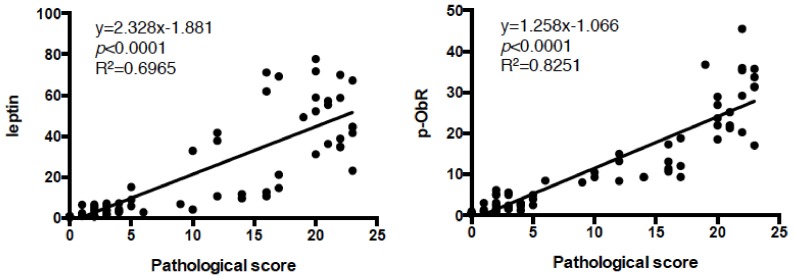
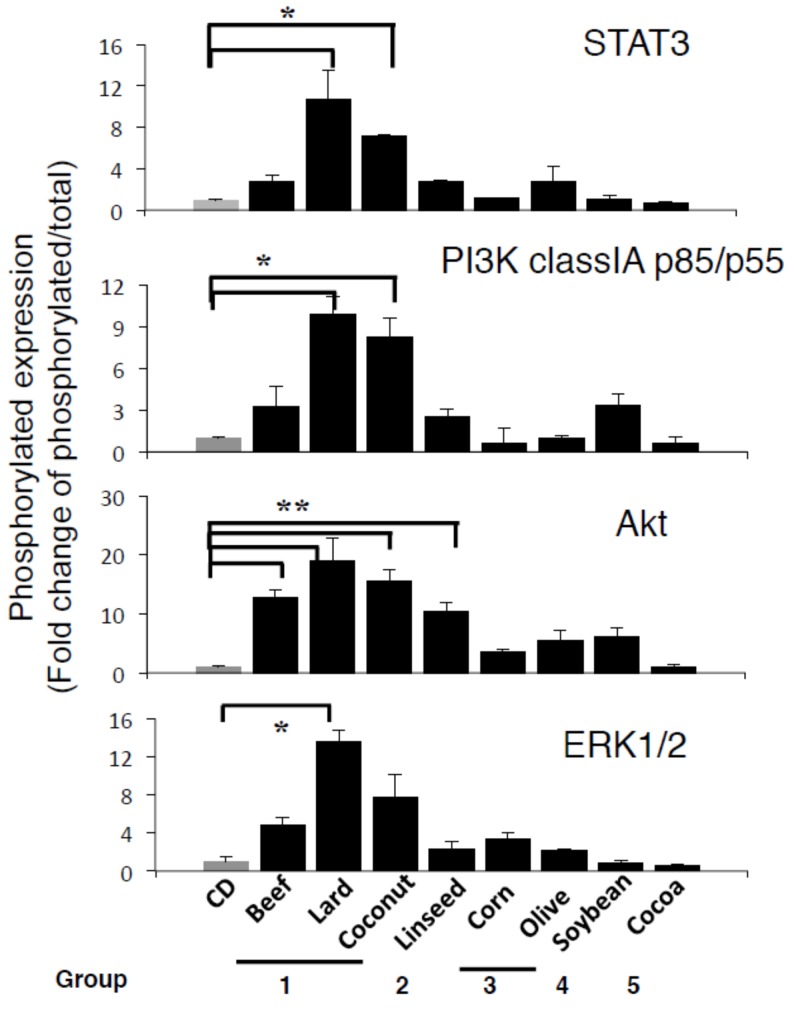
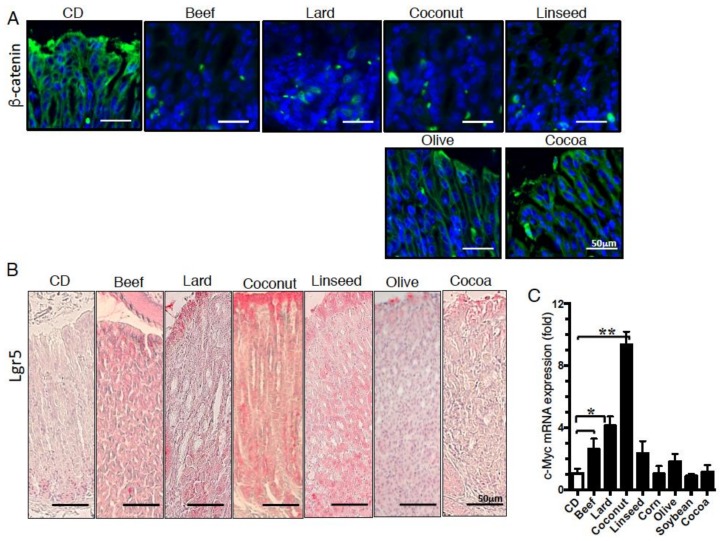
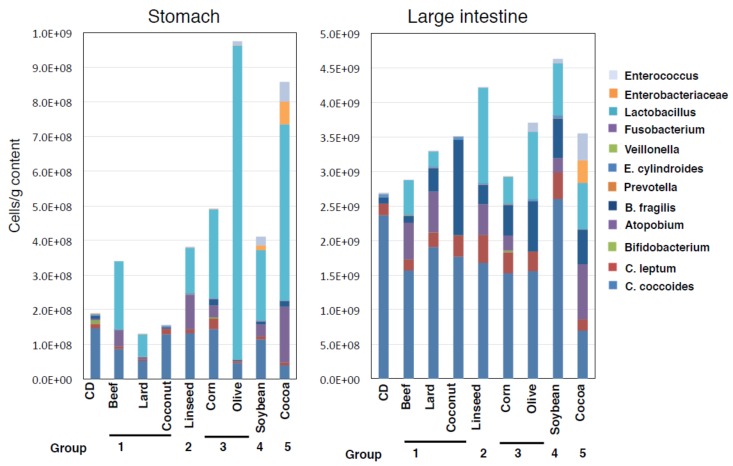
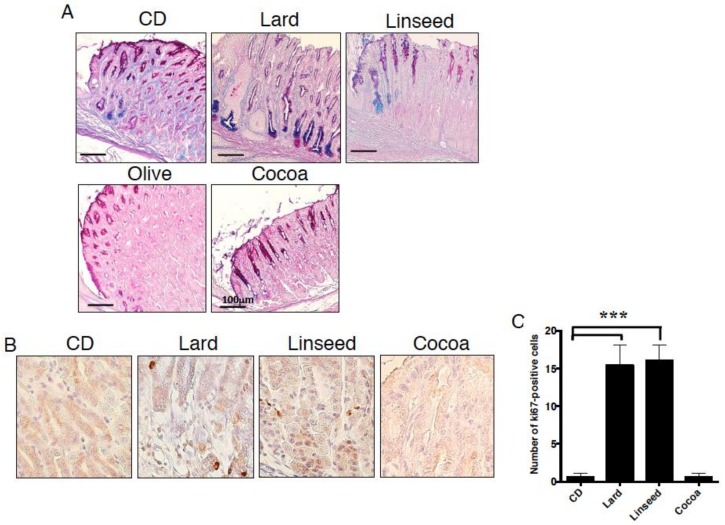
Excess of fat intake leads to obesity and causes a variety of metabolic diseases and cancer. We previously demonstrated that high-lard diet induces intestinal metaplasia, a precancerous lesion of the stomach mediated by leptin signaling. This study aims to investigate which kinds of dietary fat cause the intestinal metaplasia onset. We fed eight kinds of high-fat diets (HFDs) of animal or plant origin to mice evaluated their effect on gastric pathogenesis. Five types of dietary fat were divided according to their observed effects: Obese with high metaplasia (group I; beef tallow, lard, and hydrogenated coconut oil), non-obese with high metaplasia (group II; linseed oil), obese without metaplasia (group III; corn oil and olive oil), non-obese without metaplasia (group IV, soybean oil) and lean without metaplasia (group V; cocoa butter). The group I and II diets induced leptin, phosphorylated leptin receptor (ObR), signal transducer and activator 3 (STAT3), and increased intracellular β-catenin accumulation in the stomach. Moreover, mice fed these HFDs with 1-methyl-3-nitro-1-nitrosoguanidine (MNNG), a gastric carcinogen, and further accelerated dysplasia in the stomach. Lactobacillus occupancy in the stomach increased in all HFDs except hydrogenated coconut oil. Our findings suggest that HFDs inducing leptin signaling accelerate the enhancement of protumorigenic gastric microenvironment independent of body mass gain or microbiome changes.

Keywords: high-fat; leptin; microbiota; protumorigenesis; stomach.


Conflict of interest statement

The authors declare no conflict of interest.

Figures

Figure 1
Figure 1
Alteration of body weight and food intake of C57BL/6J mice fed eight kinds of high-fat diets (HFDs). (A) Gains in body weight and (B) food intake of mice fed control (CD), beef tallow (Beef), Lard, hydrogenated coconut (Coconut), linseed oil (Linseed), corn oil (Corn), olive oil (Olive), soybean oil (Soybean), and cocoa butter (Cocoa) in C57BL/6J mice for 12 weeks. Data, shown as mean ± SD were analyzed by the one-way ANOVA followed by Holm-Sidak post-hoc test for multiple comparisons. * p < 0.01, ** p < 0.001 for HFDs versus CD. Eight mice per group were used.
Figure 2
Figure 2
Pathological feature of gastric mucosa owing to various HFDs. (A) Gastric sections stained for periodic-acid Schiff (PAS)-Alcian blue, Muc2, and H+K+ATPase in mice fed experimental diets for 12 weeks. We utilized eight mice in each analysis, and representative data are shown. (B) The histological scores from the stomachs of mice fed CD or HFDs were graded according to the diagnostic criteria described in the Methods. Data presented as medians (99.9% confidence intervals) were analyzed by the one-way ANOVA followed by Holm-Sidak post-hoc test for multiple comparisons. ** p < 0.001. Eight mice per group were used.
Figure 3
Figure 3
Difference of leptin and phosphorylated ObR expression in the stomach owing to HFDs feeding. (A) Gastric sections stained for leptin and phosphorylated ObR in mice fed experimental diets for 12 weeks. (B) Quantification of leptin and p-ObR expression shown in Figure 3 was performed by using ImageJ software described in the Materials and Methods. Data, shown as mean ± SD of eight mice were analyzed by the one-way ANOVA followed by Holm-Sidak post-hoc test for multiple comparisons. * p < 0.05, ** p < 0.001.
Figure 4
Figure 4
Highly correlation between pathogenesis and expression of leptin or p-ObR in the gastric mucosa of HFD-fed mice. Pearson correlation was performed for pathological score shown in Figure 2B and leptin or p-ObR expression shown in Figure 3B, and a significant correlation (p < 0.0001) was obtained.
Figure 5
Figure 5
Upregulation of leptin receptor signaling in the gastric mucosa of group 1-type HFD-fed wild-type (WT) mice. Gastric sections stained for the phosphorylated STAT3, PI3K class I p85/p55, Akt, and ERK1/2, and total STAT3, PI3K class I p85/p55, Akt, and ERK2 in the gastric mucosa of WT fed for 12 weeks. Quantification of each expression level was performed by using ImageJ software described in the Methods. Data, shown as mean ± SD of eight mice were analyzed by the one-way ANOVA followed by Holm-Sidak post-hoc test for multiple comparisons. * p < 0.05, ** p < 0.01.
Figure 6
Figure 6
Difference in the intracellular and nuclear localization of β-catenin and the expression of β-catenin target molecules in the gastric mucosa of HFD-fed mice. Staining of the gastric mucosa with (A) β-catenin and (B) Lgr5 of mice fed experimental diets for 12 weeks. (C) mRNA expression of c-Myc of the gastric mucosa in mice fed experimental diets for 12 weeks. Data, shown as mean ± SD were analyzed by the one-way ANOVA followed by Holm-Sidak post-hoc test for multiple comparisons. * p < 0.05, ** p < 0.001. Eight mice per group were used.
Figure 7
Figure 7
Alterations in microbial abundance in the gastrointestinal tract in various HFD-fed mice. Absolute numbers of the 12 major kinds of gastrointestinal bacteria in the stomach and large intestine, quantified at the group-specific level using qPCR. Data are represented as a stacked bar chart with eight mice per group.
Figure 8
Figure 8
Acceleration of dysplasia in the stomach of the mice fed HFDs inducing gastric leptin. Gastric sections stained for (A) PAS-Alcian blue and (B) Ki67 in mice fed experimental diets for 12 weeks. Graphs next to each stained picture indicate numbers of positive cells in four randomly selected fields at 200× magnification in each group. Values represent the means ± SD. (C) Data, shown as mean ± SD were analyzed by the one-way ANOVA followed by Holm-Sidak post-hoc test for multiple comparisons. *** p < 0.0001. Five mice were used in each group.

Similar articles

Cited by

References

    1. Torre L.A., Bray F., Siegel R.L., Ferlay J., Lortet-Tieulent J., Jemal A. Global cancer statistics, 2012. CA Cancer J. Clin. 2015;65:87–108. doi: 10.3322/caac.21262. - DOI - PubMed
    1. Bhandari A., Crowe S.E. Helicobacter pylori in gastric malignancies. Curr. Gastroenterol. Rep. 2012;14:489–496. doi: 10.1007/s11894-012-0296-y. - DOI - PubMed
    1. Helicobacter and Cancer Collaborative Group Gastric cancer and Helicobacter pylori: A combined analysis of 12 case control studies nested within prospective cohorts. Gut. 2001;49:347–353. doi: 10.1136/gut.49.3.347. - DOI - PMC - PubMed
    1. Peek R.M., Jr., Crabtree J.E. Helicobacter infection and gastric neoplasia. J. Pathol. 2006;208:233–248. doi: 10.1002/path.1868. - DOI - PubMed
    1. Wroblewski L.E., Peek R.M., Jr., Wilson K.T. Helicobacter pylori and gastric cancer: Factors that modulate disease risk. Clin. Microbiol. Rev. 2010;23:713–739. doi: 10.1128/CMR.00011-10. - DOI - PMC - PubMed