

mRNA-Driven Generation of Transgene-Free Neural Stem Cells from Human Urine-Derived Cells
- PMID: 31489945
- PMCID: PMC6769943
- DOI: 10.3390/cells8091043
mRNA-Driven Generation of Transgene-Free Neural Stem Cells from Human Urine-Derived Cells
Abstract
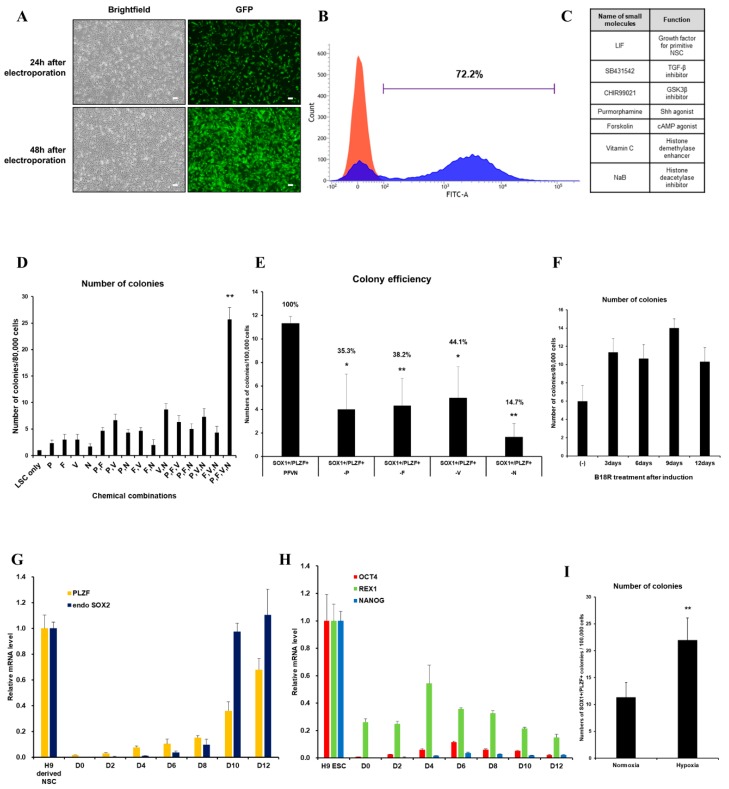
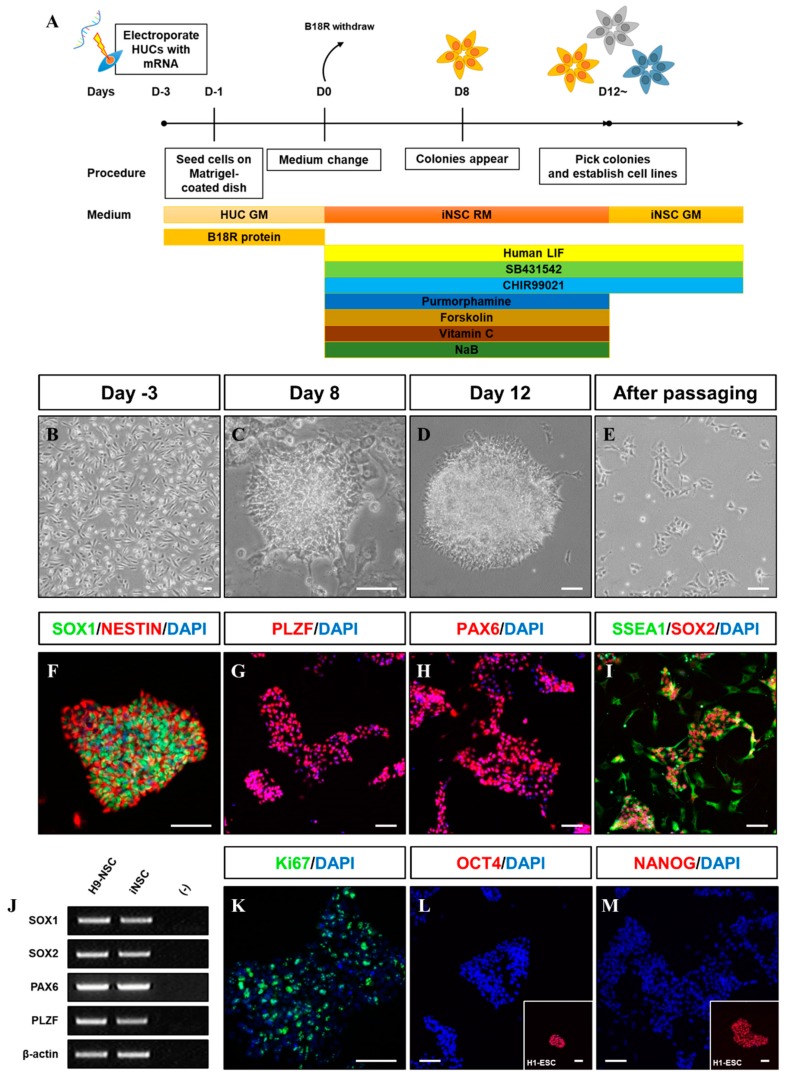
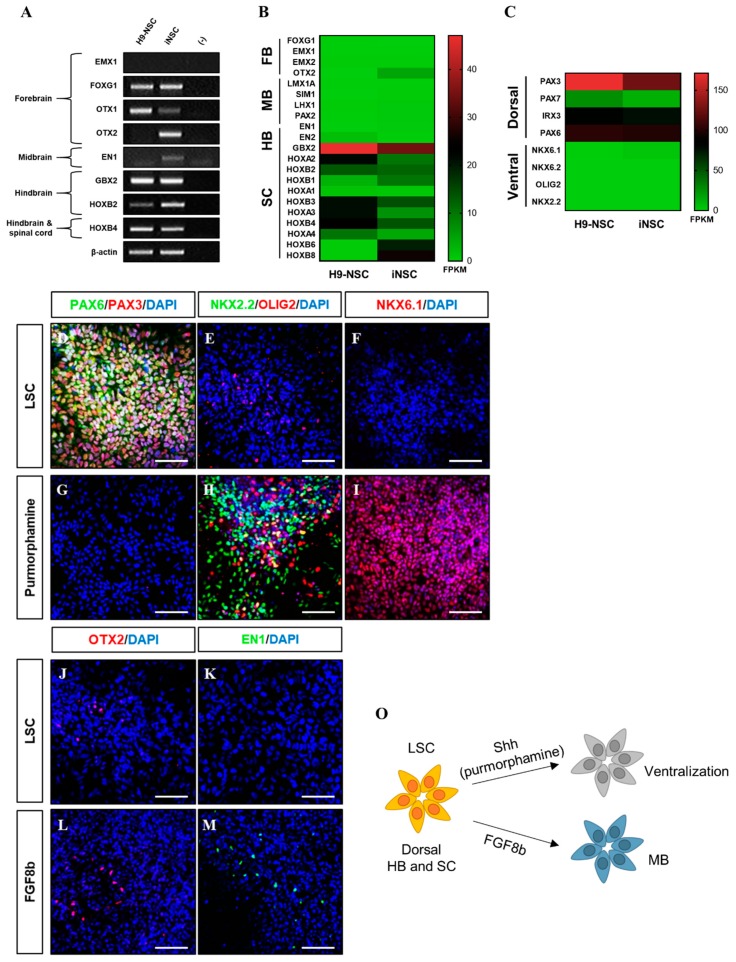
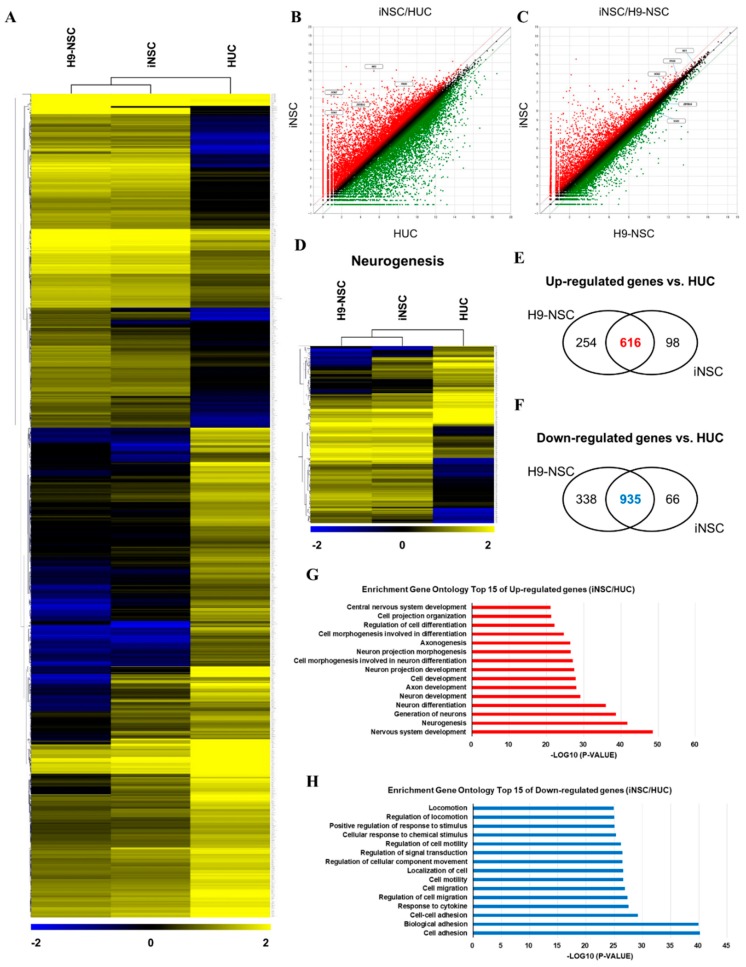
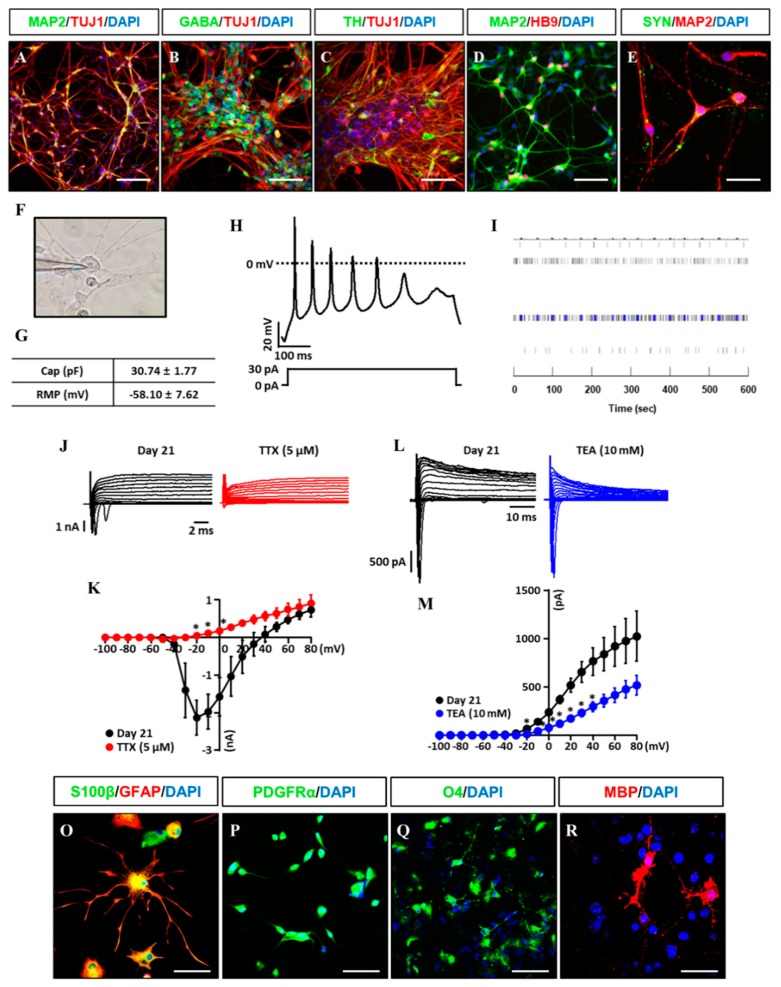
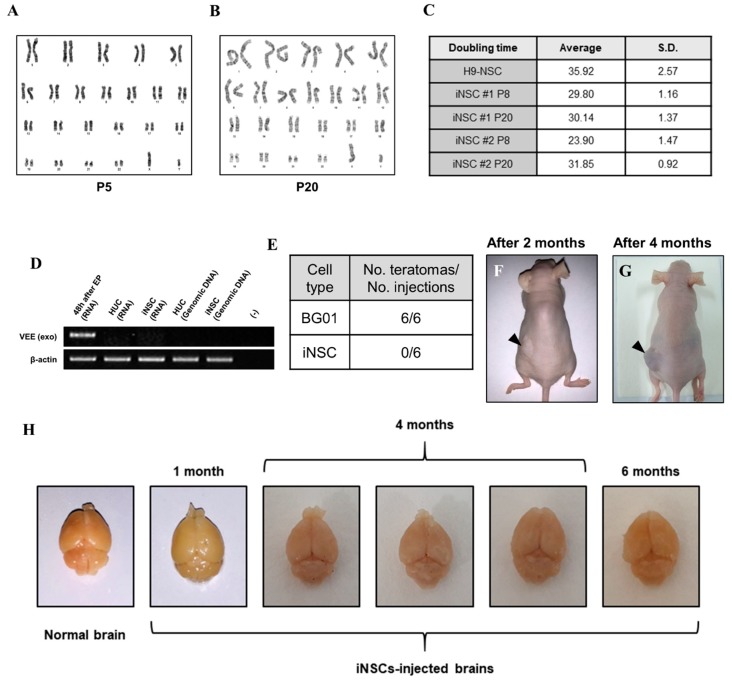
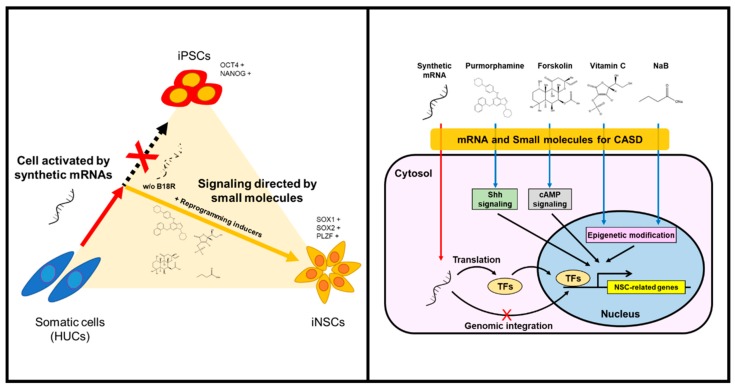
Human neural stem cells (NSCs) hold enormous promise for neurological disorders, typically requiring their expandable and differentiable properties for regeneration of damaged neural tissues. Despite the therapeutic potential of induced NSCs (iNSCs), a major challenge for clinical feasibility is the presence of integrated transgenes in the host genome, contributing to the risk for undesired genotoxicity and tumorigenesis. Here, we describe the advanced transgene-free generation of iNSCs from human urine-derived cells (HUCs) by combining a cocktail of defined small molecules with self-replicable mRNA delivery. The established iNSCs were completely transgene-free in their cytosol and genome and further resembled human embryonic stem cell-derived NSCs in the morphology, biological characteristics, global gene expression, and potential to differentiate into functional neurons, astrocytes, and oligodendrocytes. Moreover, iNSC colonies were observed within eight days under optimized conditions, and no teratomas formed in vivo, implying the absence of pluripotent cells. This study proposes an approach to generate transplantable iNSCs that can be broadly applied for neurological disorders in a safe, efficient, and patient-specific manner.
Keywords: direct conversion; induced neural stem cells (iNSCs); neurological diseases; reprogramming; self-replicative mRNA; small molecules.
Conflict of interest statement
The authors declare no conflict of interest.
Figures

Similar articles
-
Single-Factor SOX2 Mediates Direct Neural Reprogramming of Human Mesenchymal Stem Cells via Transfection of In Vitro Transcribed mRNA.Cell Transplant. 2018 Jul;27(7):1154-1167. doi: 10.1177/0963689718771885. Epub 2018 Jun 18. Cell Transplant. 2018. PMID: 29909688 Free PMC article.
-
Reprogramming Fibroblasts to Neural Stem Cells by Overexpression of the Transcription Factor Ptf1a.Methods Mol Biol. 2020;2117:245-263. doi: 10.1007/978-1-0716-0301-7_15. Methods Mol Biol. 2020. PMID: 31960384
-
Sonic Hedgehog Effectively Improves Oct4-Mediated Reprogramming of Astrocytes into Neural Stem Cells.Mol Ther. 2019 Aug 7;27(8):1467-1482. doi: 10.1016/j.ymthe.2019.05.006. Epub 2019 May 16. Mol Ther. 2019. PMID: 31153826 Free PMC article.
-
Direct lineage conversion of astrocytes to induced neural stem cells or neurons.Neurosci Bull. 2015 Jun;31(3):357-67. doi: 10.1007/s12264-014-1517-1. Epub 2015 Apr 8. Neurosci Bull. 2015. PMID: 25854678 Free PMC article. Review.
-
Small Molecules for Neural Stem Cell Induction.Stem Cells Dev. 2018 Mar 1;27(5):297-312. doi: 10.1089/scd.2017.0282. Epub 2018 Feb 21. Stem Cells Dev. 2018. PMID: 29343174 Review.
Cited by
-
Application prospects of urine-derived stem cells in neurological and musculoskeletal diseases.World J Orthop. 2024 Oct 18;15(10):918-931. doi: 10.5312/wjo.v15.i10.918. eCollection 2024 Oct 18. World J Orthop. 2024. PMID: 39473520 Free PMC article. Review.
-
Chemical transdifferentiation of somatic cells to neural cells: a systematic review.Einstein (Sao Paulo). 2024 Dec 9;22:eRW0423. doi: 10.31744/einstein_journal/2024RW0423. eCollection 2024. Einstein (Sao Paulo). 2024. PMID: 39661857 Free PMC article.
-
Induced Neurons for Disease Modeling and Repair: A Focus on Non-fibroblastic Cell Sources in Direct Reprogramming.Front Bioeng Biotechnol. 2021 Mar 12;9:658498. doi: 10.3389/fbioe.2021.658498. eCollection 2021. Front Bioeng Biotechnol. 2021. PMID: 33777923 Free PMC article. Review.
-
Urine-derived induced pluripotent/neural stem cells for modeling neurological diseases.Cell Biosci. 2021 May 13;11(1):85. doi: 10.1186/s13578-021-00594-5. Cell Biosci. 2021. PMID: 33985584 Free PMC article. Review.
-
Generation of Induced Nephron Progenitor-like Cells from Human Urine-Derived Cells.Int J Mol Sci. 2021 Dec 15;22(24):13449. doi: 10.3390/ijms222413449. Int J Mol Sci. 2021. PMID: 34948246 Free PMC article.
References
-
- Flax J.D., Aurora S., Yang C., Simonin C., Wills A.M., Billinghurst L.L., Jendoubi M., Sidman R.L., Wolfe J.H., Kim S.U., et al. Engraftable human neural stem cells respond to developmental cues, replace neurons, and express foreign genes. Nat. Biotechnol. 1998;16:1033–1039. doi: 10.1038/3473. - DOI - PubMed
-
- Nunes M.C., Roy N.S., Keyoung H.M., Goodman R.R., McKhann G., 2nd, Jiang L., Kang J., Nedergaard M., Goldman S.A. Identification and isolation of multipotential neural progenitor cells from the subcortical white matter of the adult human brain. Nat. Med. 2003;9:439–447. doi: 10.1038/nm837. - DOI - PubMed
Publication types
MeSH terms
Substances
LinkOut - more resources
Full Text Sources
Other Literature Sources
Medical
Molecular Biology Databases
Research Materials
