. 2019 Sep 6;14(9):e0221810.
doi: 10.1371/journal.pone.0221810. eCollection 2019.

Desmoplasia and oncogene driven acinar-to-ductal metaplasia are concurrent events during acinar cell-derived pancreatic cancer initiation in young adult mice

Affiliations

Desmoplasia and oncogene driven acinar-to-ductal metaplasia are concurrent events during acinar cell-derived pancreatic cancer initiation in young adult mice

Benjamin L Johnson et al. PLoS One. .

Abstract

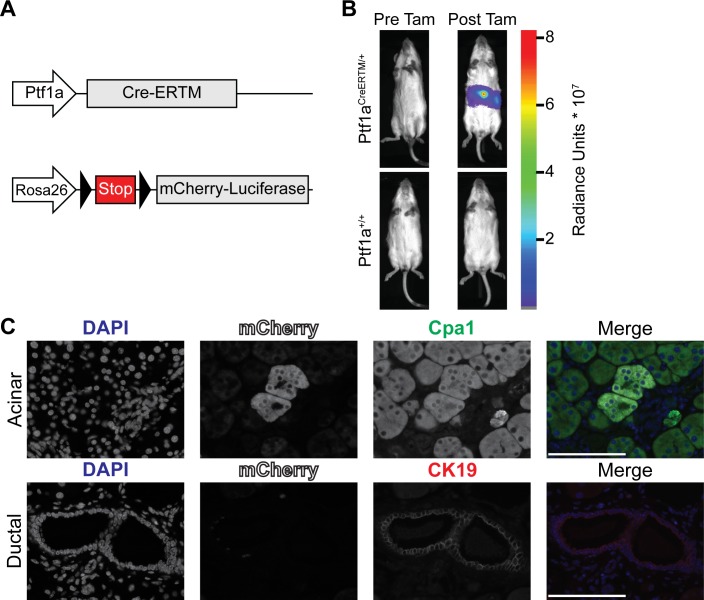
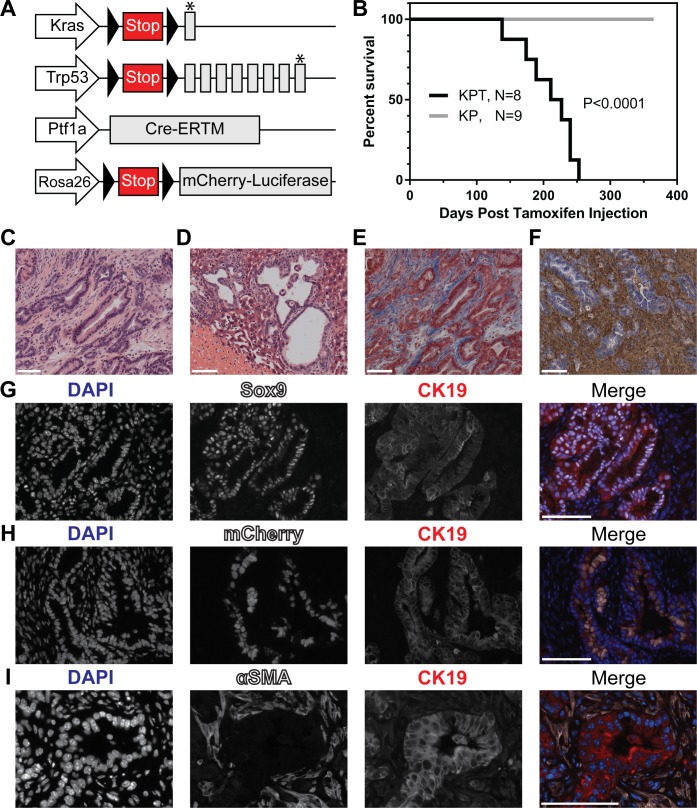
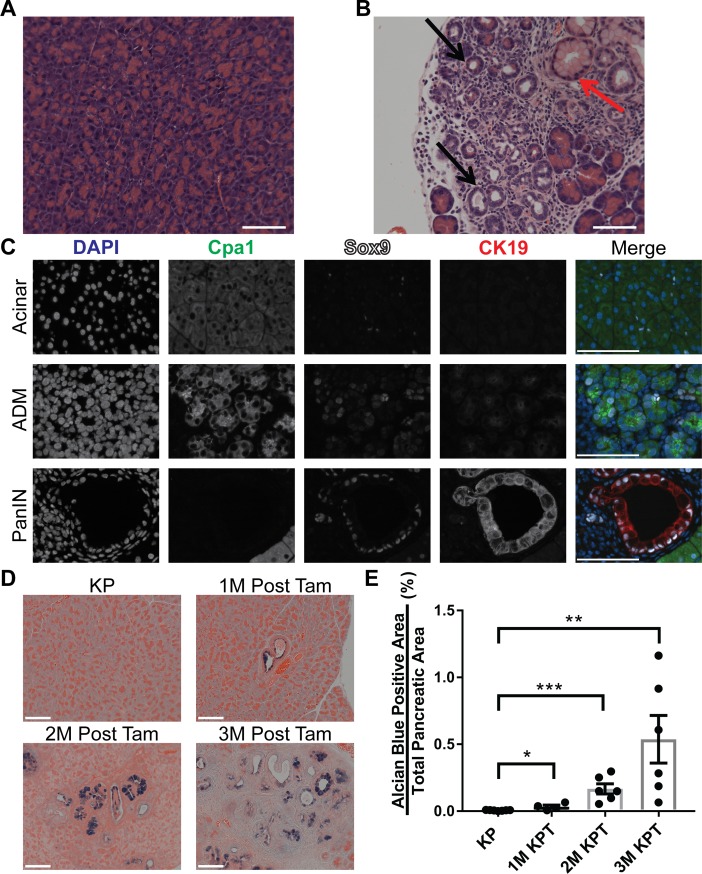
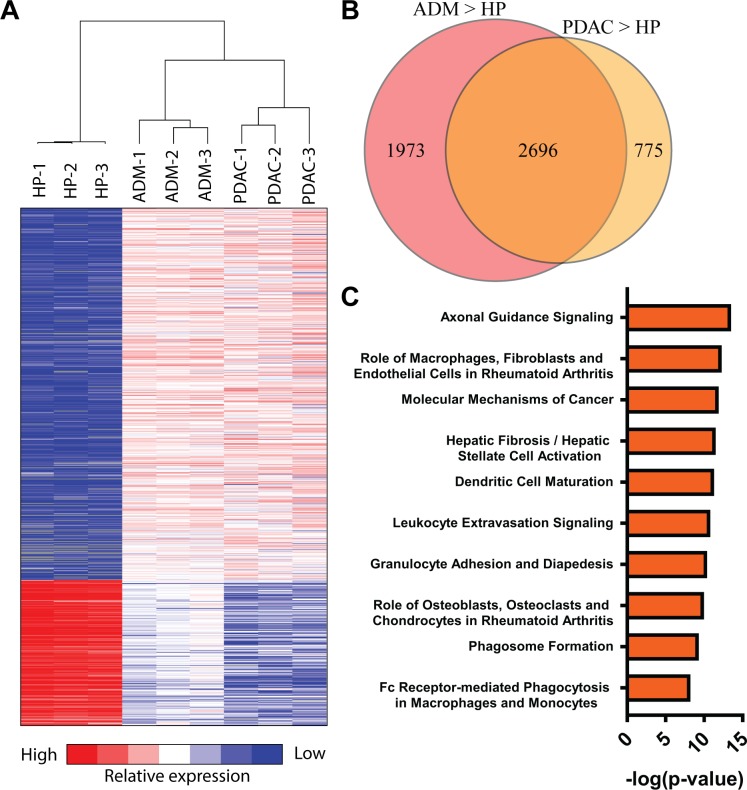
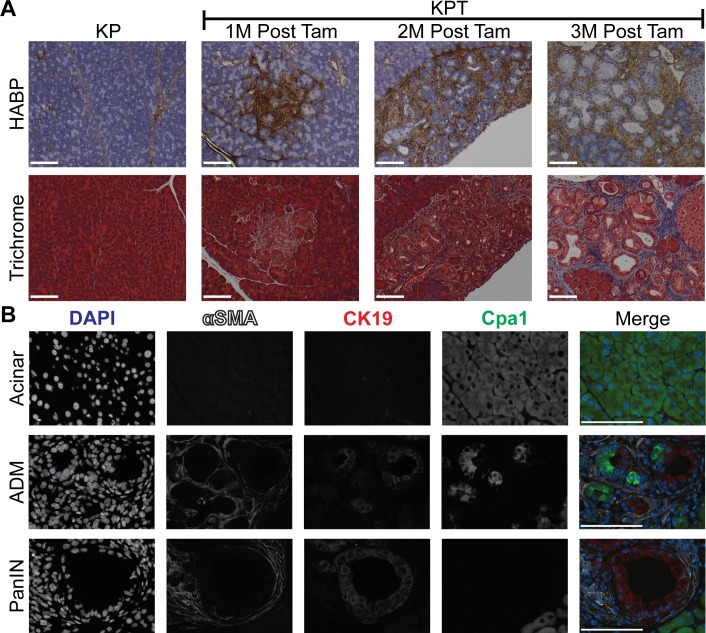
The five-year survival rate of patients diagnosed with advanced pancreatic ductal adenocarcinoma (PDAC) has remained static at <5% despite decades of research. With the exception of erlotinib, clinical trials have failed to demonstrate the benefit of any targeted therapy for PDAC despite promising results in preclinical animal studies. The development of more refined mouse models of PDAC which recapitulate the carcinogenic progression from non-neoplastic, adult exocrine subsets of pancreatic cells to invasive carcinoma in humans are needed to facilitate the accurate translation of therapies to the clinic. To study acinar cell-derived PDAC initiation, we developed a genetically engineered mouse model of PDAC, called KPT, utilizing a tamoxifen-inducible Cre recombinase/estrogen receptor (ESR1) fusion protein knocked into the Ptf1a locus to activate the expression of oncogenic KrasG12D and Trp53R270H alleles in mature pancreatic acinar cells. Oncogene-expressing acinar cells underwent acinar-to-ductal metaplasia, and formed pancreatic intraepithelial neoplasia lesions following the induction of oncogene expression. After a defined latency period, oncogene-expressing acinar cells initiated the formation of highly differentiated and fibrotic tumors, which metastasized to the lungs and liver. Whole-transcriptome analysis of microdissected regions of acinar-to-ductal metaplasia and histological validation experiments demonstrated that regions of acinar-to-ductal metaplasia are characterized by the deposition of the extracellular matrix component hyaluronan. These results indicate that acinar cells expressing KrasG12D and Trp53R270H can initiate PDAC development in young adult mice and implicate hyaluronan deposition in the formation of the earliest characterized PDAC precursor lesions (and the progression of pancreatic cancer). Further studies are necessary to provide a comprehensive characterization of PDAC progression and treatment response in KPT mice and to investigate whether the KPT model could be used as a tool to study translational aspects of acinar cell-derived PDAC tumorigenesis.


Conflict of interest statement

The authors have declared that no competing interests exist.

Figures

Fig 1
Fig 1. Ptf1aCreERTM mediated recombination is pancreatic acinar cell specific and occurs only following tamoxifen administration.
(A) Graphic representation of alleles altered in Ptf1aCreERTM mice. Triangles represent LoxP sites. Arrows indicate genetic loci. Grey boxes indicate exons. (B) Bioluminescence imaging demonstrating tamoxifen (Tam) induced Ptf1aCreERTM activity; images are representative of 3 separate experiments involving 2 mice per group. Radiance unit is photons/second/cm2/steradian (C) Multiplexed IF micrographs indicating expression of lineage marker (mCherry) only in acinar cells. Micrographs depict acinar cells (upper panels) and pancreatic ductal cells (lower panels). Channels are DAPI (blue), mCherry (white), Cpa1 (green), and CK19 (red). Micrographs are representative of n = 2 Ptf1aCre-ERTM positive mice. Magnification 63X, scale bars represent 100 μm.
Fig 2
Fig 2. KPT mice develop metastatic and desmoplastic PDAC.
(A) Graphic representation of alleles altered in KPT mice. Triangles represent LoxP sites. Arrows indicate genetic loci. Grey boxes indicate exons. Asterisks indicate point mutations. (B) Kaplan-Meier survival analysis of KPT and KP mice post tamoxifen injection. Median survival for KPT mice is 219 day post tamoxifen injection. P < 0.0001 by means of the log-rank test. Representative micrographs depicting H&E stained sections of PDAC (C) and liver metastasis (D) in KPT mice. (E) Representative micrographs of Trichrome stained tissue sections of PDAC in KPT mice (n = 5). (F) Representative micrographs depicting histochemical visualization of HA in KPT tumors, HA is stained brown, nuclei are counterstained blue (n = 5). Magnification of brightfield images is 20x. (G) Multiplexed IF staining of KPT tumors for detection of nuclei (DAPI, blue), Sox9 (white) and CK19 (red). n = 3 KPT tumors, magnification 40x. (H) Multiplexed IF staining of KPT tumors for detection of nuclei (DAPI, blue), mCherry (white) and CK19 (red) n = 2 KPT tumors, magnification 40x. (I) Multiplexed IF staining of KPT tumors for detection of nuclei (DAPI, blue), αSMA (white) and CK19 (red) n = 3 KPT tumors, magnification 63x. All scale bars represent 100 μm.
Fig 3
Fig 3. ADM and PanIN lesions precede tumor formation in KPT mice.
(A-B) Representative micrographs depicting H&E stained sections of the pancreata of KP (A) and KPT (B) mice 3 months post tamoxifen treatment. Black arrows indicate regions of acinar to ductal metaplasia, red arrow indicates PanIN lesion. (n = 6 KPT mice, and n = 7 KP mice), magnification 20x. (C) Representative multiplexed IF micrographs of KPT pancreata 2 months post tamoxifen treatment, for detection of nuclei (DAPI, blue), Cpa1 (green), Sox9 (white) and CK19 (red). Images depict acinar tissue with normal histology (upper panels), an isolated region of early acinar to ductal metaplasia (middle panels) and a PanIN lesion (lower panels), n = 6 KPT mice, magnification is 63X. (D) Representative micrographs of alcian blue and eosin (AB/E) stained sections of the pancreata of KPT and KP littermate control mice 1M, 2M, and 3M post tamoxifen injection, magnification is 20X. (E) Whole slide quantification of alcian blue positive area relative to eosin positive total pancreatic area, data points represent 1 AB/E stained slide per mouse, n = 7 for KP mice, n = 4 for 1M KPT mice, n = 6 for 2M KPT, n = 6 for 3M KPT. Bars depicts mean with error bars representing standard error of the mean (SEM). Significance was determined by student’s t test. *, P < 0.05; **, P < 0.01; ***, P < 0.001. All scale bars represent 100 μm.
Fig 4
Fig 4. RNA sequencing of microdissected regions of ADM and PDAC identifies differentially expressed genes and pathways.
(A) Heatmap depicting normalized gene expression of differentially expressed genes in three way comparison between HP, ADM and PDAC samples. (B) Venn diagram depicting overlap between differentially expressed genes in HP-ADM and HP-PDAC pair wise comparisons. (C) IPA canonical pathway analysis identifies conserved inflammation associated canonical pathways present in ADM and PDAC. Data is represented as negative log (P value) of canonical pathway association.
Fig 5
Fig 5. The desmoplastic response occurs in conjunction with ADM and increases with progression to PanIN.
(A) Histochemical visualization of HA (brown) counterstained with hematoxylin (blue). Representative micrographs depict the pancreata of KPT and KP mice 1 month, 2 months, and 3 months post-tamoxifen injection. Images of KPT pancreata depict dysplastic regions containing ADM and/or PanIN. Masson’s trichrome staining depicting collagen deposition (blue) in serial sections from the same KPT pancreata as shown in (A), n = 7 for KP mice, n = 4 for 1M KPT mice, n = 6 for 2M KPT, n = 6 for 3M KPT. Magnification of bright field images is 20X. (B) Representative multiplexed IF micrographs for detection of nuclei (DAPI, blue), αSMA (white), CK19 (red), and Cpa1 (green). Rows depict healthy acinar tissue (acinar), a region of ADM and PanIN lesions. Micrographs are representative of the pancreata of KPT mice 2 months post tamoxifen treatment (n = 3), magnification is 63X. All scale bars represent 100 μm.We sought to identify the source of HA in regions of ADM, via the detection of activated PSC. Increased activation and proliferation of PSC are directly involved in the development of PDAC associated fibrosis via the deposition of ECM components including HA and collagen in the tumor microenvironment [40]. Multiplexed IF staining against αSMA, CK19 and Cpa1 revealed the presence of activated PSC in proximity to PanIN lesions and infiltrating regions of ADM in KPT mice. Activated αSMA-positive PSCs were not observed in regions of Cpa1+/CK19- healthy acinar tissue (Fig 5B, top panel). Activated PSC were observed infiltrating regions of ADM containing Cpa1+/CK19+ cells undergoing ADM (Fig 5B, middle panel), and CK19+/Cpa1- PanIN lesions were surrounded by activated PSC (Fig 5B, bottom panel). These observations indicate that PSC recruitment and/or activation occur during ADM and that neoplasia-associated HA production and PSC activation precede collagen deposition, which is associated with PanIN lesions. To our knowledge, the role of desmoplasia in general, or HA deposition specifically, in the initiation of PDAC has not been investigated in detail, due to the paucity of animal models. While PSC activation in regions of ADM is associated with HA deposition, additional experiments are necessary to definitively identify the specific cellular origin of HA in regions of ADM. These results establish the KPT model as an ideal model to study the role of the desmoplastic response in PDAC development from a defined population of adult cells.

References

    1. Siegel RL, Miller KD, Jemal A (2018) Cancer statistics, 2018. CA Cancer J Clin 68: 7–30. 10.3322/caac.21442 - DOI - PubMed
    1. Noone AM, Howlader N, Krapcho M, Miller D, Brest A, et al. (2018) SEER Cancer Statistics Review, 1975–2015. Nov. 2017 ed. Bethesda, MD: National Cancer Institute.
    1. Siegel RL, Miller KD, Jemal A (2016) Cancer statistics, 2016. CA Cancer J Clin 66: 7–30. 10.3322/caac.21332 - DOI - PubMed
    1. Yeo CJ, Abrams RA, Grochow LB, Sohn TA, Ord SE, et al. (1997) Pancreaticoduodenectomy for pancreatic adenocarcinoma: postoperative adjuvant chemoradiation improves survival. A prospective, single-institution experience. Ann Surg 225: 621–633; discussion 633–626. 10.1097/00000658-199705000-00018 - DOI - PMC - PubMed
    1. Almoguera C, Shibata D, Forrester K, Martin J, Arnheim N, et al. (1988) Most human carcinomas of the exocrine pancreas contain mutant c-K-ras genes. Cell 53: 549–554. 10.1016/0092-8674(88)90571-5 - DOI - PubMed

Publication types

Substances