Randomized Controlled Trial
. 2019 Sep 5;178(6):1313-1328.e13.
doi: 10.1016/j.cell.2019.08.010.

Antibiotics-Driven Gut Microbiome Perturbation Alters Immunity to Vaccines in Humans

Affiliations
Randomized Controlled Trial

Antibiotics-Driven Gut Microbiome Perturbation Alters Immunity to Vaccines in Humans

Thomas Hagan et al. Cell. .

Abstract

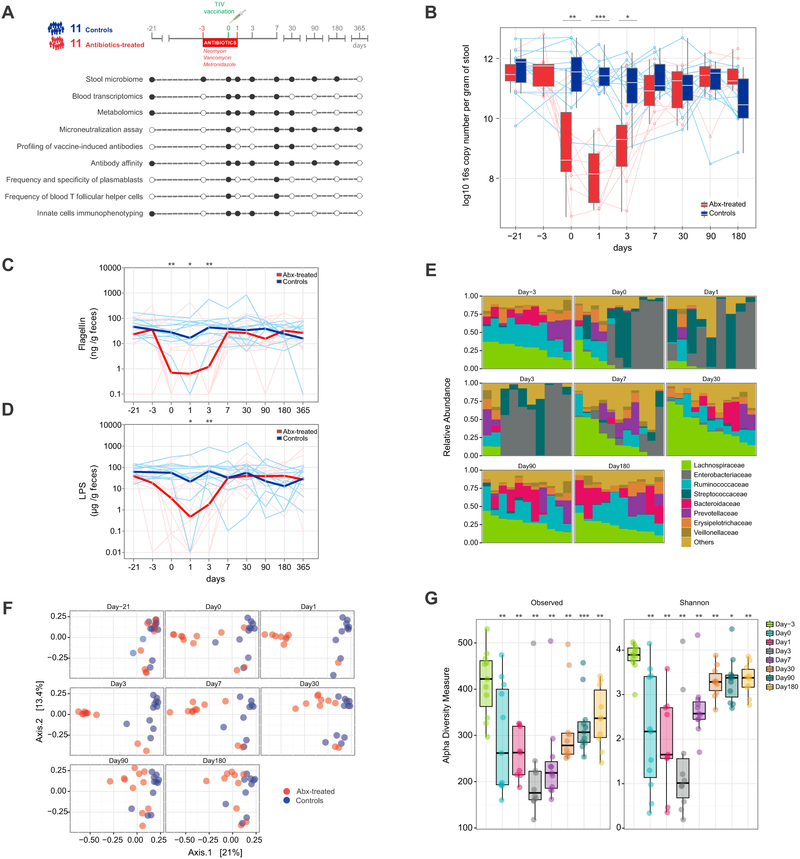
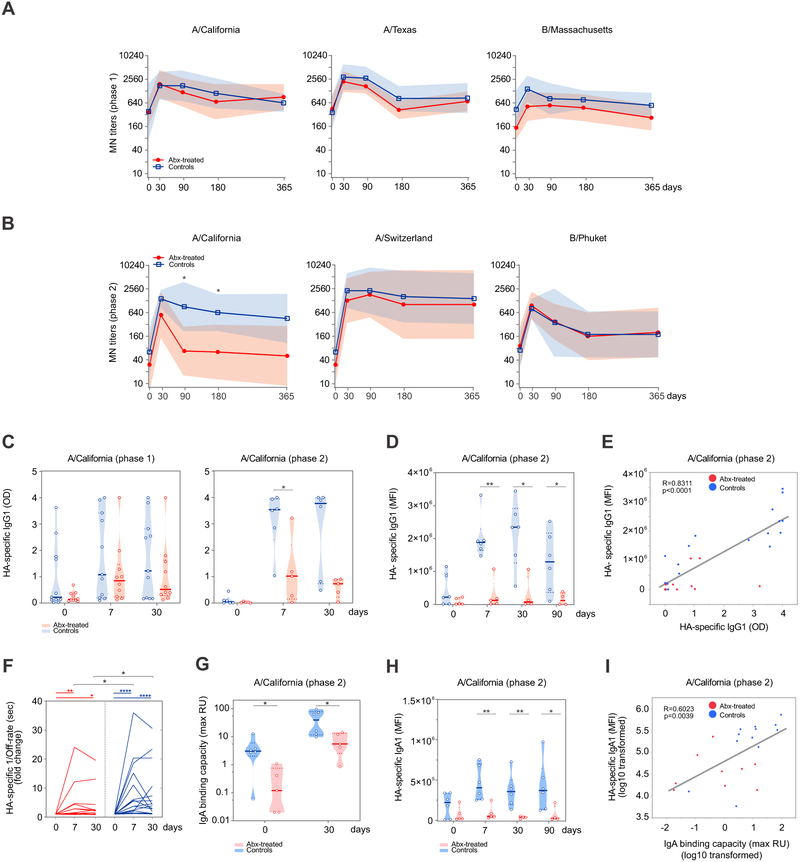
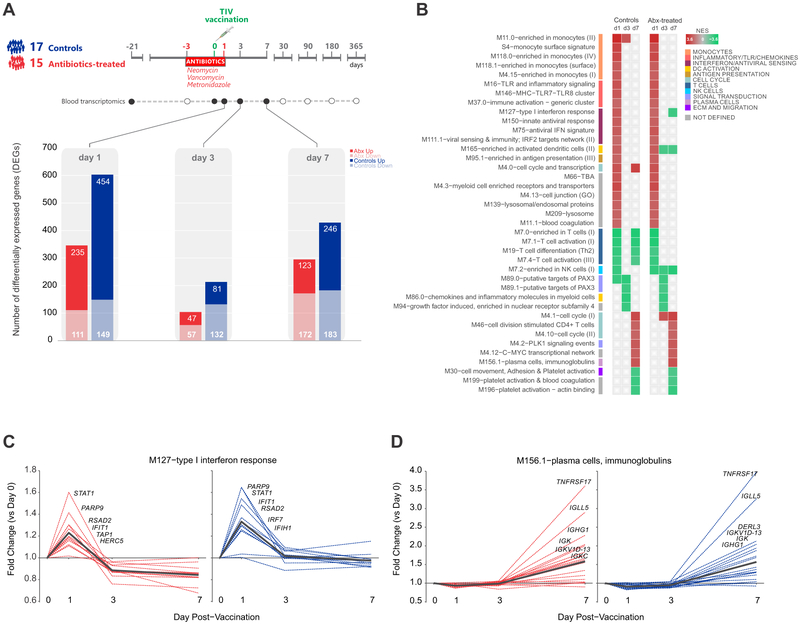
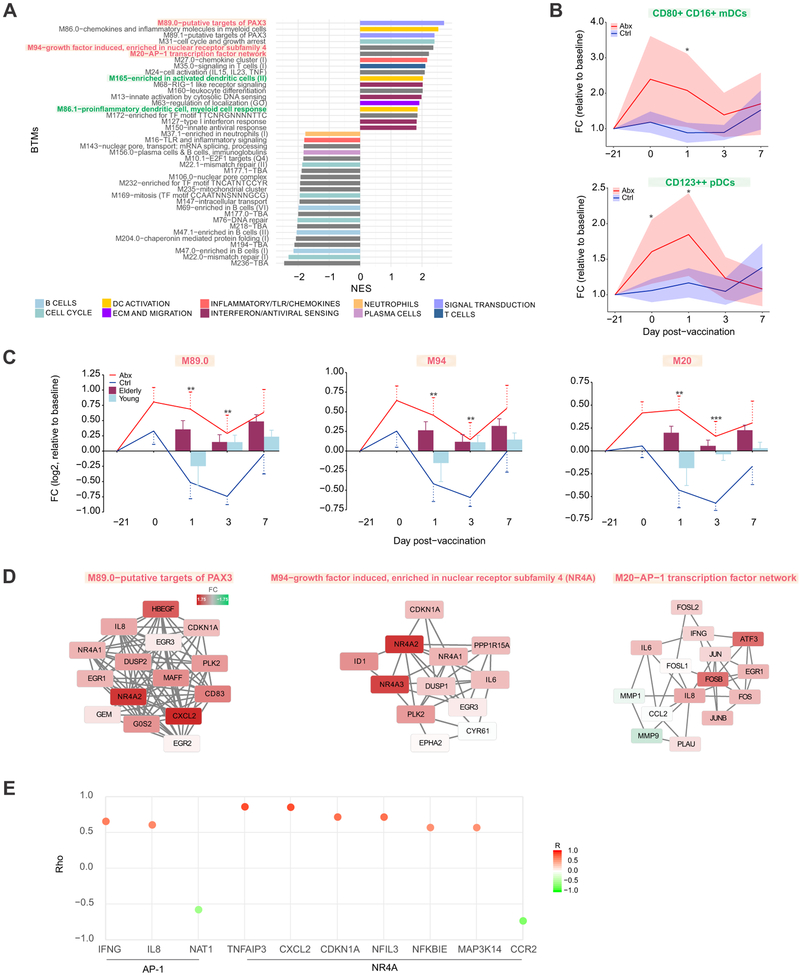
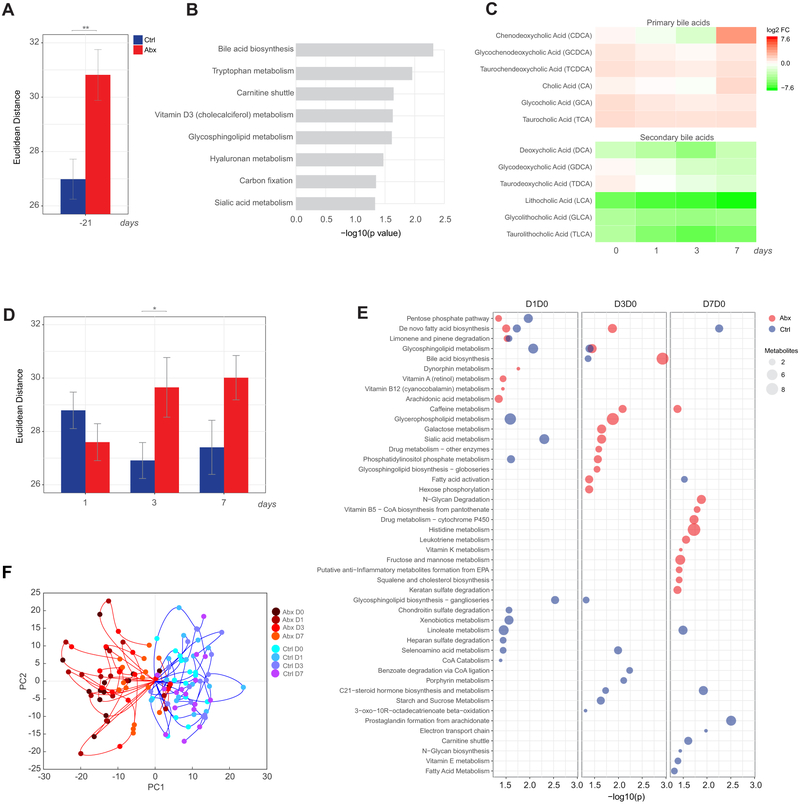
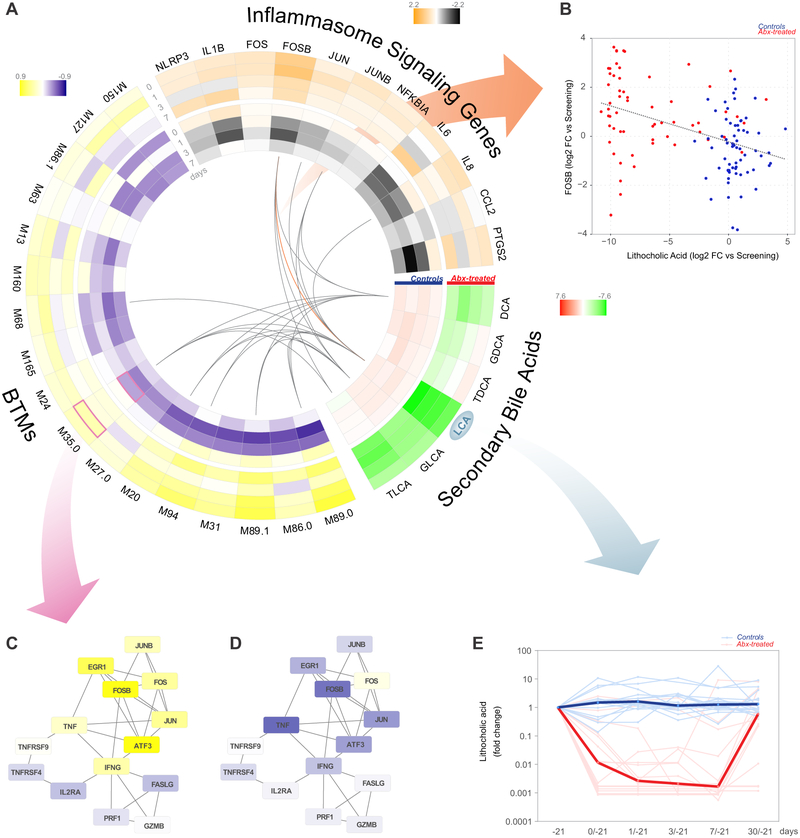
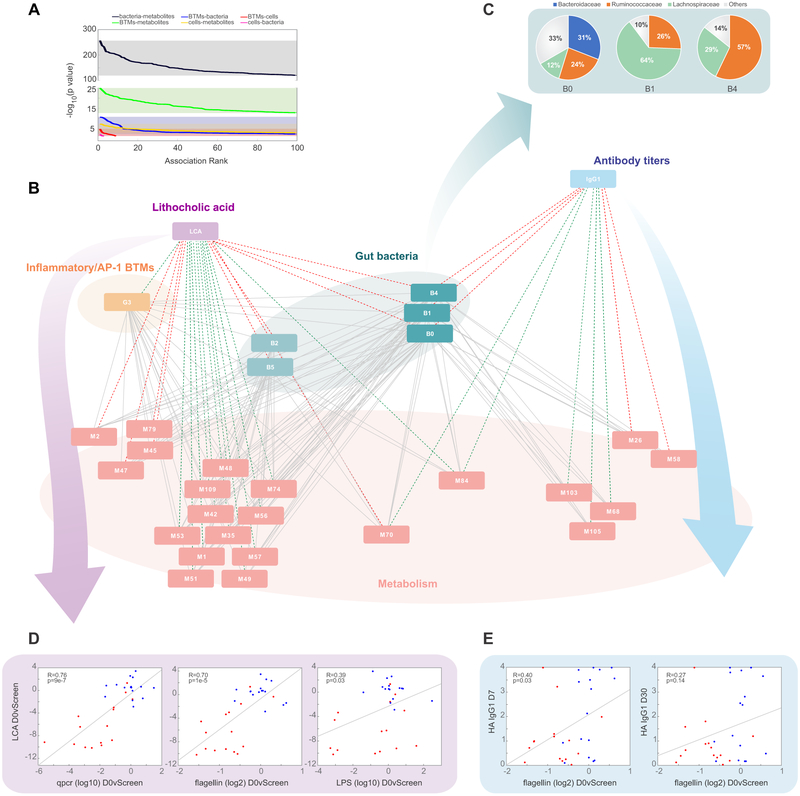
Emerging evidence indicates a central role for the microbiome in immunity. However, causal evidence in humans is sparse. Here, we administered broad-spectrum antibiotics to healthy adults prior and subsequent to seasonal influenza vaccination. Despite a 10,000-fold reduction in gut bacterial load and long-lasting diminution in bacterial diversity, antibody responses were not significantly affected. However, in a second trial of subjects with low pre-existing antibody titers, there was significant impairment in H1N1-specific neutralization and binding IgG1 and IgA responses. In addition, in both studies antibiotics treatment resulted in (1) enhanced inflammatory signatures (including AP-1/NR4A expression), observed previously in the elderly, and increased dendritic cell activation; (2) divergent metabolic trajectories, with a 1,000-fold reduction in serum secondary bile acids, which was highly correlated with AP-1/NR4A signaling and inflammasome activation. Multi-omics integration revealed significant associations between bacterial species and metabolic phenotypes, highlighting a key role for the microbiome in modulating human immunity.

Keywords: antibodies; bile acids; gene expression profiling; immunology; influenza; metabolomics; microbiota; systems biology; systems vaccinology; vaccines.


Conflict of interest statement

Declaration of Interests: Nothing to declare.

Figures

Figure 1.
Figure 1.. Study overview and evaluation of the effects of antibiotic use on the gut microbiome of healthy adults
(A) Study overview. A total of 22 study participants aged 18-45 received a trivalent influenza vaccine (TIV) on day 0. Eleven subjects were randomized to a five-day oral broad-spectrum antibiotic regimen between day −3 and day 1. Samples were collected and analyses performed at regular intervals (black circles) as illustrated in the diagram. (B) Normalized copy number of bacterial 16s ribosomal RNA per gram of stool. Each line corresponds to an individual subject. Controls are shown in blue, antibiotics-treated subjects in red. Median values and distributions for each time point are illustrated in the form of box plots. (C-D) Flagellin (C) and LPS (D) concentrations per gram of stool. Each thin line represents a single subject, thick lines represent geometric means. (E) Relative abundance of bacterial families in the antibiotics-treated group at different time points. Each vertical bar corresponds to a study participant. On day 1 and day 3, data is available for 9 and 10 out of 11 individuals only, respectively. (F) Dimensional reduction of the Bray-Curtis distance between microbiome samples, using the principal coordinates analysis (PCoA) ordination method. Each circle corresponds to a single individual. (G) Alpha-diversity estimates. “Observed” diversity represents the number of OTUs (richness) present in each sample (left panel). “Shannon” diversity takes into account both richness and evenness of OTUs within a sample (right panel). Each circle corresponds to a single individual in the antibiotics-treated group. Median values and interquartile ranges shown in box plots. Where calculated, comparisons between control and antibiotics-treated groups at specific time points were performed by Mann-Whitney tests. Wilcoxon matched-pairs signed rank tests were used to compare time points within the same group (panel G). *p<0.05; **p<0.01; ***p<0.001; ****p<0.0001. See also Figure S1.
Figure 2.
Figure 2.. Impact of antibiotics treatment on humoral responses to TIV.
(A-B) Microneutralization (MN) titers against the 3 influenza strains contained in the 2014-2015 (A) and 2015-2016 (B) TIV formulations. Geometric means are presented in thick lines, while shades are for geometric standard deviations (SD). (C) IgG1-binding to A/California H1 for phase 1 (left panel) and phase 2 (right panel) measured by ELISA. Violin plots show sample distributions. Each circle represents an individual subject, while medians are presented in thick lines. (D) Relative concentration of A/California H1 HA-specific IgG1 for phase 2 determined using a high-throughput Luminex-based assay (Brown et al., 2012). Violin plots show sample distributions. Each circle represents an individual subject, while medians are presented in thick lines. (E) Scatterplot of A/California H1 HA-specific IgG1 measured by ELISA vs A/California H1 HA-specific IgG1 measured by Luminex for phase 2 subjects on days 0, 7, 30. Each dot represents one subject. (F) Off-rate measurements in seconds (sec) by surface plasmon resonance (SPR) to assess antibody affinity to A/California H1. The data is presented as reciprocally transformed and as fold change over the baseline. Each line represents one subject. (G) A/California H1 HA-specific IgA isotype binding capacity measured by SPR and presented as maximum resonance units (max RU) for phase 2 subjects. Violin plots show sample distributions. Each circle represents an individual subject, while medians are presented in thick lines. (H) Relative concentration of A/California H1 HA-specific IgA1 for phase 2 determined using a high-throughput Luminex-based assay, as for panel D. Violin plots show sample distributions. Each circle represents an individual subject, while medians are presented in thick lines. (I) Scatterplot of A/California H1 HA-specific IgA isotype binding capacity measured by SPR vs A/California H1 HA-specific IgA1 measured by Luminex for phase 2 subjects on days 0 and 30. Each dot represents one subject. See STAR Methods for further details. Where calculated, comparisons between control and antibiotics-treated groups at specific time points were performed by Mann-Whitney tests (panels A-D, F-H). Wilcoxon matched-pairs signed rank tests were used to compare time points within the same group (panel F). Pearson correlation was used for panels E and I. *p<0.05; **p<0.01; ***p<0.001; ****p<0.0001. See also Figures S2 and S3.
Figure 3.
Figure 3.. Transcriptional Responses to TIV in Control and Antibiotics-Treated Subjects
(A) Number of genes differentially expressed (log2 fold-change > 0.2 and t-test p value < 0.01) relative to day 0 in control and antibiotics-treated subjects on days 1, 3, and 7 post-vaccination. (B) BTMs significantly enriched (FDR < 0.05, NES ≥ 2) in control and antibiotics-treated subjects post-vaccination. GSEA (Subramanian et al., 2005) was used to identify positive (red) or negative (green) enrichment of BTMs using ranked gene lists, where genes were ordered by t-statistic based on post-vaccination fold change relative to day 0. (C-D) Temporal expression patterns of genes within modules M127 and M156.1 among antibiotics-treated (red) and control subjects (blue). Black line represents the mean fold change of all genes. See also Figure S4 for comparison of responses in phases 1 and 2.
Figure 4.
Figure 4.. Transcriptional and Cellular Responses to Antibiotics Administration
(A) BTMs significantly enriched (FDR < 0.05) following antibiotics use. GSEA (Subramanian et al., 2005) was used to compute the normalized enrichment score (NES) of BTMs using ranked gene lists, where genes were ordered by t-statistic based on day 0 versus screening (day −21) fold change in antibiotics-treated subjects. Enriched modules are colored according to their high-level functional annotation. (B) Kinetics of dendritic cell subsets following antibiotics administration and vaccination. Solid lines represent mean fold change and shaded areas represent 95% confidence interval. (C) Kinetics of AP-1/NR4A related BTMs following antibiotics administration and vaccination. Solid lines represent average module expression among antibiotics-treated (red) and control subjects (blue), and bar plots represent average module expression among young (< 65 years, light blue) and elderly (≥ 65 years, maroon) subjects vaccinated with TIV during the 2010-2011 influenza season (Nakaya et al., 2015). Error bars represent standard error of the mean (SEM). (D) Genes in AP-1/NR4A related BTMs. Each “edge” (gray line) represents a coexpression relationship, as described in Li et al. (Li et al., 2014); colors represent the day 0 versus screening (day −21) log2 fold change (positive – red, negative – green). (E) Spearman correlation of AP-1/NR4A target genes (from TRANSFAC (AP-1) or Pei et al. (Pei et al., 2006) (NR4A)) with their corresponding transcription factors on day 1. For AP-1 the average expression of FOS/JUN was used, and for the NR4A family the average of NR4A1/2/3 was used to compute the correlation. Where calculated, comparisons between control and antibiotics-treated groups at specific time points were performed by Student’s t-tests. *p<0.05; **p<0.01; ***p<0.001; ****p<0.0001.
Figure 5.
Figure 5.. Impact of antibiotics administration and influenza vaccination on the blood metabolome
(A) Euclidean distance across the most variable metabolite features (coefficient of variation >8% across all time points) between the day 0 and screening (day −21) time point in control (blue) and antibiotics-treated (red) subjects. Error bars represent standard error of the mean (SEM). (B) Metabolic pathways significantly enriched following antibiotics administration. Mummichog software (Li et al., 2013) was used to identify enriched pathways (p<0.05 by permutation test) based on differential metabolite features (p<0.05 by Student’s t-test) between the day 0 and screening (day −21) time point in antibiotics-treated subjects. (C) Fold change of primary and secondary bile acids in antibiotics-treated subjects on days 0-7 relative to the screening time point (day −21). (D) Euclidean distance across the most variable metabolite features (coefficient of variation >8% across all time points) on days 1-7 post-vaccination relative to day 0 in control and antibiotics-treated subjects. Error bars represent standard error of the mean (SEM). (E) Metabolic pathways significantly enriched (p<0.05) following influenza vaccination in control and antibiotics-treated subjects. (F) Metabolic trajectories along the first two principal components for control and antibiotics-treated subjects for days 0-7 relative to the screening time point. Here metabolic trajectories refer to the trajectory of each subject according to the changes in abundance across all differential metabolite features (p<0.01) throughout the time course of the study (days 0-7) when projected in the principal component space. Where calculated, comparisons between control and antibiotics-treated groups at specific time points were performed by Student’s t-tests. *p<0.05; **p<0.01; ***p<0.001; ****p<0.0001. See also Figure S4 for comparison of responses in phases 1 and 2.
Figure 6.
Figure 6.. Perturbation of secondary bile acids is associated with elevated NLRP3 inflammasome signaling in antibiotics-treated subjects
(A) Circos plot showing the log2 fold change in secondary bile acids, antibiotics-induced BTMs (Figure 4A), and inflammasome signaling genes on days 0-7 relative to screening (day −21) in control and antibiotics-treated subjects. Lines indicate significant correlations (p<0.01, Pearson correlation across all time points). (B) Scatterplot of FOSB expression versus fold change of LCA in the plasma (all time points). Each dot represents one subject. (C-D) Fold change of genes in M35.0 in (C) antibiotics-treated and (D) control subjects. Each “edge” (gray line) represents a coexpression relationship; colors represent the day 1 versus screening (day −21) log2 fold change (positive – yellow, negative – blue). (E) Fold change of LCA in the plasma among antibiotics-treated (red) and control (blue) subjects. Each thin line represents a single subject, thick lines represent geometric means. See also Figure S4 for comparison of LCA fold changes in phases 1 and 2.
Figure 7.
Figure 7.. MMRN analysis suggests distinct functions of the gut microbiome in regulating inflammatory signaling and H1N1-specific IgG1 responses.
(A) Distribution of p values between the different data types included in the MMRN. (B) Sub-network visualization of the day 0 vs screening connections in the MMRN, containing nodes associated with either LCA or H1N1-specific IgG1. Each node is a cluster of features from one data type. The links between nodes (gray) were established by significant association (FDR < 0.05) using partial least square regression and permutation test. The network was queried through an enrichment based approach to identify positive (red) or negative (green) associations (FDR < 0.05, NES > 2.6) between antibiotics-induced (day 0 vs screening) changes in the nodes with either the day 0 vs screening change in LCA or the day 30 abundance of H1N1-specific IgG1. Individual cluster features are provided in Table S3. See Figure S5 and STAR Methods for details of MMRN construction. (C) Pie charts showing the family membership of OTUs within bacterial clusters B0, B1, and B4. (D) Scatterplots of plasma levels of LCA versus changes in bacterial load (measured by 16s rRNA qPCR), LPS, and flagellin (day 0 versus screening fold change). Each dot represents one subject. (E) Scatterplots of the day 7 and day 30 abundance of H1N1-specific IgG1 versus flagellin measured in the stool (day 0 versus screening fold change). Each dot represents one subject.

Comment in

References

    1. Agus A, Planchais J, and Sokol H (2018). Gut Microbiota Regulation of Tryptophan Metabolism in Health and Disease. Cell Host Microbe 23, 716–724. - PubMed
    1. Bakke D, and Sun J (2018). Ancient Nuclear Receptor VDR With New Functions: Microbiome and Inflammation. Inflamm Bowel Dis 24, 1149–1154. - PMC - PubMed
    1. Becattini S, Taur Y, and Pamer EG (2016). Antibiotic-Induced Changes in the Intestinal Microbiota and Disease. Trends Mol Med 22, 458–478. - PMC - PubMed
    1. Belkaid Y, and Hand TW (2014). Role of the microbiota in immunity and inflammation. Cell 157, 121–141. - PMC - PubMed
    1. Bray JR, and Curtis JT (1957). An Ordination of the Upland Forest Communities of Southern Wisconsin. Ecol Monogr 27, 326–349.

Publication types