. 2019 Sep 5;178(6):1421-1436.e24.
doi: 10.1016/j.cell.2019.08.002.

Single Amino Acid Change Underlies Distinct Roles of H2A.Z Subtypes in Human Syndrome

Affiliations

Single Amino Acid Change Underlies Distinct Roles of H2A.Z Subtypes in Human Syndrome

Rachel S Greenberg et al. Cell. .

Abstract

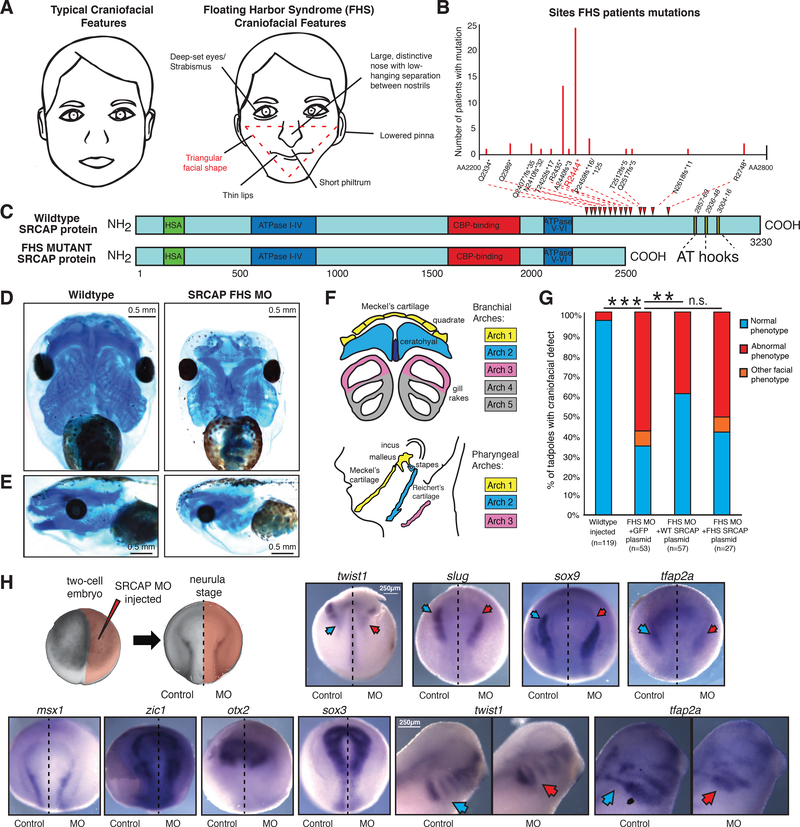
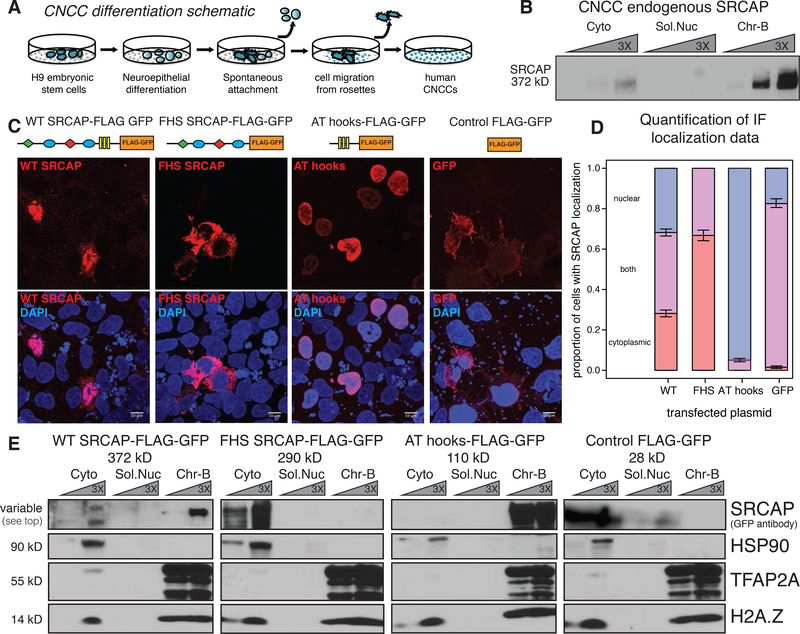
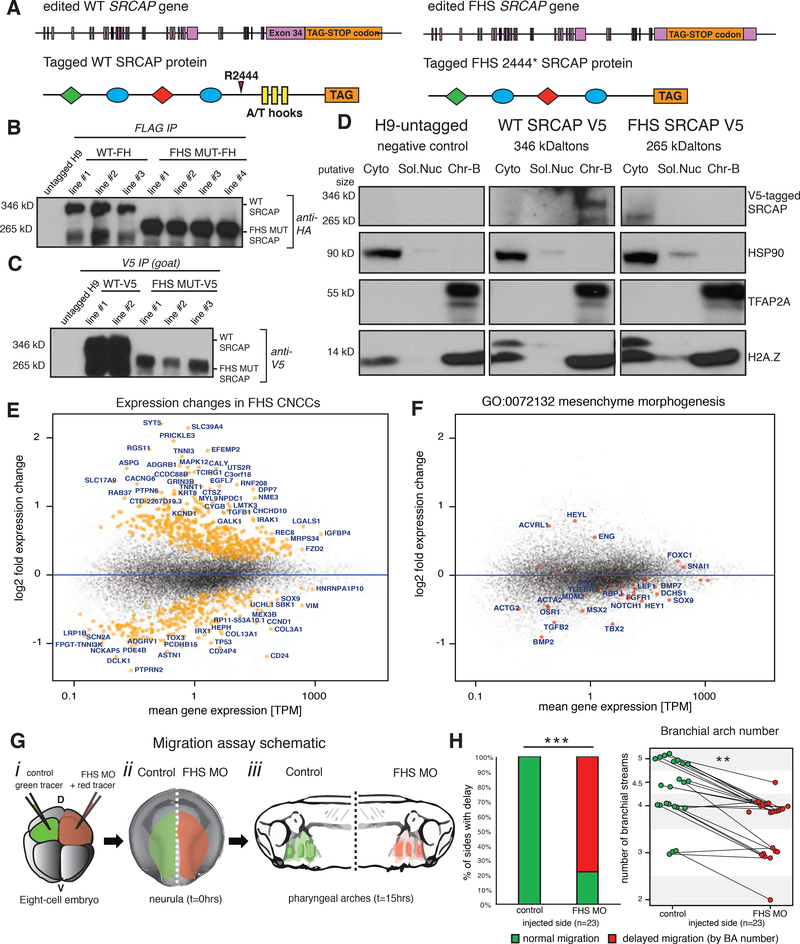
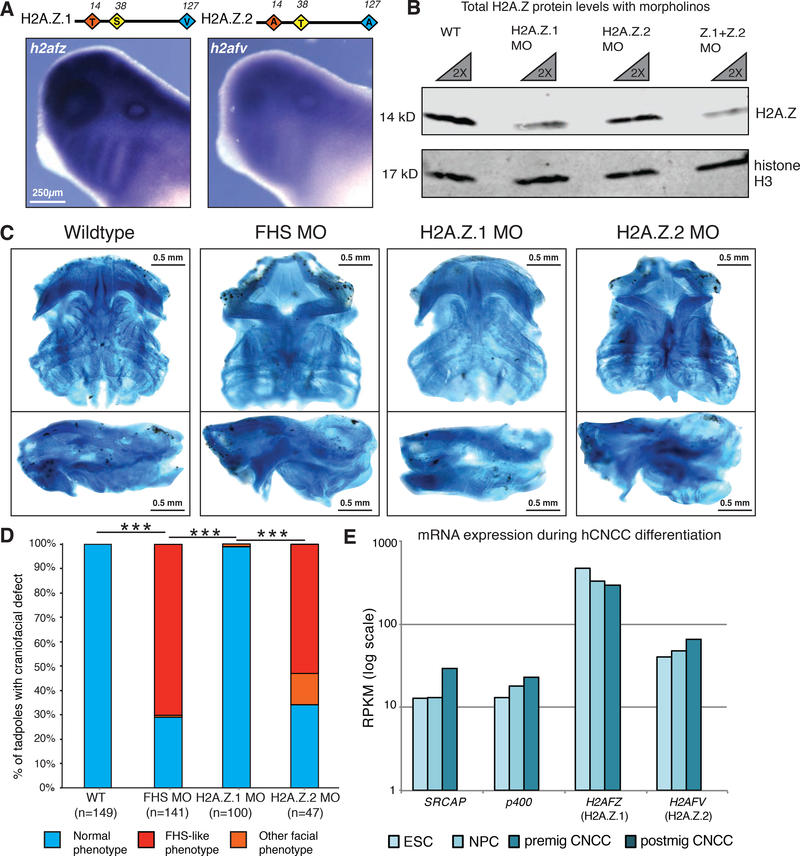
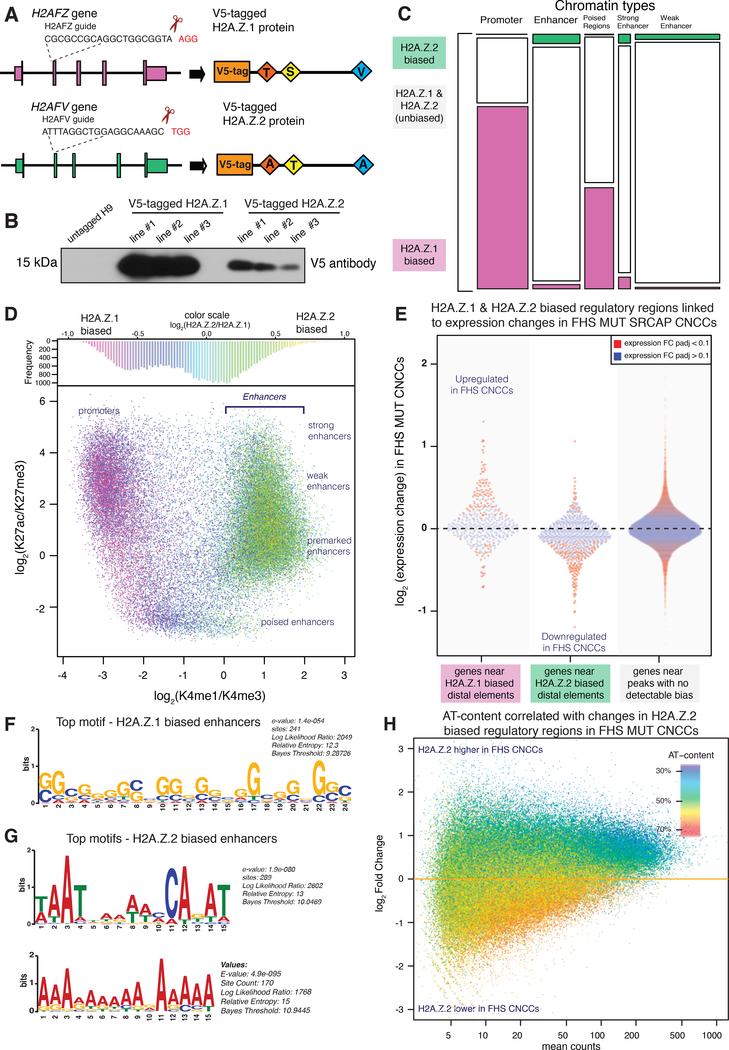
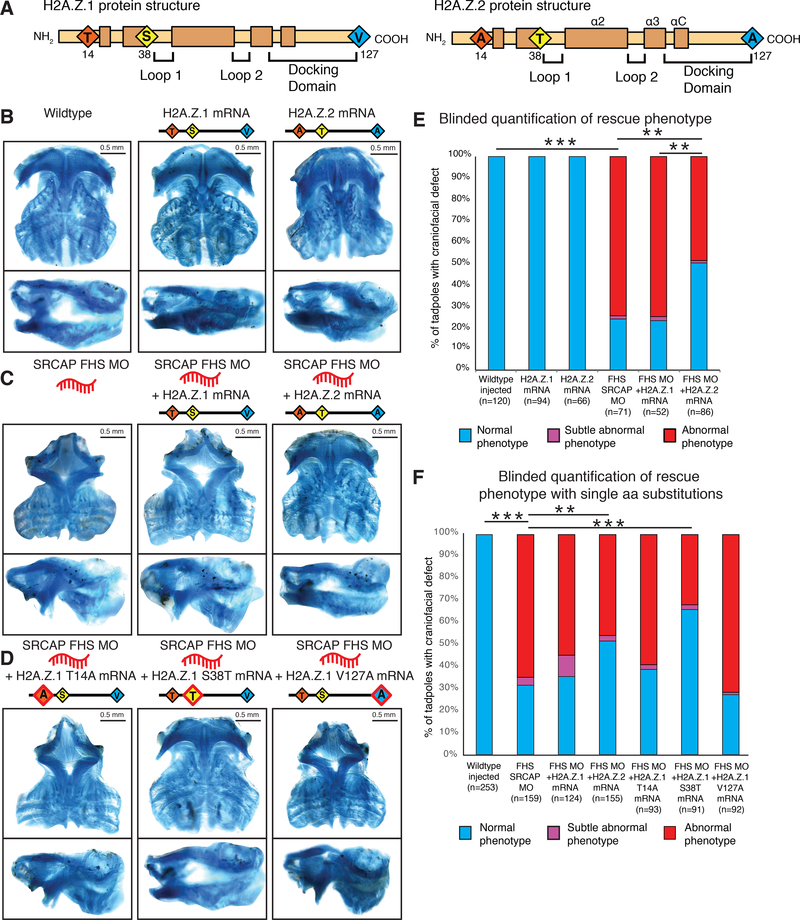
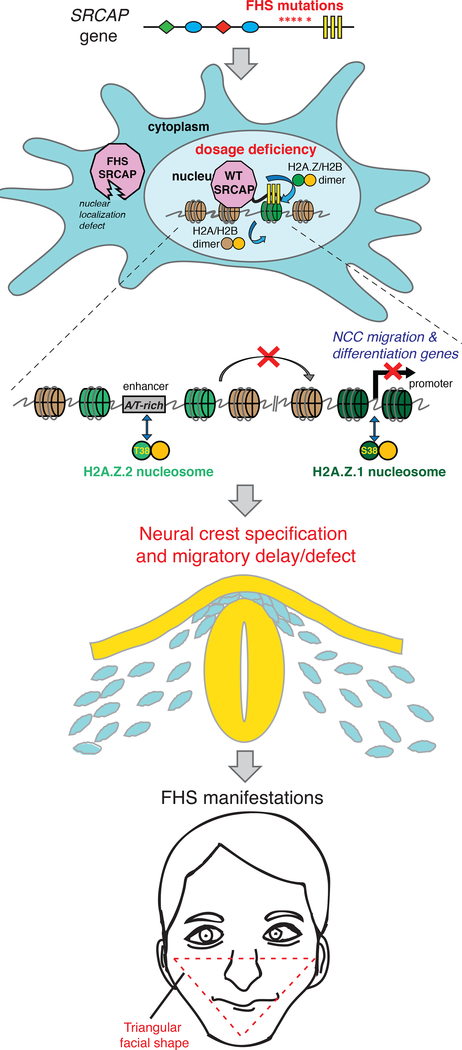
The developmental disorder Floating-Harbor syndrome (FHS) is caused by heterozygous truncating mutations in SRCAP, a gene encoding a chromatin remodeler mediating incorporation of histone variant H2A.Z. Here, we demonstrate that FHS-associated mutations result in loss of SRCAP nuclear localization, alter neural crest gene programs in human in vitro models and Xenopus embryos, and cause craniofacial defects. These defects are mediated by one of two H2A.Z subtypes, H2A.Z.2, whose knockdown mimics and whose overexpression rescues the FHS phenotype. Selective rescue by H2A.Z.2 is conferred by one of the three amino acid differences between the H2A.Z subtypes, S38/T38. We further show that H2A.Z.1 and H2A.Z.2 genomic occupancy patterns are qualitatively similar, but quantitatively distinct, and H2A.Z.2 incorporation at AT-rich enhancers and expression of their associated genes are both sensitized to SRCAP truncations. Altogether, our results illuminate the mechanism underlying a human syndrome and uncover selective functions of H2A.Z subtypes during development.

Keywords: H2A.Z; SRCAP; chromatin remodeler; craniofacial; enhancers; epigenetics; genetic mutation; histone variant; human disorder; neural crest.


Conflict of interest statement

Declaration of Interests

The authors declare no competing interests.

Figures

Figure 1.
Figure 1.. Recapitulating Floating-Harbor Syndrome in Xenopus laevis affects neural crest derived craniofacial structures
(A) Graphical representation of typical (left) and Floating-Harbor Syndrome (right) craniofacial features. Characteristic triangular facial shape (most characteristic and diagnostic feature) demarcated in red. (B) Plot of frequencies of SRCAP mutations in Floating-Harbor Syndrome probands. The x-axis goes from amino acid 2200 to 2800, and each mutation is denoted on this axis. The most frequent mutation R2444* is highlighted in red. (C) Schematic of wild type and the FHS truncated SRCAP proteins. The hot spot for FHS truncating mutations is indicated by red arrowheads. Protein domains are annotated with HSA in green, ATPase in blue, CBP-binding in red, AT-hooks in yellow. The amino acid scale is below the schematic. (D-E) Ventral (D) and side (E) view of X. laevis head with craniofacial cartilage stained with Alcian blue at stage 40, Wildtype (mock injected) and SRCAP FHS morphant (5.0 μM MO). 0.5 mm scale bar shown. Animals from n = 3 biologically independent experiments. (F) Diagram of homology between branchial arch structures in X. laevis to pharyngeal arches of the developing human face, with key homologous structures highlighted in matching colors. (G) Blinded quantification of rescue of characteristic craniofacial phenotype with co-injection of FHS MO and 200pg pB CAG GFP-FLAG, or pB CAG WT-SRCAP-GFP-FLAG, or pB CAG FHS-SRCAP-GFP-FLAG. Statistical test used was Fisher’s Exact Test (FET). FET p-value < 0.005 = **, FET p-value < 10e-5 = **, FET p-value > 0.05 = n.s. Animals from n=4 independent experiments. (H) Diagram of injection set up at two-cell stage and of asymmetrical FHS SRCAP MO expression at neurula stage. In situ hybridization at neurula stage for neural crest specification genes twist1, slug, and sox9 (abnormal phenotype in 9/11, 5/5, 5/6 embryos respectively), for neural crest induction and specification gene tfap2a (abnormal phenotype in 11/12 embryos), for neural plate border maintenance genes zic1 and msx1 (abnormal phenotype in 1/10, 0/6 embryos respectively), for early neural patterning gene otx2 and for neural plate gene sox3 (abnormal phenotype in 0/5, 1/5 embryos respectively), with 5.0 μM FHS MO injected on right side only, control on left. Ventral side shown, with anterior at top and posterior at bottom. 250μm scale bar shown for neurula images. In situ hybridization at tailbud stage (stage 28), with each pair of images from same animal (control image flipped in vertical plane). In situ probes twist1 and tfap2a (abnormal phenotype in 8/10, 11/13 embryos respectively) visualize neural crest migration. 250μm scale bar shown for tailbud images. Blue arrows denote normal gene expression pattern, red arrows denote impact on expression for FHS morphant. Image brightness and color adjusted to optimize visualization. See also Figure S1 and Table S1.
Figure 2.
Figure 2.. Nuclear localization and chromatin association defects of FHS SRCAP protein
(A) Schematic of differentiation of hESC to CNCCs. (B) Biochemical fractionation of human CNCCs with immunoblotting against endogenous SRCAP protein (Kerafast antibody). 1X, 3X, and 9X protein dilutions. Cyto – Cytoplasmic fraction, Sol.Nuc – soluble nuclear fraction, Chr-B- chromatin bound fraction. Predicted protein size on left. (C) Confocal microscopy of anti-GFP immunofluorescence staining of CNCCs overexpressing FLAG-GFP tagged WT SRCAP, FHS mutant SRCAP, SRCAP AT hooks, and FLAG-GFP alone (DAPI – Blue; tagged protein – Red). Bottom panel shows merged image with DAPI staining. 10μm scale bar. (D) Quantification of cellular localization of overexpression proteins with nucleus defined by DAPI signal; 95% confidence intervals from quasibinomial glm model. (E) Biochemical fractionation of CNCCs overexpressing FLAG-GFP tagged WT SRCAP, FHS mutant SRCAP, SRCAP AT hooks, FLAG-GFP alone with GFP antibody for SRCAP or control proteins, HSP90 to mark cytoplasmic fraction (Cyto), TFAP2A and pan-H2A.Z to mark chromatin-bound fraction (Chr-B). 1X and 3X dilution of each sample. See also Figure S2.
Figure 3.
Figure 3.. Engineered FHS SRCAP heterozygous human CNCCs show downregulation of critical migration and morphogenesis genes
(A) CRISPR/Cas9 targeting strategy for endogenous tagging and/or truncation of SRCAP gene using homologous recombination with ultramers to add FLAG-HA or V5 tag. (B) Validation of FLAG-HA tagged Wildtype SRCAP and FHS mutant CNCCs by whole cell immunoprecipitation for FLAG with immunoblotting against HA tag. Predicted protein size indicated on left. (C) Validation of V5 tagged Wildtype SRCAP and FHS mutant CNCCs by whole cell immunoprecipitation for V5 with immunoblotting also against V5 tag. Predicted protein size indicated on left. (D) Biochemical fractionation of CNCCs with untagged SRCAP (H9-untagged), endogenously V5-tagged WT SRCAP protein, endogenously V5-tagged FHS mutant SRCAP protein. Immunoblotting with mouse-V5 antibody. HSP90 in cytoplasmic fraction (Cyto), TFAP2A and pan-H2A.Z in chromatin-bound fraction (Chr-B). Predicted protein size on left. (E) Gene expression changes between SRCAP WT and FHS mutant CRISPR/Cas9 lines determined by RNA-seq (FLAG-HA tagged lines WT1–3 and FHS MUT1–4). Significant changes at FDR<0.1 denoted in orange. (F) Enrichment of genes involved in mesenchyme morphogenesis (GO term: 0072132) with gene denoted in red, gene names in blue. (G) Diagram of migration assay schematic. (i) injection into one dorsal cell at four-cell stage with 250pg red fluorescent tracer mCherry mRNA and 5.0μM FHS MO #1, injection of 250pg green fluorescent tracer Kaede mRNA into both animal pole-dorsal cells at eight-cell stage. (ii-iii) embryos with red and green fluorescence analyzed at neurula stage (time=0) and tailbud stage (time=15 hours), respectively. (H) Quantification of neural crest migratory delay. Statistical test used was Pearson’s chi-squared 2-sample test for equality of proportions with continuity correction. *** - p-value <2.2e-16. n=3 independent experiments. Normal migration in green, abnormal migration in red. Quantification of number of branchial arch streams, with lines matching number of arch streams from same embryo at time=15 hours. Statistical test used was two-sample Kolmogorov-Smirnov test. p-value = 0.003819. ** - p-value <0.005. Animals from n = 3 biologically independent experiments. See also Figure S3.
Figure 4.
Figure 4.. Knockdown of H2A.Z.2 phenocopies the craniofacial features of FHS morphant frogs
(A) Schematic of H2A.Z.1 and H2A.Z.2 proteins. Red, yellow, blue diamonds denote three amino acids divergent between H2A.Z.1 and H2A.Z.2. In situ hybridization staining for h2afz and h2afv mRNA at tailbud stage in wildtype X. laevis tadpoles. 250μm scale bar shown. (B) Western blot of cellular extract from dissected X. laevis at tailbud stage, with wildtype and 2.5 μM H2AFZ MO and 2.5 μM H2AFV MO samples used. Antibodies against total-H2A.Z and total histone H3 (loading control). 1X and 2X dilution of each sample. Imaged and quantified on LI-COR Odyssey (see supplemental figure). (C) Ventral and side views of dissected X. laevis cartilage stained with Alcian blue at stage 40, Wildtype (mock injected), SRCAP FHS morphant (SRCAP truncation) (5 μM), H2A.Z.1 morpholino (2.5 μM morpholino), H2A.Z.2 morpholino (2.5 μM morpholino). 0.5 mm scale bar shown. Animals from n = 3 biologically independent experiments. (D) Blinded quantification of characteristic craniofacial phenotype. Statistical test was Pearson’s chi-squared 2-sample test for equality of proportions with continuity correction. *** - p-value <2.2e-16. Animals from n=3 independent experiments. (E) mRNA expression of indicated genes (measured by RPKM) from hESCs, neural precursor cells (NPCs), pre-migratory neural crest cells (premig NCCs), and post-migratory neural crest cells (postmig NCCs) (Rada-Iglesias et al. 2012). See also Figure S4.
Figure 5.
Figure 5.. H2A.Z.2-biased regions are found at AT-rich enhancers near genes downregulated in FHS
(A) CRISPR/Cas9 targeting strategy in hESCs for endogenously V5-tagging N-terminus of H2A.Z.1 and H2A.Z.2 by homologous recombination. H2A.Z.1 in magenta, H2A.Z.2 in green. (B) Immunoblot against V5 tag for H2A.Z.1 lines 1–3 and H2A.Z.2 lines 1–3, untargeted H9s as negative control. (C) H2A.Z sites classified into five categories with k-means algorithm based on chromatin modifications and into H2A.Z.1-biased sites (green) or H2A.Z.2-biased sites (purple) based on V5-tag ChIP-seq data. (D) Distribution of H2A.Z.1/H2A.Z.2 ratio over CNCC regulatory element landscape. Upper panel: histogram of H2A.Z.1/H2A.Z.2 ratio distribution. Lower panel: scatter plot of regulatory regions, colored by H2A.Z.1/H2A.Z.2 ratio as in upper panel. x-axis: log ratio of H3K4me1 to H3K4me3 differentiating promoters from enhancer-like elements; y-axis: log ratio of H3K27ac to H3K27me3 reflecting region transcriptional activity and Polycomb silencing, respectively. (E) Genes in proximity of H2A.Z.2-biased regulatory regions downregulated in FHS CNCCs. 1D scatterplot of gene expression changes between WT and FHS SRCAP CNCCs for genes in proximity to H2A.Z.1-biased or H2A.Z.2-biased promoter-distal ChIP-seq peaks or genes with only unbiased elements in vicinity. Genes with RNA-seq differential expression analysis FDR<0.1 colored in red, others in blue. (F) Motif associated by MEME with H2A.Z.1 biased enhancers, using identified CNCC enhancers as background model (Bailey et al. 2009). (G) Primary and secondary motifs associated by MEME with H2A.Z.2 biased enhancers, using identified CNCC enhancers as background model (Bailey et al. 2009). (H) Association of changes in H2A.Z.2 incorporation for WT and FHS SRCAP CNCCs with DNA AT-content. Plot of H2A.Z.2 incorporation in FHS CNCCs compared to WT CNCCs with a range of AT-content from 30% (blue) to 50% (green) to 70% (red). X-axis is mean counts, normalized reads for each site with adjusted mean as base factor. See also Figure S5.
Figure 6.
Figure 6.. H2A.Z.2 but not H2A.Z.1 can rescue FHS in vivo due to a single amino acid substitution
(A) Schematic of H2A.Z.1 and H2A.Z.2 protein domains. Red, yellow, blue diamonds denote three amino acids divergent between H2A.Z.1 and H2A.Z.2. Structural domains including loop 1, loop 2 and docking domain in brackets and alpha helices are indicated. (B-D) Ventral and lateral views of dissected X. laevis cartilage Alcian blue stained at stage 40, and injected as schematically indicated above each image. 0.5 mm scale bar shown. All FHS MO #1 injected at 5.0 μM, all mRNA at 2.5ng each. (B) wildtype (mock injected), H2A.Z.1 mRNA overexpression and H2A.Z.2 mRNA overexpression. (C) SRCAP FHS MO #1, injected alone or with H2A.Z.1 mRNA or H2A.Z.2 mRNA. (D) SRCAP FHS MO #1, injected with H2A.Z.1 T14A mRNA, or H2A.Z.1 S38T mRNA, or H2A.Z.1 V127A mRNA. (E) Blinded quantification of characteristic craniofacial phenotype for FHS rescue with H2AZ.1 and H2AZ.2 mRNA. Statistical test was Fisher’s Exact Test (FET). FET p-value < 0.005 = **, FET p-value < 10e-5 = **. Animals from n = 3 biologically independent experiments. (F) Blinded quantification of characteristic craniofacial phenotype for FHS rescue with H2AZ subtypes and H2AZ.1 single amino acid substitution mRNA, includes samples from Fig. 6E. Statistical test was Pearson’s chi-squared 2-sample test for equality of proportions with continuity correction. FET p-value < 0.005 = **, FET p-value < 10e-5 = ***. Animals from n = 3 biologically independent experiments. See also Figure S6.
Figure 7.
Figure 7.. Proposed model of Floating-Harbor Syndrome and H2A.Z subtype specialization.
In FHS, heterozygous SRCAP mutation truncates the protein prior to DNA-binding AT-hooks, causing loss of SRCAP from nucleus and chromatin. With a diminished dose of functional SRCAP present in FHS, nuclear H2A.Z-remodeling activity is reduced. Genomic incorporation pattern of the two H2A.Z subtypes is qualitatively similar, but is biased towards promoters for H2A.Z.1 and AT-rich enhancers for H2A.Z.2. In FHS CNCCs, H2A.Z.2 is preferentially lost from AT-rich enhancers, and associated genes are downregulated. These sensitized regions regulate genes important for CNCC migration and differentiation. FHS patients have craniofacial anomalies related to defects in these developmental processes. See also Figure S7.

Comment in

  • The Face of Chromatin Variants.
    Flaus A, Owen-Hughes T. Flaus A, et al. Cell. 2019 Sep 5;178(6):1284-1286. doi: 10.1016/j.cell.2019.08.024. Cell. 2019. PMID: 31491382

Similar articles

Cited by

References

    1. Alexa A & Rahnenfuhrer J, 2018. topGO: Enrichment Analysis for Gene Ontology. R package version 2.34.0.
    1. Bailey TL et al., 2009. MEME SUITE: tools for motif discovery and searching. Nucleic acids research, 37(Web Server issue), pp.W202–8. - PMC - PubMed
    1. Bajpai R et al., 2010. CHD7 cooperates with PBAF to control multipotent neural crest formation. Nature, 463(7283), pp.958–962. - PMC - PubMed
    1. Betancur P, Bronner-Fraser M & Sauka-Spengler T, 2010. Assembling Neural Crest Regulatory Circuits into a Gene Regulatory Network. Annual Review of Cell and Developmental Biology, 26(1), pp.581–603. - PMC - PubMed
    1. Bhat N, Kwon H-J & Riley BB, 2013. A gene network that coordinates preplacodal competence and neural crest specification in zebrafish. Developmental Biology, 373(1), pp.107–117. - PMC - PubMed

Publication types

Supplementary concepts