

Dynamic photoacoustic imaging of neurovascular coupling in salivary glands
- PMID: 31491491
- PMCID: PMC6910936
- DOI: 10.1016/j.job.2019.08.002
Dynamic photoacoustic imaging of neurovascular coupling in salivary glands
Abstract
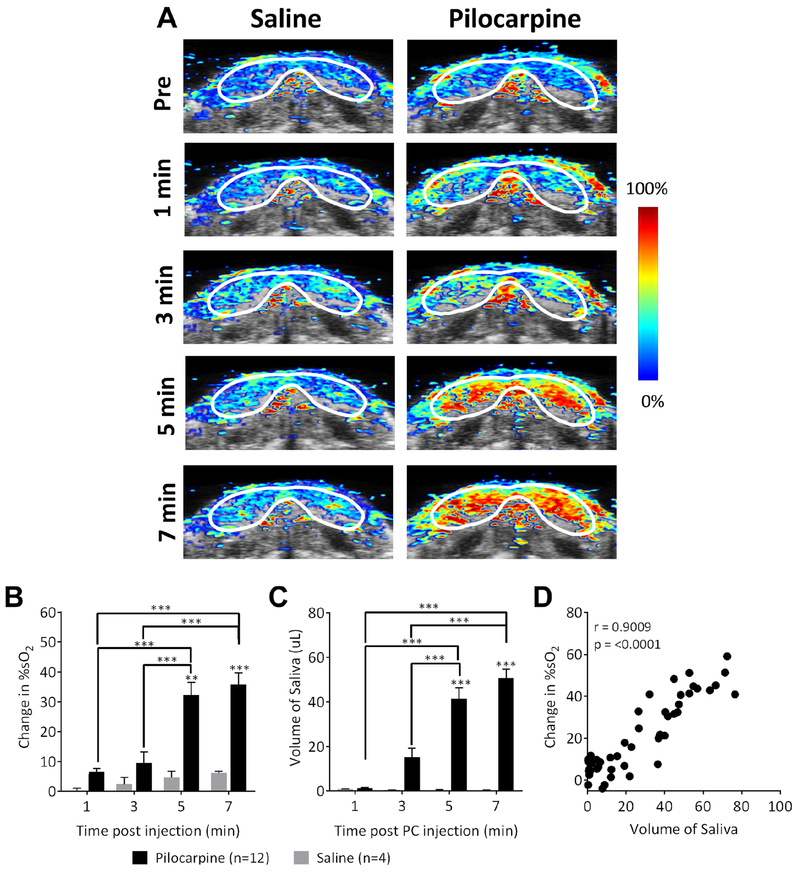
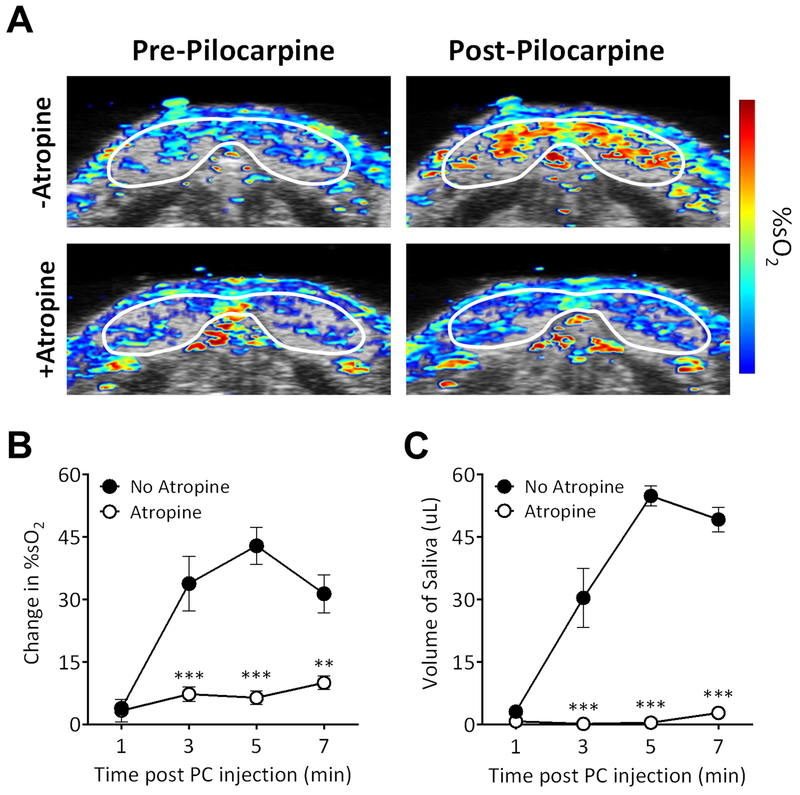
The purpose of this study was to apply photoacoustic imaging (PAI), a relatively new imaging method, to non-invasively map neurovascular dynamics in salivary glands. Dynamic PAI with co-registered ultrasound (US) was performed in mice to monitor salivary gland hemodynamics in response to exogenous muscarinic receptor stimulation (pilocarpine) and blockade (atropine). Pilocarpine increased salivary gland oxygen saturation (%sO2) within minutes after administration, which was abrogated by atropine. A significant correlation was observed between change in %sO2 measured by PAI and saliva secretion. PAI is a novel imaging method that can be used for functional assessment of neurovascular dynamics in salivary glands.
Keywords: Atropine; Pilocarpine; Salivary glands; Ultrasonography.
Copyright © 2019 Japanese Association for Oral Biology. Published by Elsevier B.V. All rights reserved.
Conflict of interest statement
Conflicts of interest
The authors declare no competing financial interests. The funding sponsors had no role in the design of the study, collection, analyses, or interpretation of data, writing of the manuscript, and in the decision to publish the results.
Figures

Similar articles
-
Photoacoustic imaging of salivary glands.Biomed Opt Express. 2015 Jul 31;6(9):3157-62. doi: 10.1364/BOE.6.003157. eCollection 2015 Sep 1. Biomed Opt Express. 2015. PMID: 26417488 Free PMC article.
-
Muscarinic receptor stimulation increases tolerance of rat salivary gland function to radiation damage.Int J Radiat Biol. 1997 Nov;72(5):615-25. doi: 10.1080/095530097143112. Int J Radiat Biol. 1997. PMID: 9374441
-
Effect of pilocarpine on substance P and calcitonin gene-related peptide releases correlate with salivary secretion in human saliva and plasma.J Clin Pharm Ther. 2013 Feb;38(1):19-23. doi: 10.1111/jcpt.12011. Epub 2012 Oct 2. J Clin Pharm Ther. 2013. PMID: 23030252 Clinical Trial.
-
The use of oral pilocarpine in xerostomia and Sjögren's syndrome.Semin Arthritis Rheum. 1999 Jun;28(6):360-7. doi: 10.1016/s0049-0172(99)80002-x. Semin Arthritis Rheum. 1999. PMID: 10406404 Review.
-
Current therapies for xerostomia and salivary gland hypofunction associated with cancer therapies.Support Care Cancer. 2003 Apr;11(4):226-31. doi: 10.1007/s00520-002-0409-5. Epub 2002 Oct 22. Support Care Cancer. 2003. PMID: 12673460 Review.
Cited by
-
Noninvasive Monitoring of Radiation-Induced Salivary Gland Vascular Injury.J Dent Res. 2023 Apr;102(4):412-421. doi: 10.1177/00220345221138533. Epub 2022 Dec 14. J Dent Res. 2023. PMID: 36515317 Free PMC article.
References
-
- Edgar WM. Saliva: its secretion, composition and functions. Br Dent J 1992;172:305–12. - PubMed
-
- Dawes C, Pedersen AM, Villa A, Ekström J, Proctor GB, Vissink A, Aframian D, McGowan R, Aliko A, Narayana N, Sia YW, Joshi RK, Jensen SB, Kerr AR, Wolff A. The functions of human saliva: A review sponsored by the World Workshop on Oral Medicine VI. Arch Oral Biol 2015;60:863–74. Review. - PubMed
-
- Proctor GB, Carpenter GH. Regulation of salivary gland function by autonomic nerves. Auton Neurosci. 2007;133:3–18. - PubMed
-
- Emmelin N Nerve interactions in salivary glands. J Dent Res 1987;66:509–17. - PubMed
-
- Proctor GB. The physiology of salivary secretion. Periodontol 2000 2016;70:11–25. - PubMed
Publication types
MeSH terms
Substances
Grants and funding
LinkOut - more resources
Full Text Sources
Other Literature Sources
