. 2019:23:101903.
doi: 10.1016/j.nicl.2019.101903. Epub 2019 Jun 18.

Finding maximally disconnected subnetworks with shortest path tractography

Affiliations

Finding maximally disconnected subnetworks with shortest path tractography

Clint Greene et al. Neuroimage Clin. 2019.

Abstract

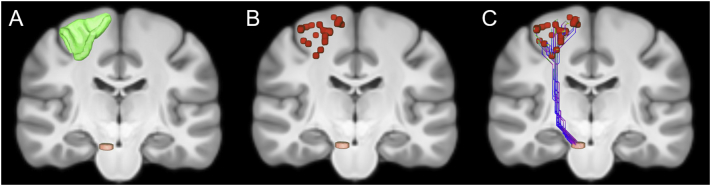
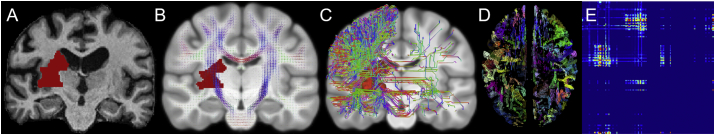
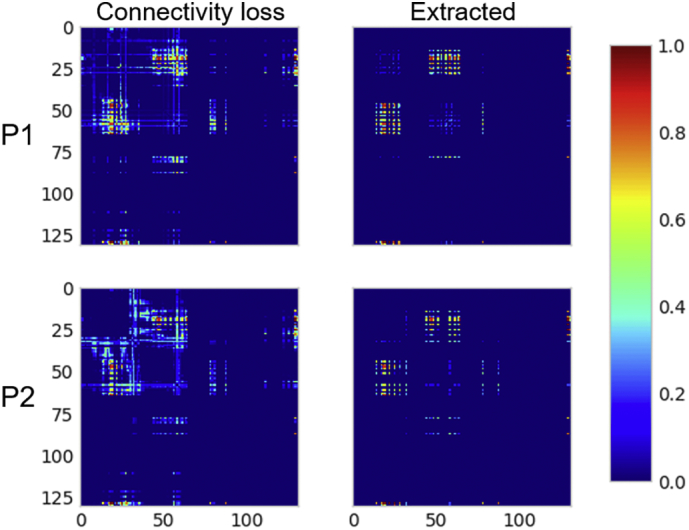
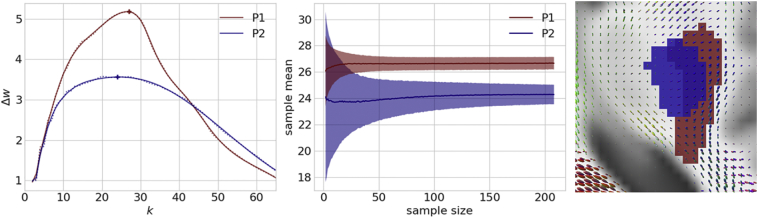
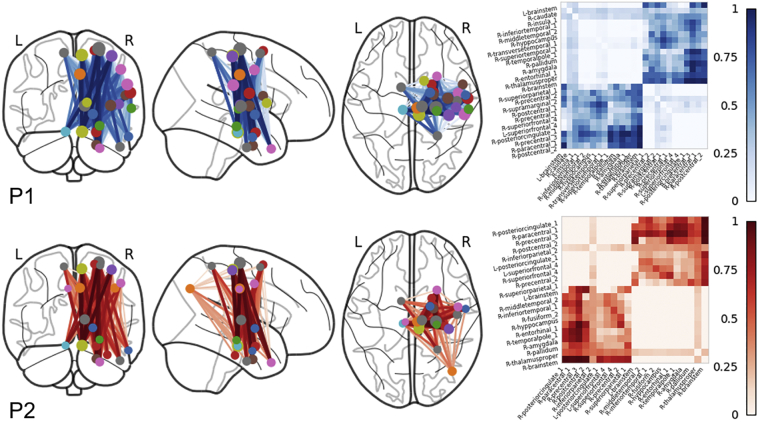
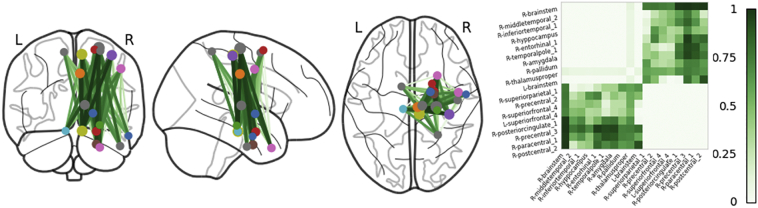
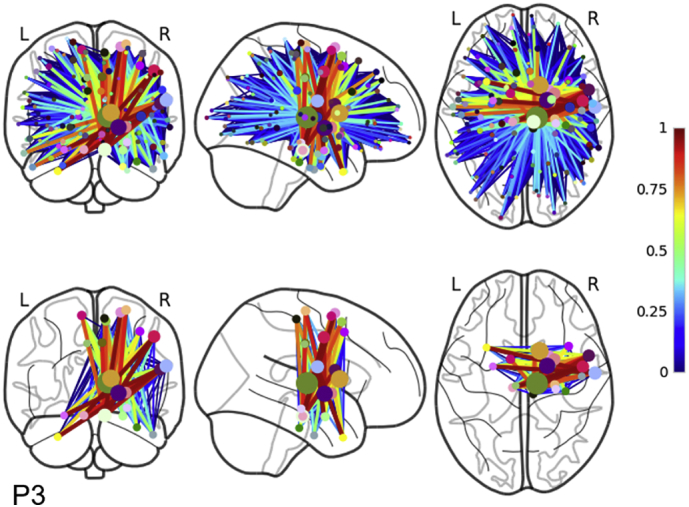
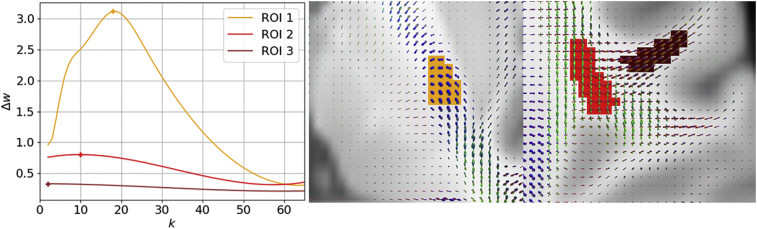
Connectome-based lesion symptom mapping (CLSM) can be used to relate disruptions of brain network connectivity with clinical measures. We present a novel method that extends current CLSM approaches by introducing a fast reliable and accurate way for computing disconnectomes, i.e. identifying damaged or lesioned connections. We introduce a new algorithm that finds the maximally disconnected subgraph containing regions and region pairs with the greatest shared connectivity loss. After normalizing a stroke patient's segmented MRI lesion into template space, probability weighted structural connectivity matrices are constructed from shortest paths found in white matter voxel graphs of 210 subjects from the Human Connectome Project. Percent connectivity loss matrices are constructed by measuring the proportion of shortest-path probability weighted connections that are lost because of an intersection with the patient's lesion. Maximally disconnected subgraphs of the overall connectivity loss matrix are then derived using a computationally fast greedy algorithm that closely approximates the exact solution. We illustrate the approach in eleven stroke patients with hemiparesis by identifying expected disconnections of the corticospinal tract (CST) with cortical sensorimotor regions. Major disconnections are found in the thalamus, basal ganglia, and inferior parietal cortex. Moreover, the size of the maximally disconnected subgraph quantifies the extent of cortical disconnection and strongly correlates with multiple clinical measures. The methods provide a fast, reliable approach for both visualizing and quantifying the disconnected portion of a patient's structural connectome based on their routine clinical MRI, without reliance on concomitant diffusion weighted imaging. The method can be extended to large databases of stroke patients, multiple sclerosis or other diseases causing focal white matter injuries helping to better characterize clinically relevant white matter lesions and to identify biomarkers for the recovery potential of individual patients.

Keywords: Brain injury; Brain networks; Connectomes; Diffusion MRI; Disconnection; Disconnectome; Graphs; Lesion symptom mapping; Spatial normalization; Tractography.


Figures

Fig. 1
Fig. 1
Illustration of subsampling. (A) The white matter surface of a portion of the left precentral region (green) containing 844 voxels is plotted with a portion of the brainstem (orange) containing 30 voxels. If all possible pairs of shortest paths were found between the regions there would be (844 × 30) = 25,320 shortest paths which would be a lengthy computation. The computation can be significantly sped up by employing a subsampling approach where the larger region is uniformly subsampled to obtain a subset of voxels such that the number of voxels in the subset matches the number of voxels in the smaller region. (B) 30 voxels subsampled from the larger precentral region are plotted in red. Every voxel in the subset is uniquely paired to a voxel in the smaller region, producing here 30 unique source-target pairings for shortest paths queries. (C) The 30 shortest paths found between voxels in the brainstem and precentral area trace out the CST. This procedure is performed for each normal HCP subject to generate unique sets of pairings and shortest paths for any given cortical region pair.
Fig. 2
Fig. 2
Schematic of patient disconnectome construction. (A) Lesioned tissue (red) is segmented on the patients' T1 weighted volume and (B) normalized into our high resolution T1 weighted template. (C) Shortest paths that intersect the patients' normalized lesion are found. (D) Region labels are then assigned to the end points of each of the shortest paths. For each shortest path making up a region pair, the probability of that shortest path is calculated and added to the running total of connective probability lost due to the lesion for that region pair. (E) The disconnectome is then computed as the fraction of connective probability loss relative to the total connectivity probability shared for any given region pair. (C)—(E) are performed 210 times for each set of shortest paths from each of the normal HCP subjects. The final connectivity loss matrix, Lstroke, is taken as the average of the 210 disconnectomes.
Fig. 3
Fig. 3
Quantitative metrics of structural disconnection. A disconnectome (Connectivity loss, left column) is shown for two patients (P1, P2). Connections in dark red exhibit 100% connectivity loss. Regions connections in dark blue were not impacted by the lesion. The set of connections extracted by our algorithm from the disconnectome forms the maximally disconnected subgraph (Extracted, right column). It consists of those connections between regions that exhibit a larger proportion of connectivity loss due to the lesion. Both patients have posterior limb-internal capsule lesions and remarkably similar disconnection subgraphs.
Fig. 4
Fig. 4
An algorithm to grow a maximal disconnection subgraph. On the left panel the average magnitude of the change in the total edge weight of the subgraph as it grows in the number of nodes k from 210 HCP subjects. In both patients a clear concave disconnection growth profile emerges, where initially the magnitude of the change grows rapidly until reaching the peak at koptimal. Patient 1 peaks at k = 27 (red cross) and patient 2 peaks at k = 24 (blue cross). After the peak, the change in total edge weight slowly drops off as additional nodes are added to the subgraph. In the middle panel, the reliability of koptimal is estimated. The standard deviation (shaded) around the mean drops exponentially as the number of subjects increases. P1's deviation curve drops quicker than P2's. With 100 or more subjects the sample mean converges with a standard deviation ≤1 of the koptimal estimated from 210 subjects. On the right the two patients normalized lesions are plotted on top of the HCP template brain (with average FODs). While both patient's lesions are nearly identical in size and in the right hemisphere, the profile for the first patient (red) peaks higher than the second blue) because their lesion extends across a more complex set of local diffusion directions where it intersects a larger number of paths.
Fig. 5
Fig. 5
Maximally disconnected subnetworks plotted on top of the glass brain along with the corresponding maximal disconnection matrices. Region ROIs are plotted as circles with the diameter reflecting the weighted degree of percent connectivity loss. The thicker the edge and the darker the color the greater the percent connectivity loss between the connecting regions. Major connectivity loss was found amongst pairs of precentral, postcentral, brainstem, pallidum, and thalamus in both patients (P1, P2). Most of the patients' identified disconnected regions are in the right hemisphere where the lesion occurred.
Fig. 6
Fig. 6
The disconnected core network is found by intersecting the two maximally disconnected subgraphs of the two stroke patients. The core is primarily comprised of brain regions in the right hemisphere involved in motor function with large percentages of connectivity loss amongst precentral, postcentral, superiorfrontal, brainstem, thalamus, and pallidum. Edge weights were taken as the average between the two patients for a given edge. This overlap in sensorimotor circuits is consistent with the fact that the patients were both selected because of similar clinical features of hemiparesis.
Fig. 7
Fig. 7
The full connectivity loss matrix plotted on the glass brain in the top panel. Many of the connections between cortical regions have a small loss in connectivity (blue) with only a small subset having a large or complete connectivity loss (orange—red). Our algorithm extracts the maximally disconnected subgraph filtering out connections and cortical regions with small losses of connectivity. The set of connections and cortical regions experiencing large shared connectivity losses are plotted in the bottom panel on the glass brain. Most of these remaining connections are in the right hemisphere and cluster around the lesion.
Fig. 8
Fig. 8
The impact of lesion location on subgraph size, independent of lesion size. On the left the magnitude of the change in the total edge weight of the subgraph as it grows in the number of nodes k is plotted for each simulated lesion. On the right, are the corresponding simulated lesion ROIs plotted on our HCP template brain. All the ROIs are 74 voxels in size. ROI 1 has an identical profile to the curves in Fig. 4 from patients' lesions and peaks at k = 18 (orange cross). ROI 2 and ROI 3 do not rise rapidly but slowly drop off in total edge weight once they reach their peaks at k = 10 (red cross) and k = 2 (brown cross) respectively. ROI 1 and ROI 3 are comprised of single population fibers while ROI 2 is comprised of a crossing fiber population.
Fig. 9
Fig. 9
On the left connectivity loss matrices estimated from shortest paths found for the full set of combinations of interface voxel pairs for two patients. On the right are connectivity loss matrices estimated from shortest paths found for only a subsampled set of interface voxel pairs. The matrices in the left and right columns are virtually indistinguishable from each other in the same patient. The Spearman correlation between the full and subsampled connectivity loss matrices for both patients is 0.99.
Fig. 10
Fig. 10
Change in the weight of the k-heaviest subgraph at each iteration of k. profiles are plotted for both patients from full and subsampled constructed connectivity matrices. The full and subsampled profiles in each patient have a concave structure and are again virtually indistinguishable from each other. In both patients, the full and subsampled profiles have a Spearman correlation coefficient of 0.99 and peak at the same koptimal.
Fig. 11
Fig. 11
On the left the weight of the subgraph for each iteration of k up to k = 15 is plotted for the greedy solution and the exact solution for three stroke patients. Patient 3 (red) weights do not reach as large of a weight at k = 15 compared to Patient 4 (green) and Patient 5 (blue). Patient 3's lesion is only 132 voxels compared to the large lesions of Patient 4's at 8498 voxels and Patient 5's at 5624 voxels. Unity dashes line is in gray. The change in the total edge weight of the subgraph as it grows in the number of nodes k for our greedy approach and exact solution grows larger for larger lesions Patient's 4 & 5 compared to small lesions like with Patient 3. The dice overlap for the set of nodes from the exact subgraph and our greedy subgraph for each iteration of k is plotted on the right. Initially, the agreement is poor but as k increases the agreement is excellent. The dice overlap for Patient 3 and Patient 4 is 1.0 at k = 15 and 0.87 for Patient 5.
Unlabelled Image

Similar articles

Cited by

References

    1. Abraham Alexandre. Machine learning for neuroimaging with scikit-learn. Fron. Neuroinformatics. 2014;8:14. - PMC - PubMed
    1. Avants Brian B. The optimal template effect in hippocampus studies of diseased populations. Neuroimage. 2010;49(3):2457–2466. - PMC - PubMed
    1. Baldassarre A., Ramsey L., Rengachary J., Zinn K., Siegel J.S., Metcalf N.V., Strube M.J., Snyder A.Z., Corbetta M., Shulman G.L. Dissociated functional connectivity profiles for motor and attention deficits in acute right-hemisphere stroke. Brain. 2016;139:2024–2038. - PMC - PubMed
    1. Binkofski F., Seitz R.J., Hackländer T., Pawelec D., Mau J., Freund H.J. Recovery of motor functions following hemiparetic stroke: a clinical and magnetic resonance-morphometric study. Cerebrovasc. Dis. 2001;11:273–281. - PubMed
    1. Carter Alex R., Shulman Gordon L., Corbetta Maurizio. Why use a connectivity-based approach to study stroke and recovery of function? Neuroimage. 2012;62(4):2271–2280. - PMC - PubMed

Publication types