. 2019 Sep 5;8(9):326.
doi: 10.3390/plants8090326.

Distribution and Community Assembly of Trees Along an Andean Elevational Gradient

Affiliations

Distribution and Community Assembly of Trees Along an Andean Elevational Gradient

Samantha J Worthy et al. Plants (Basel). .

Abstract

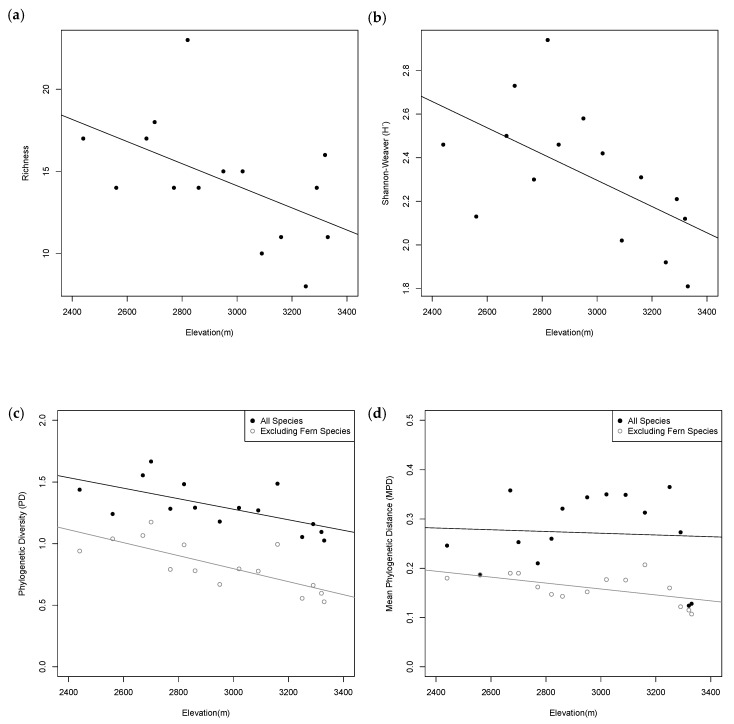
Highlighting patterns of distribution and assembly of plants involves the use of community phylogenetic analyses and complementary traditional taxonomic metrics. However, these patterns are often unknown or in dispute, particularly along elevational gradients, with studies finding different patterns based on elevation. We investigated how patterns of tree diversity and structure change along an elevation gradient using taxonomic and phylogenetic diversity metrics. We sampled 595 individuals (36 families; 53 genera; 88 species) across 15 plots along an elevational gradient (2440-3330 m) in Ecuador. Seventy species were sequenced for the rbcL and matK gene regions to generate a phylogeny. Species richness, Shannon-Weaver diversity, Simpson's Dominance, Simpson's Evenness, phylogenetic diversity (PD), mean pairwise distance (MPD), and mean nearest taxon distance (MNTD) were evaluated for each plot. Values were correlated with elevation and standardized effect sizes (SES) of MPD and MNTD were generated, including and excluding tree fern species, for comparisons across elevation. Taxonomic and phylogenetic metrics found that species diversity decreases with elevation. We also found that overall the community has a non-random phylogenetic structure, dependent on the presence of tree ferns, with stronger phylogenetic clustering at high elevations. Combined, this evidence supports the ideas that tree ferns have converged with angiosperms to occupy the same habitat and that an increased filtering of clades has led to more closely related angiosperm species at higher elevations.

Keywords: Ecuador; community phylogenetics; montane forests; taxonomic metrics; tree diversity.


Conflict of interest statement

The authors declare no conflict of interest.

Figures

Figure 1
Figure 1
The richness of families, genera, and species within each plot in the transect established at the Siempre Verde Preserve, Imbabura Province, Ecuador.
Figure 2
Figure 2
Relationship between diversity metrics and elevation. (a) Correlation between richness and elevation (r = −0.53, p = 0.04). (b) Correlation between Shannon–Weaver diversity (H´) and elevation (r = −0.58, p = 0.02). (c) Correlation between observed phylogenetic diversity (PD) and elevation with tree ferns (r = −0.65, p = 0.01) and without tree ferns (r = −0.76, p = 0.001). (d) Correlation between observed mean pairwise distance (MPD) and elevation with tree ferns (r = −0.06, p = 0.82) and without tree ferns (r = −0.58, p = 0.02). (e) Correlation between observed mean nearest taxon distance (MNTD) and elevation with tree ferns (r = 0.10, p = 0.72) and without tree ferns (r = −0.13, p = 0.64).
Figure 2
Figure 2
Relationship between diversity metrics and elevation. (a) Correlation between richness and elevation (r = −0.53, p = 0.04). (b) Correlation between Shannon–Weaver diversity (H´) and elevation (r = −0.58, p = 0.02). (c) Correlation between observed phylogenetic diversity (PD) and elevation with tree ferns (r = −0.65, p = 0.01) and without tree ferns (r = −0.76, p = 0.001). (d) Correlation between observed mean pairwise distance (MPD) and elevation with tree ferns (r = −0.06, p = 0.82) and without tree ferns (r = −0.58, p = 0.02). (e) Correlation between observed mean nearest taxon distance (MNTD) and elevation with tree ferns (r = 0.10, p = 0.72) and without tree ferns (r = −0.13, p = 0.64).
Figure 3
Figure 3
Phylogenetic tree of all species that were used in phylogenetic analyses from the transect at Siempre Verde Preserve, Imbabura Province, Ecuador. Bootstrap values based on maximum likelihood are reported at the nodes.
Figure 4
Figure 4
Relationship between standardized effect sizes (SES) of mean pairwise diversity (MPD) and mean nearest taxon distance (MNTD) and elevation with tree ferns excluded. (a) Black Line: Correlation between SES.MPD and elevation for all plots (r = 0.39, p = 0.15); Red Line: Correlation between SES.MPD and elevation when plots at 3090 m and 3160 m were excluded (r = 0.59, p = 0.03). (b) Black Line: Correlation between SES.MNTD and elevation for all plots (r = 0.28, p = 0.32); Red Line: Correlation between SES.MNTD and elevation when plots at 3090 m and 3160 m were excluded (r = 0.64, p = 0.02). Dots corresponding to the removed plots are noted with an *.

Similar articles

Cited by

References

    1. MacArthur R.H. Geographical Ecology: Patterns in the Distribution of Species. Princeton University Press; Princeton, NJ, USA: 1984.
    1. Stevens G.C. The elevational gradient in altitudinal range: An extension of Rapoport’s latitudinal rule to altitude. Am. Nat. 1992;140:893–911. doi: 10.1086/285447. - DOI - PubMed
    1. Brown J.H. Macroecology. The University of Chicago Press; Chicago, IL, USA: 1995.
    1. Acharya B.K., Chettri B., Vijayan L. Distribution of patterns of trees along an elevation gradient of Eastern Himalaya, India. Acta Oceanol. 2011;37:329–336. doi: 10.1016/j.actao.2011.03.005. - DOI
    1. Arellano G., Macía M.J. Local and regional dominance of woody plants along an elevational gradient in a tropical montane forest of northwestern Bolivia. Plant Ecol. 2014;215:39–54. doi: 10.1007/s11258-013-0277-8. - DOI

LinkOut - more resources