. 2019 Sep 5;17(9):521.
doi: 10.3390/md17090521.

First Results from a Screening of 300 Naturally Occurring Compounds: 4,6-dibromo-2-(2',4'-dibromophenoxy)phenol, 4,5,6-tribromo-2-(2',4'-dibromophenoxy)phenol, and 5-epi-nakijinone Q as Substances with the Potential for Anticancer Therapy

Affiliations

First Results from a Screening of 300 Naturally Occurring Compounds: 4,6-dibromo-2-(2',4'-dibromophenoxy)phenol, 4,5,6-tribromo-2-(2',4'-dibromophenoxy)phenol, and 5-epi-nakijinone Q as Substances with the Potential for Anticancer Therapy

Saskia Mayer et al. Mar Drugs. .

Abstract

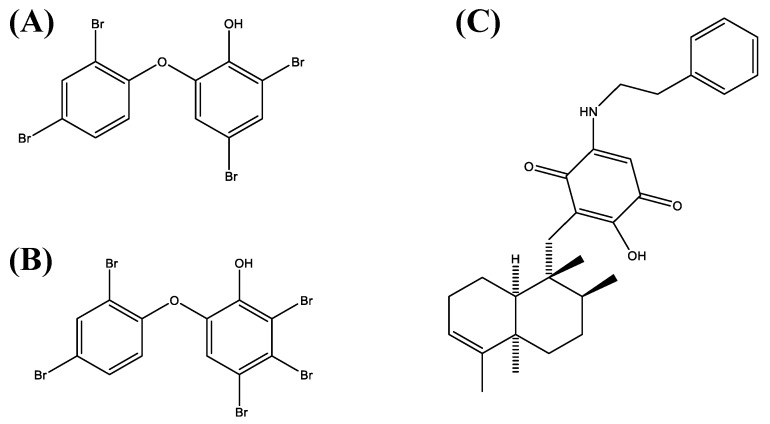
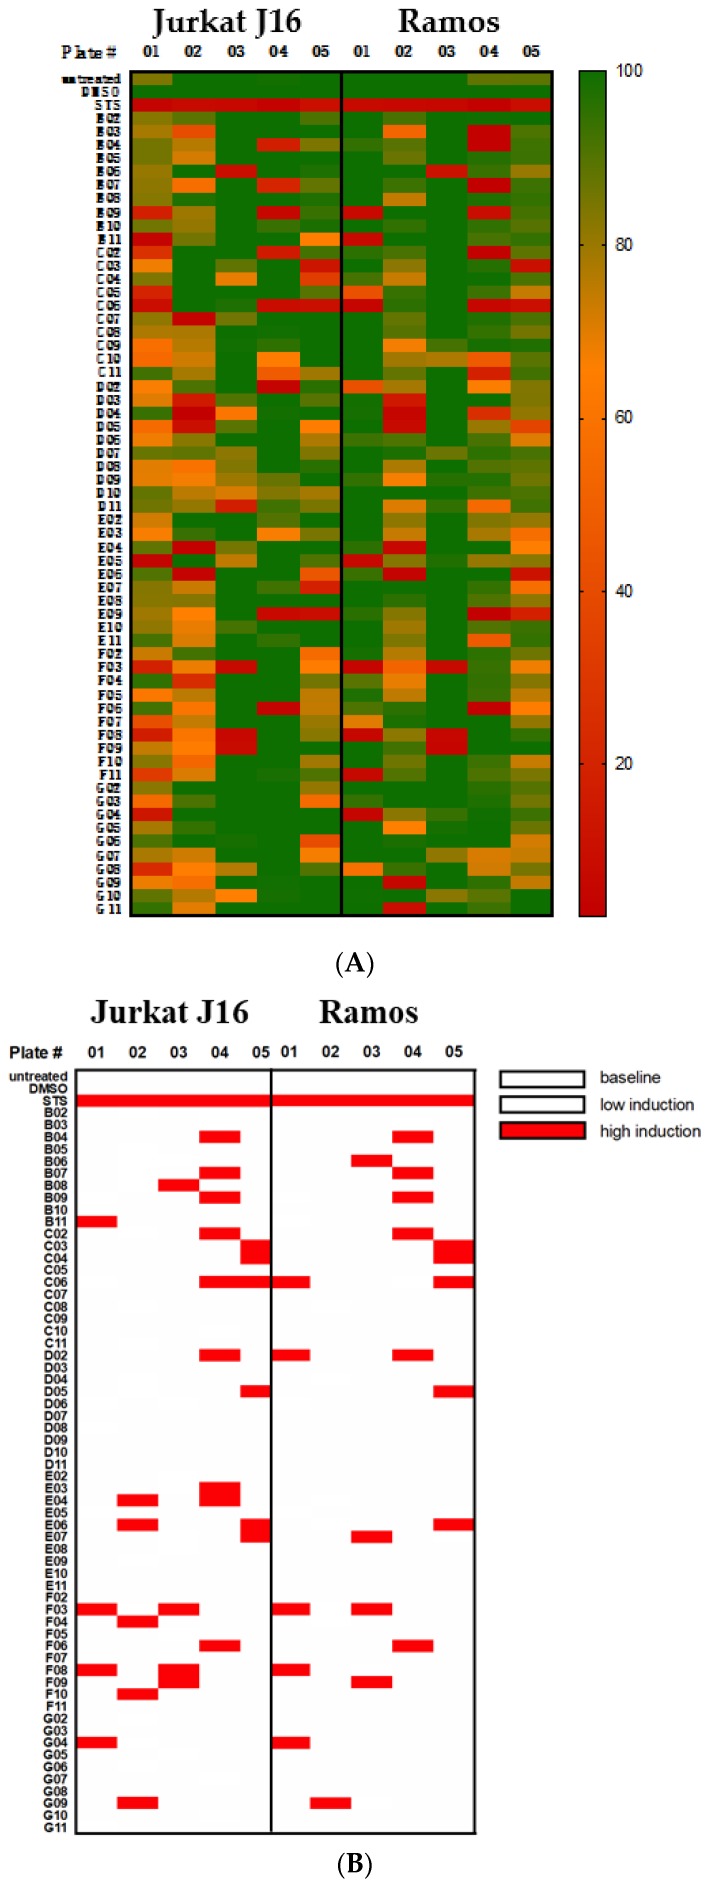
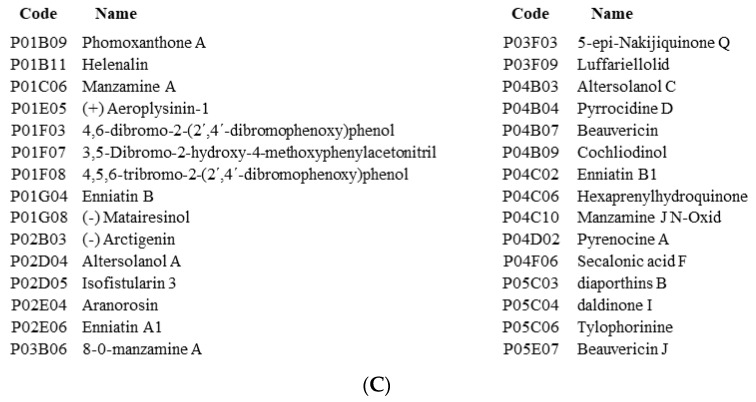
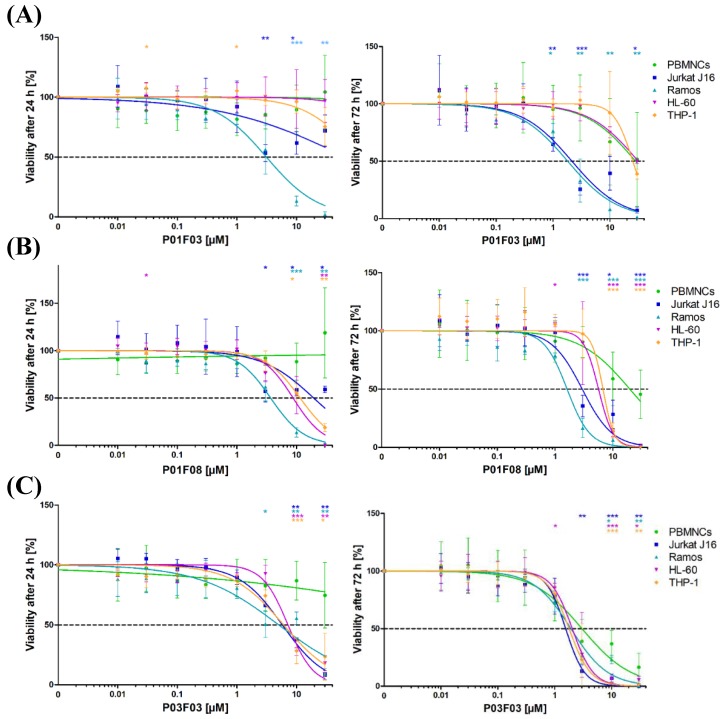
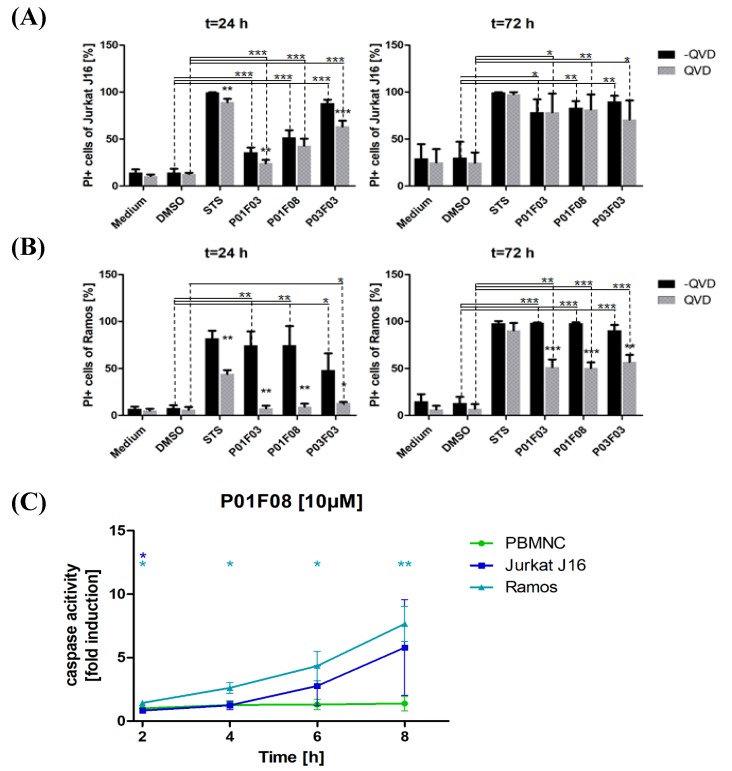
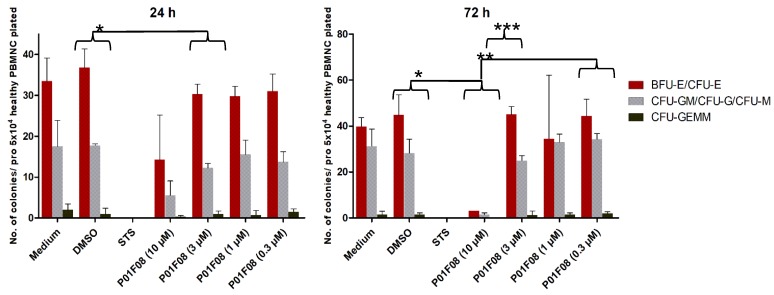
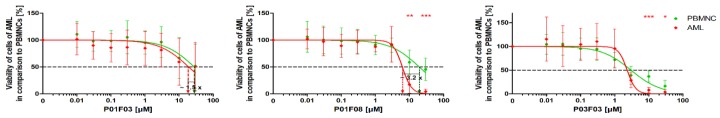
There is a variety of antineoplastic drugs that are based on natural compounds from ecological niches with high evolutionary pressure. We used two cell lines (Jurkat J16 and Ramos) in a screening to assess 300 different naturally occurring compounds with regard to their antineoplastic activity. The results of the compounds 4,6-dibromo-2-(2',4'-dibromophenoxy)phenol (P01F03), 4,5,6-tribromo-2-(2',4'-dibromophenoxy)phenol (P01F08), and 5-epi-nakijinone Q (P03F03) prompted us to perform further research. Using viability and apoptosis assays on the cell lines of primary human leukemic and normal hematopoietic cells, we found that P01F08 induced apoptosis in the cell lines at IC50 values between 1.61 and 2.95 μM after 72 h. IC50 values of peripheral blood mononuclear cells (PBMNCs) from healthy donors were higher, demonstrating that the cytotoxicity in the cell lines reached 50%, while normal PBMNCs were hardly affected. The colony-forming unit assay showed that the hematopoietic progenitor cells were not significantly affected in their growth by P01F08 at a concentration of 3 μM. P01F08 showed a 3.2-fold lower IC50 value in primary leukemic cells [acute myeloid leukemia (AML)] compared to the PBMNC of healthy donors. We could confirm the antineoplastic effect of 5-epi-nakijinone Q (P03F03) on the cell lines via the induction of apoptosis but noted a similarly strong cytotoxic effect on normal PBMNCs.

Keywords: acute myeloid leukemia; apoptosis; bioactive natural products; cytotoxic activity; drug leads; marine sponge derived natural products; peripheral blood mononuclear cells; polybrominated diphenyl ethers; primary leukemic cells; sesquiterpene aminoquinone.


Conflict of interest statement

The authors declare no conflict of interest.

Figures

Figure 1
Figure 1
Structural formula of (A) 4,6-dibromo-2-(2′,4′-dibromo-phenoxy)phenol (P01F03), (B) 4,5,6-tribromo-2-(2′,4′-dibromophenoxy)phenol (P01F08), and (C) 5-epi-Nakijinone Q (P03F03) (all provided by the Institute of Pharmaceutical Biology and Biotechnology, Heinrich Heine University, Düsseldorf, Germany).
Figure 2
Figure 2
Cytotoxic effect (A) and apoptosis induction (B) of 300 natural compounds on Jurkat J16 and Ramos. Compound codes are composed of Plate # (columns P01-P05) and individual well labeling (row B02-G11). (A) MTT assay after 72 h of incubation with 10 µM of each compound. Untreated, staurosporine treated (STS, 10 μM) and DMSO treated (0.1% v/v) cells were used as control. Viability is indicated by color scale ranging from green (100% viability) to red (0% viability). Viability was calculated from DMSO control. (B) Measurement of caspase-3 activation after treatment with different natural compounds (10 µM) for 8 h. Fold induction was calculated by the DMSO control. (C) Compounds that were shown to be cytotoxic in our screening (compound code with corresponding name). Further names can be provided on request.
Figure 2
Figure 2
Cytotoxic effect (A) and apoptosis induction (B) of 300 natural compounds on Jurkat J16 and Ramos. Compound codes are composed of Plate # (columns P01-P05) and individual well labeling (row B02-G11). (A) MTT assay after 72 h of incubation with 10 µM of each compound. Untreated, staurosporine treated (STS, 10 μM) and DMSO treated (0.1% v/v) cells were used as control. Viability is indicated by color scale ranging from green (100% viability) to red (0% viability). Viability was calculated from DMSO control. (B) Measurement of caspase-3 activation after treatment with different natural compounds (10 µM) for 8 h. Fold induction was calculated by the DMSO control. (C) Compounds that were shown to be cytotoxic in our screening (compound code with corresponding name). Further names can be provided on request.
Figure 3
Figure 3
Cytotoxicity in cell lines Jurkat J16, Ramos, HL-60, and THP-1 and on healthy peripheral blood mononuclear cells (PBMNCs). MTT assay (viability) of Jurkat J16, Ramos, HL-60, and THP-1 and healthy PBMNCs after 24 h and 72 h of incubation with the compounds. (A) 4,6-dibromo-2-(2′,4′-dibromophenoxy)phenol (P01F03); (B) 4,5,6-tribromo-2-(2′,4′-dibromophenoxy)phenol (P01F08); and (C) 5-epi-Nakijinone Q (P03F03). The data are shown as mean ± SD of three individual experiments in cell lines (Jurkat J16, Ramos, HL-60, THP-1), five individual experiments in PBMNCs after 24 h incubation, and nine individual experiments in PBMNCs after 72 h incubation. All experiments were performed in triplicates. The values are normalized to staurosporine (STS, 10 μM) and DMSO (0.1% v/v). Welch’s t-test was used to detect statistically significant differences between PBMNCs and cell lines. Statistical significance was established at asterisks displaying p-values * p < 0.05, ** p < 0.01, *** p < 0.001.
Figure 4
Figure 4
Propidium iodide (PI) uptake in the cell lines (A) Jurkat J16 and (B) Ramos with and without caspase inhibitor Q-VD-OPh (QVD) with 10 µM of each compound and incubation times of 24 h and 72 h. The results are shown as mean ± SD of three independent experiments, which were performed in triplicates. Welch’s t-test was used to detect statistically significant differences. Significance between treated and untreated groups is indicated with asterisks above the columns. Significance between DMSO and different cells is shown with asterisks on lines above displaying p-values * p < 0.05, ** p < 0.01, *** p < 0.001. (C) Kinetics of caspase-3 activity in PBMNCs and in cell lines Jurkat J16 and Ramos after the stimulation for up to 8 h with 4,5,6-tribromo-2-(2′,4′-dibromophenoxy)phenol (P01F08). The results are shown as mean ± SD of triplicates. The values are normalized to DMSO. Welch’s t-test was used to detect statistically significant differences between PBMNCs and cell lines and are established at asterisks displaying p-values * p < 0.05, ** p < 0.01, *** p < 0.001.
Figure 5
Figure 5
Colony forming units (CFU) assay with PBMNCs after 24 h and 72 h of treatment with 4,5,6-tribromo-2-(2′,4′-dibromophenoxy)phenol (P01F08) in different concentrations. The bars represent the mean ± SD of two patient samples performed in duplicates. Colonies were differentiated in red precursors (colony-forming unit-erythroid, CFU-E; burst-forming unit-erythroid, BFU-E), white precursors (colony-forming unit-granulocyte, -monocyte, CFU-GM; colony-forming unit-granulocyte; CFU-G; colony-forming unit-monocyte, CFU-M), and colony-forming unit-granulocyte, -erythrocyte, -monocyte, -megakaryocyte (CFU-GEMM) by light microscopy. Welch’s t-test was used to detect statistically significant differences between all colonies of DMSO and the different concentration of P01F08. Statistical significance was established at asterisks display p-values * p < 0.05, ** p < 0.01, *** p < 0.001, **** p < 0.0001.
Figure 6
Figure 6
Cytotoxicity on primary malignant cells obtained from patients with AML. MTT assays (viability) of cells from patients with acute myeloid leukemia (n = 6) in comparison to cells from healthy donors (n = 9), as previously shown in Figure 3, after 72 h of incubation with compounds 4,6-dibromo-2-(2′,4′-dibromophenoxy)phenol (P01F03), 4,5,6-tribromo-2-(2′,4′-dibromophenoxy)phenol (P01F08), and 5-epi-Nakijinone Q (P03F03). The results are shown as mean ± SD of the experiments performed in triplicates. The values are normalized to staurosporine (STS, 10 μM) and DMSO (0.1% v/v). Welch’s t-test was used to detect statistically significant differences between healthy PBMNCs and AML cells. Statistical significance was established at asterisks display p-values * p < 0.05, ** p < 0.01, *** p < 0.001.

Similar articles

Cited by

References

    1. Global Burden of Disease Cancer Collaboration. Fitzmaurice C., Akinyemiju T.F., Al Lami F.H., Alam T., Alizadeh-Navaei R., Allen C., Alsharif U., Alvis-Guzman N., Amini E., et al. Global, Regional, and National Cancer Incidence, Mortality, Years of Life Lost, Years Lived with Disability, and Disability-Adjusted Life-Years for 29 Cancer Groups, 1990 to 2016: A Systematic Analysis for the Global Burden of Disease Study. JAMA Oncol. 2018;4:1553–1568. - PMC - PubMed
    1. Blackadar C.B. Historical review of the causes of cancer. World J. Clin. Oncol. 2016;7:54–86. doi: 10.5306/wjco.v7.i1.54. - DOI - PMC - PubMed
    1. Brown S.A., Sandhu N., Herrmann J. Systems biology approaches to adverse drug effects: The example of cardio-oncology. Nat. Rev. Clin. Oncol. 2015;12:718–731. doi: 10.1038/nrclinonc.2015.168. - DOI - PubMed
    1. Moudi M., Go R., Yien C.Y.S., Nazre M. Vinca alkaloids. Int. J. Prev. Med. 2013;4:1231–1235. - PMC - PubMed
    1. Slichenmyer W.J., Von Hoff D.D. New natural products in cancer chemotherapy. J. Clin. Pharmacol. 1990;30:770–788. doi: 10.1002/j.1552-4604.1990.tb01873.x. - DOI - PubMed

LinkOut - more resources