. 2019 Sep 5;11(9):1309.
doi: 10.3390/cancers11091309.

RNA-Based Detection of Gene Fusions in Formalin-Fixed and Paraffin-Embedded Solid Cancer Samples

Affiliations

RNA-Based Detection of Gene Fusions in Formalin-Fixed and Paraffin-Embedded Solid Cancer Samples

Martina Kirchner et al. Cancers (Basel). .

Abstract

Oncogenic gene fusions are important drivers in many cancer types, including carcinomas, with diagnostic and therapeutic implications. Hence, sensitive and rapid methods for parallel profiling in formalin-fixed and paraffin-embedded (FFPE) specimens are needed. In this study we analyzed gene fusions in a cohort of 517 cases where standard treatment options were exhausted. To this end the Archer® DX Solid tumor panel (AMP; 285 cases) and the Oncomine Comprehensive Assay v3 (OCA; 232 cases) were employed. Findings were validated by Sanger sequencing, fluorescence in situ hybridization (FISH) or immunohistochemistry. Both assays demonstrated minimal dropout rates (AMP: 2.4%; n = 7/292, OCA: 2.1%; n = 5/237) with turnaround times of 6-9 working days (median, OCA and AMP, respectively). Hands-on-time for library preparation was 6 h (AMP) and 2 h (OCA). We detected n = 40 fusion-positive cases (7.7%) with TMPRSS2::ERG in prostate cancer being most prevalent (n = 9/40; 22.5%), followed by other gene fusions identified in cancers of unknown primary (n = 6/40; 15.0%), adenoid cystic carcinoma (n = 7/40; 17.5%), and pancreatic cancer (n = 7/40; 17.5%). Our results demonstrate that targeted RNA-sequencing of FFPE samples is feasible, and a well-suited approach for the detection of gene fusions in a routine clinical setting.

Keywords: NGS; carcinoma; gene fusion; solid tumor; targeted therapy.


Conflict of interest statement

Albrecht Stenzinger: Advisory board honoraria from Bayer, Novartis, BMS, AstraZeneca, ThermoFisher, Illumina; speaker´s honoraria from Takeda, Roche, BMS, Illumina, AstraZeneca, Novartis, ThermoFisher, Bayer, MSD and research funding from Chugai and BMS. Volker Endris: Advisory board honoraria from ThermoFisher; Speaker´s honoraria from AstraZeneca. Peter Schirmacher: Advisory board honoraria from Pfizer, Roche, Novartis and AstraZeneca; speaker´s honoraria and research funding from Roche, AstraZeneca and Novartis. Anna-Lena Volckmar: Funding from AstraZeneca for a talk. Alwin Krämer: Reimbursement of study-related traveling and molecular tumor board work by Roche. Tilman Bochtler: Reimbursement of study-related traveling and molecular tumor board work by Roche. The sponsors had no role in the design, execution, interpretation, or writing of the study. M.K., O.N., M.A., J.B., E.R., R.P., R.B., D.K., S.B.T., L.J., F.S., M.v.W. and C.S. declare no conflict of interest.

Figures

Figure 1
Figure 1
Study outline: Sample preparation and data analysis. Blue: Sample preparation steps used for the cohort sequenced with the Archer® DX Fusion Plex® Solid tumor panel (AMP). Green: Sample preparation steps used for the cohort sequenced with the Oncomine™ Comprehensive Assay v3 (OCA). Grey: Sample preparation steps used for both cohorts.
Figure 2
Figure 2
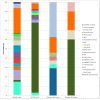
Frequencies of cancer types in the overall cohort as well as in the fusion positive cohort. (A) All tumor entities of the cohort sequenced with AMP. (B) All tumor entities of the cohort sequenced with OCA. (C) Tumor entities of the fusion positive cases sequenced with AMP. (D) Tumor entities of the fusion positive cases sequenced with OCA.
Figure 3
Figure 3
Frequency of gene fusions identified with AMP or OCA in the analyzed cancer types. Figure 3 shows the frequency of gene fusion positive cases identified with (A) the AMP or (B) the OCA assay in the different tumor entities.
Figure 4
Figure 4
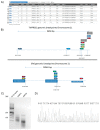
Representative results for an identified TMPRSS2::ERG fusion (case # AMP-25). (A) Typical Archer results screen for identified fusions. The patient #AMP-25 harbored 8 different fractions of TMPRSS2::ERG fusion transcripts. Due to molecular barcoding, all different fusion transcripts can be identified separately. (B) Schematic overview of the genomic breakpoints in the TMPRSS2 and ERG genes. The numbering of the different fusion splicing isoforms corresponds between Figure 4A and Figure 4B. (C) Agarose gel: Size separation of the reverse transcription PCR (RT-PCR) products from 2 samples positive for the TMPRSS2::ERG fusion tested by AMP. The amplicon size for this primer combination is 185 bp. The prominent band of sample #AMP-25 equal to the size of 200 bp was cut out, the DNA was isolated and the product sequenced. From left to right: 50 bp ladder, RT-PCR product case #AMP-24, RT-PCR product case #AMP-25, no template control. (D) Sanger sequencing: Part of the sequence from the cut out band; due to the multiple splicing forms, alignment with the human genome and transcriptome gave no clear result of one specific TMPRSS2::ERG fusion sequence.
Figure 5
Figure 5
Three cases with gene fusions detected by targeted RNA-sequencing. (A) Case: #AMP-3: Mammary analogue secretory carcinoma carrying an ETV6::NTRK3 fusion detected by AMP. The green and red bars above the reference sequence show which part of the transcript belongs to which gene; below the Sanger sequencing result of the ETV6 and NTRK3 fusion transcript is shown. Microphotographs of hematoxylin and eosin stain and immunohistochemical stain for anti- tropomyosin receptor tyrosine kinase (TRK). (B) Case: #AMP-4, from left to right: Sequence of a typical FGFR2 and INA fusion read detected by AMP; the green and red bars above the reference sequence show which part of the transcript belongs to which gene. Right: break apart detection of the fusion by FISH. (C) Case: #OCA-1, from left to right: Sequence of a typical BRD4 and NUTM1 fusion read detected by OCA in a NUT midline carcinoma; the green and red bar above the reference sequence show which part of the transcript belongs to which gene. Right: Microphotographs of hematoxylin and eosin stain and immunohistochemical stain for anti NUTM1.

References

    1. Rowley J.D. Letter: A new consistent chromosomal abnormality in chronic myelogenous leukaemia identified by quinacrine fluorescence and Giemsa staining. Nature. 1973;243:290–293. doi: 10.1038/243290a0. - DOI - PubMed
    1. Taub R., Kirsch I., Morton C., Lenoir G., Swan D., Tronick S., Aaronson S., Leder P. Translocation of the c-myc gene into the immunoglobulin heavy chain locus in human Burkitt lymphoma and murine plasmacytoma cells. Proc. Natl. Acad. Sci. USA. 1982;79:7837–7841. doi: 10.1073/pnas.79.24.7837. - DOI - PMC - PubMed
    1. Melo J.V. The molecular biology of chronic myeloid leukaemia. Leukemia. 1996;10:751–756. - PubMed
    1. Ewing J. The Classic: Diffuse endothelioma of bone. Proceedings of the New York Pathological Society. Clin. Orthop. Relat. Res. 2006;450:25–27. doi: 10.1097/01.blo.0000229311.36007.c7. - DOI - PubMed
    1. Koelsche C., Hartmann W., Schrimpf D., Stichel D., Jabar S., Ranft A., Reuss D.E., Sahm F., Jones D.T.W., Bewerunge-Hudler M., et al. Array-based DNA-methylation profiling in sarcomas with small blue round cell histology provides valuable diagnostic information. Mod. Pathol. 2018;31:1246–1256. doi: 10.1038/s41379-018-0045-3. - DOI - PMC - PubMed

LinkOut - more resources