

Cyanate Induces Oxidative Stress Injury and Abnormal Lipid Metabolism in Liver through Nrf2/HO-1
- PMID: 31491954
- PMCID: PMC6767610
- DOI: 10.3390/molecules24183231
Cyanate Induces Oxidative Stress Injury and Abnormal Lipid Metabolism in Liver through Nrf2/HO-1
Abstract
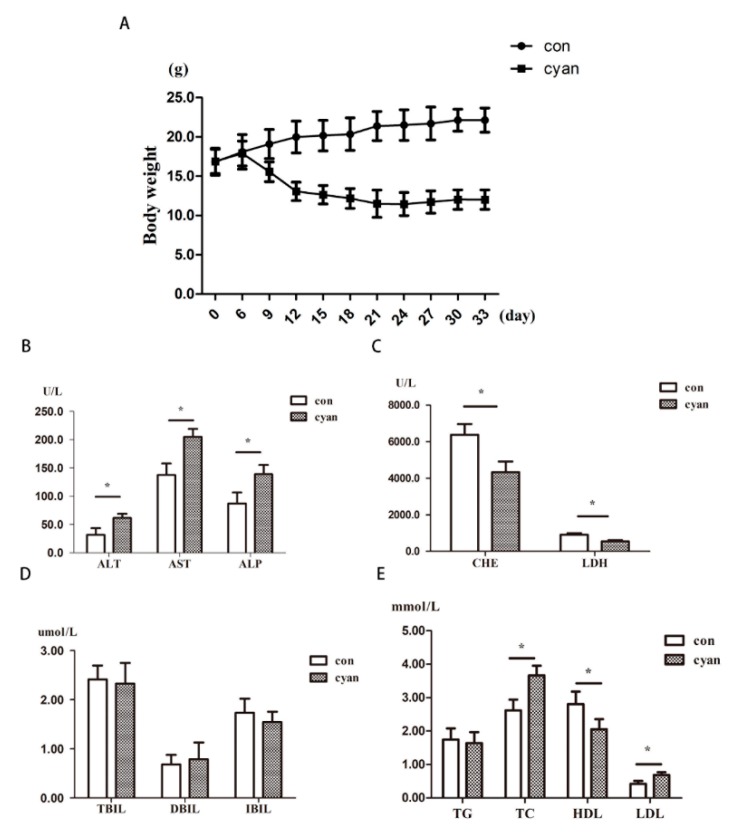
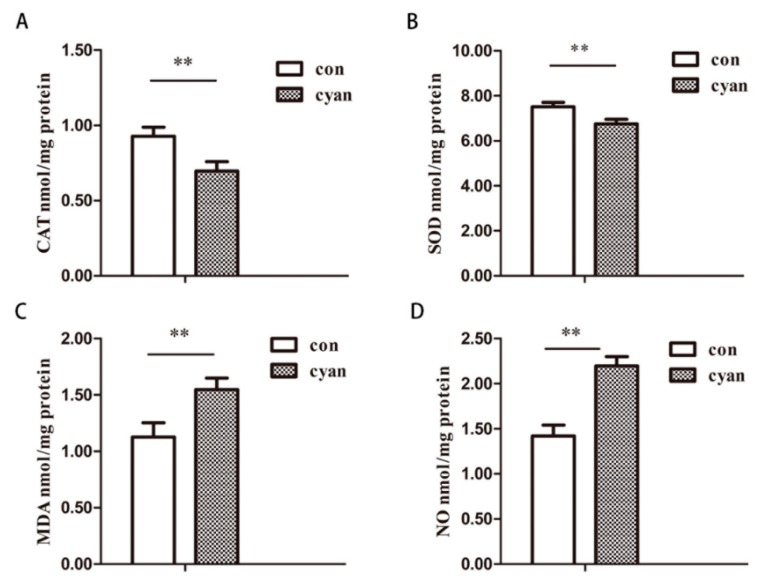
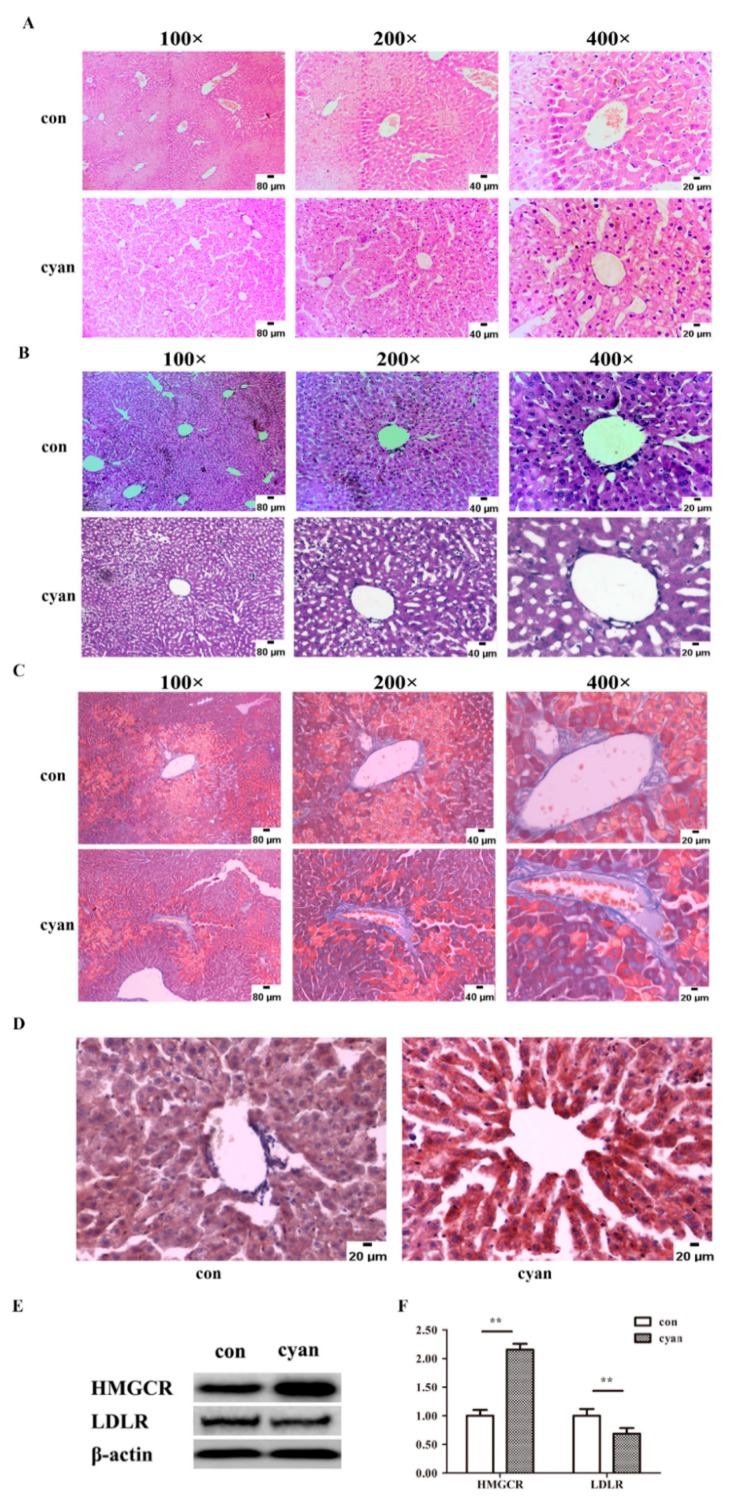
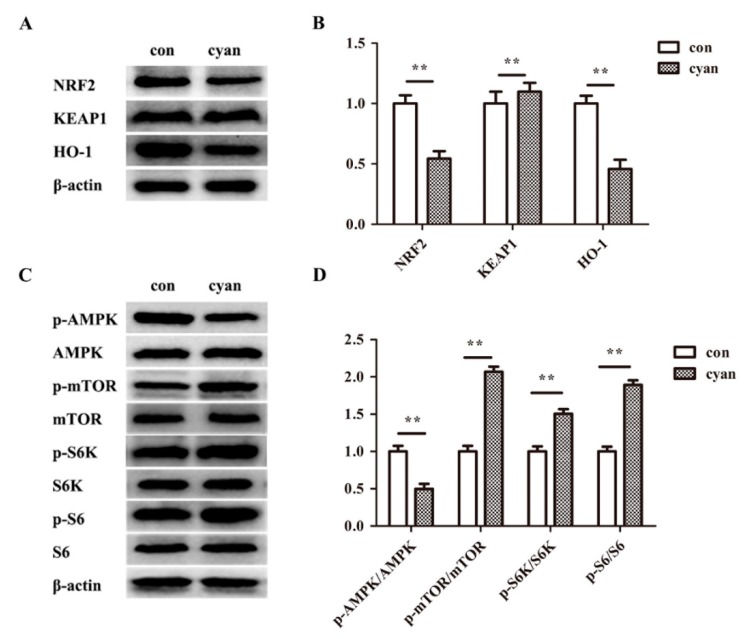
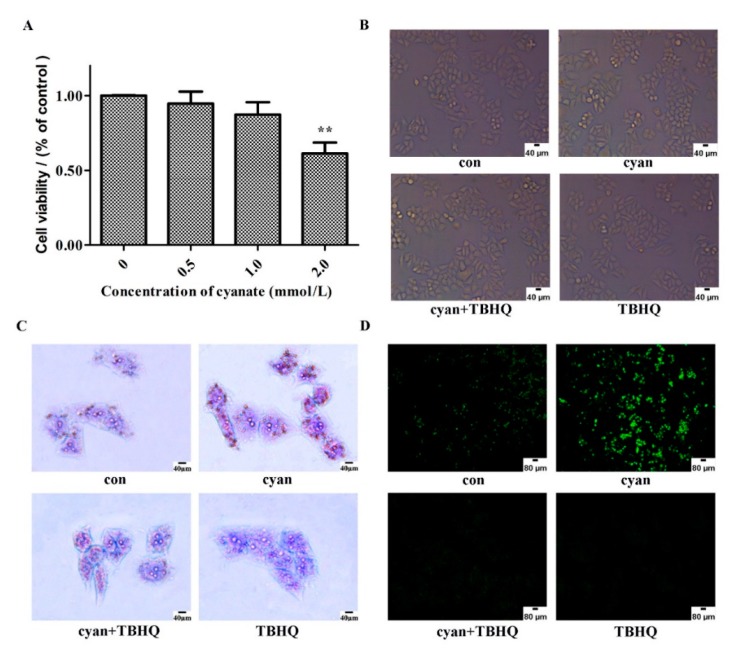
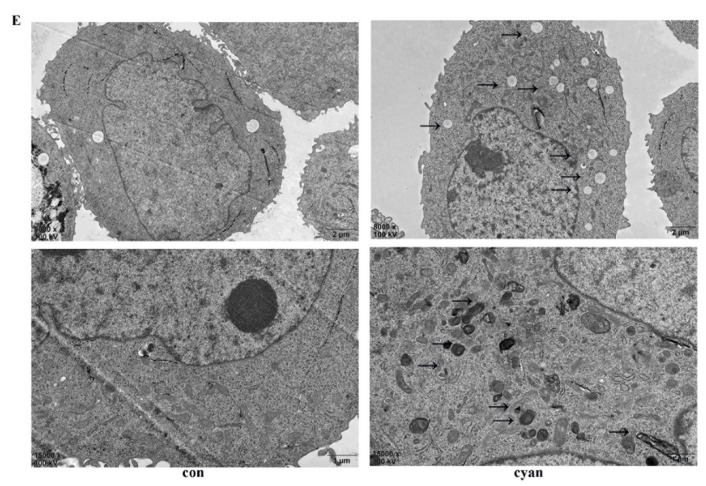
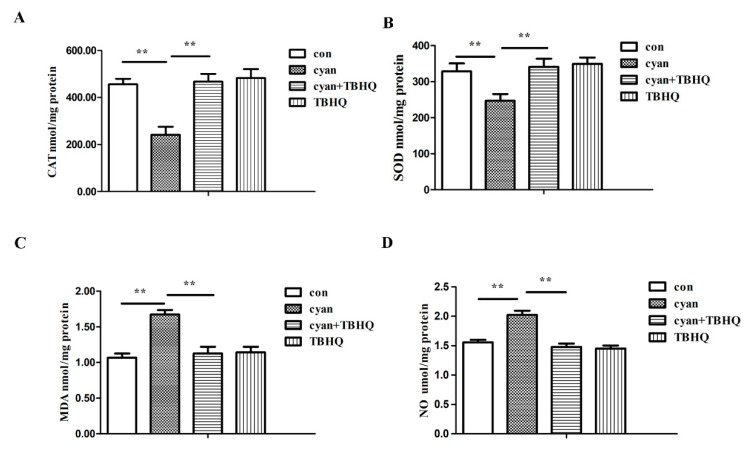
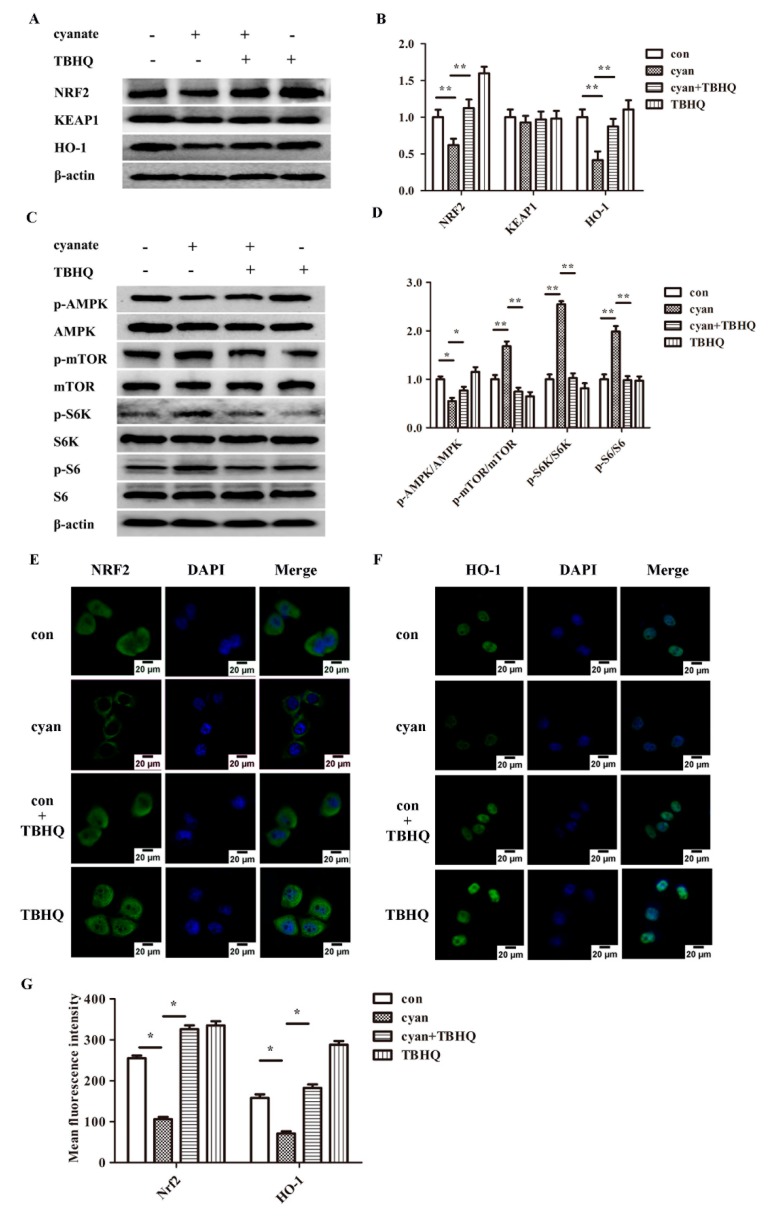
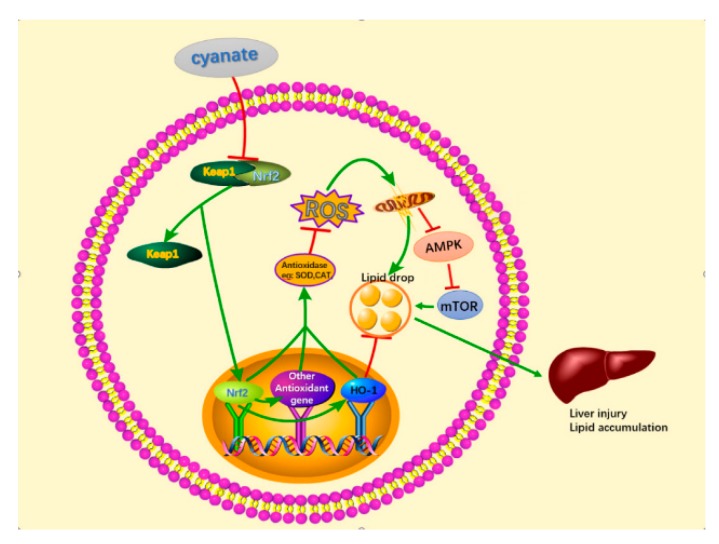
Chronic kidney disease (CKD) is problem that has become one of the major issues affecting public health. Extensive clinical data suggests that the prevalence of hyperlipidemia in CKD patients is significantly higher than in the general population. Lipid metabolism disorders can damage the renal parenchyma and promote the occurrence of cardiovascular disease (CVD). Cyanate is a uremic toxin that has attracted widespread attention in recent years. Usually, 0.8% of the molar concentration of urea is converted into cyanate, while myeloperoxidase (MPO) catalyzes the oxidation of thiocyanate to produce cyanate at the site of inflammation during smoking, inflammation, or exposure to environmental pollution. One of the important physiological functions of cyanate is protein carbonylation, a non-enzymatic post-translational protein modification. Carbamylation reactions on proteins are capable of irreversibly changing protein structure and function, resulting in pathologic molecular and cellular responses. In addition, recent studies have shown that cyanate can directly damage vascular tissue by producing large amounts of reactive oxygen species (ROS). Oxidative stress leads to the disorder of liver lipid metabolism, which is also an important mechanism leading to cirrhosis and liver fibrosis. However, the influence of cyanate on liver has remained unclear. In this research, we explored the effects of cyanate on the oxidative stress injury and abnormal lipid metabolism in mice and HL-7702 cells. In results, cyanate induced hyperlipidemia and oxidative stress by influencing the content of total cholesterol (TC), high-density lipoprotein (HDL), low-density lipoprotein (LDL), superoxide dismutase (SOD), catalase (CAT) in liver. Cyanate inhibited NF-E2-related factor 2 (Nrf2), heme oxygenase-1 (HO-1), and the phosphorylation of adenosine 5'monophosphate-activated protein kinase (AMPK), activated the mTOR pathway. Oxidative stress on the cells reduced significantly by treating with TBHQ, an antioxidant, which is also an activator of Nrf2. The activity of Nrf2 was rehabilitated and phosphorylation of mTOR decreased. In conclusion, cyanate could induce oxidative stress damage and lipid deposition by inhibiting Nrf2/HO-1 pathway, which was rescued by inhibitor of Nrf2.
Keywords: HL-7702; Nrf2/ ho-1; ROS; cyanate; lipid metabolism.
Conflict of interest statement
The authors declare no conflict of interest.
Figures
Similar articles
-
Aucubin inhibited lipid accumulation and oxidative stress via Nrf2/HO-1 and AMPK signalling pathways.J Cell Mol Med. 2019 Jun;23(6):4063-4075. doi: 10.1111/jcmm.14293. Epub 2019 Apr 4. J Cell Mol Med. 2019. PMID: 30950217 Free PMC article.
-
Hesperetin ameliorates hepatic oxidative stress and inflammation via the PI3K/AKT-Nrf2-ARE pathway in oleic acid-induced HepG2 cells and a rat model of high-fat diet-induced NAFLD.Food Funct. 2021 May 11;12(9):3898-3918. doi: 10.1039/d0fo02736g. Food Funct. 2021. PMID: 33977953
-
Gastrodin Ameliorates Oxidative Stress and Proinflammatory Response in Nonalcoholic Fatty Liver Disease through the AMPK/Nrf2 Pathway.Phytother Res. 2016 Mar;30(3):402-11. doi: 10.1002/ptr.5541. Epub 2015 Dec 4. Phytother Res. 2016. PMID: 26634892
-
Activation of Nrf2/HO-1 signaling: An important molecular mechanism of herbal medicine in the treatment of atherosclerosis via the protection of vascular endothelial cells from oxidative stress.J Adv Res. 2021 Jul 6;34:43-63. doi: 10.1016/j.jare.2021.06.023. eCollection 2021 Dec. J Adv Res. 2021. PMID: 35024180 Free PMC article. Review.
-
NRF2-mediated regulation of lipid pathways in viral infection.Mol Aspects Med. 2024 Jun;97:101279. doi: 10.1016/j.mam.2024.101279. Epub 2024 May 20. Mol Aspects Med. 2024. PMID: 38772081 Review.
Cited by
-
Alleviation of High-Fat Diet-Induced Hyperlipidemia in Mice by Stachys sieboldii Miq. Huangjiu via the Modulation of Gut Microbiota Composition and Metabolic Function.Foods. 2024 Jul 26;13(15):2360. doi: 10.3390/foods13152360. Foods. 2024. PMID: 39123552 Free PMC article.
-
Decrease in platelet count in patients with AKI and its association with major adverse kidney events.Ren Fail. 2024 Dec;46(1):2359643. doi: 10.1080/0886022X.2024.2359643. Epub 2024 Jun 13. Ren Fail. 2024. PMID: 38869010 Free PMC article.
-
Associations of perchlorate, nitrate, and thiocyanate exposure with arthritis and inflammation indicators in young and middle-aged adults, NHANES 2005-2016.Front Immunol. 2024 Mar 1;15:1318737. doi: 10.3389/fimmu.2024.1318737. eCollection 2024. Front Immunol. 2024. PMID: 38495893 Free PMC article.
-
Targeting protein modifications in metabolic diseases: molecular mechanisms and targeted therapies.Signal Transduct Target Ther. 2023 May 27;8(1):220. doi: 10.1038/s41392-023-01439-y. Signal Transduct Target Ther. 2023. PMID: 37244925 Free PMC article. Review.
-
The NRF-2/HO-1 Signaling Pathway: A Promising Therapeutic Target for Metabolic Dysfunction-Associated Steatotic Liver Disease.J Inflamm Res. 2024 Nov 3;17:8061-8083. doi: 10.2147/JIR.S490418. eCollection 2024. J Inflamm Res. 2024. PMID: 39512865 Free PMC article. Review.
References
-
- Erratum: Kidney Disease: Improving Global Outcomes (KDIGO) CKD-MBD Update Work Group. KDIGO 2017 Clinical Practice Guideline Update for the Diagnosis, Evaluation, Prevention, and Treatment of Chronic Kidney Disease-Mineral and Bone Disorder (CKD-MBD) Kidney Int. Suppl. 2017;7:1–59. doi: 10.1016/j.kisu.2017.04.001. - DOI - PMC - PubMed
-
- Kotanko P., Rosales L., Ronco C. Preface—Advances in CKD 2018. Blood Purif. 2018;45:151–153. - PubMed
-
- Bello A.K., Levin A., Manns B.J., Feehally J., Drueke T., Faruque L., Hemmelgarn B.R., Kernahan C., Mann J., Klarenbach S., et al. Effective CKD care in European countries: Challenges and opportunities for health policy. Am. J. Kidney Dis. Off. J. Natl. Kidney Found. 2015;65:15–25. doi: 10.1053/j.ajkd.2014.07.033. - DOI - PubMed
MeSH terms
Substances
LinkOut - more resources
Full Text Sources
Research Materials
Miscellaneous
