. 2019 Sep 5;8(3):140.
doi: 10.3390/antibiotics8030140.

Tobramycin Promotes Melanogenesis by Upregulating p38 MAPK Protein Phosphorylation in B16F10 Melanoma Cells

Affiliations

Tobramycin Promotes Melanogenesis by Upregulating p38 MAPK Protein Phosphorylation in B16F10 Melanoma Cells

Seung-Hyun Moon et al. Antibiotics (Basel). .

Abstract

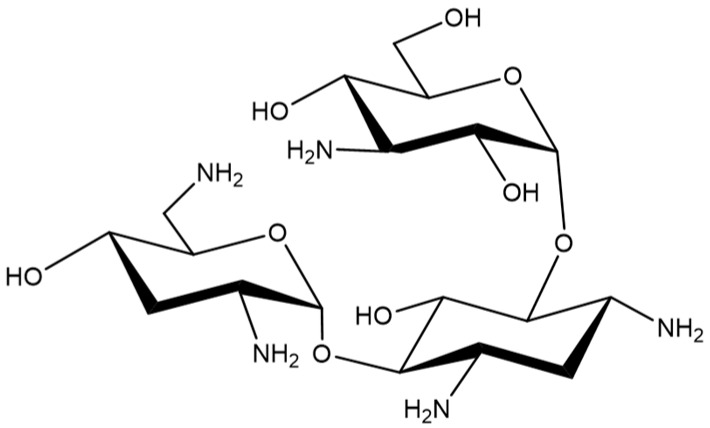
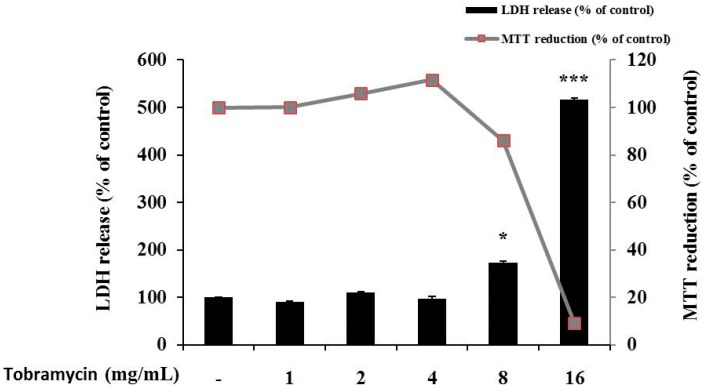
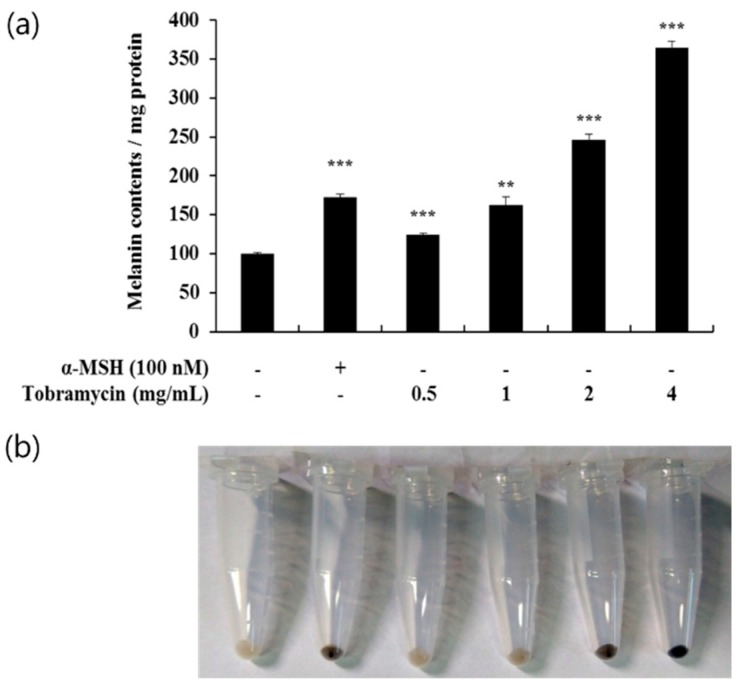
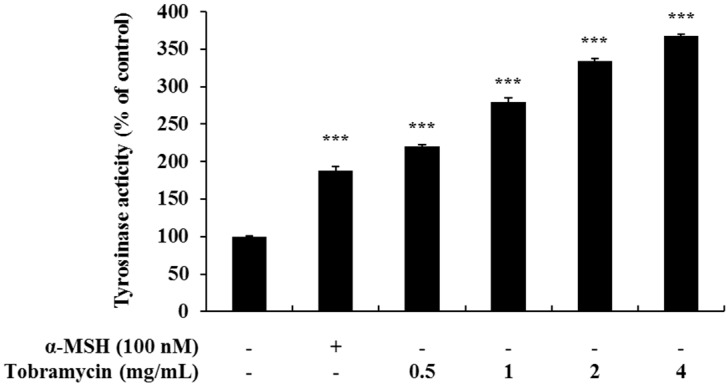
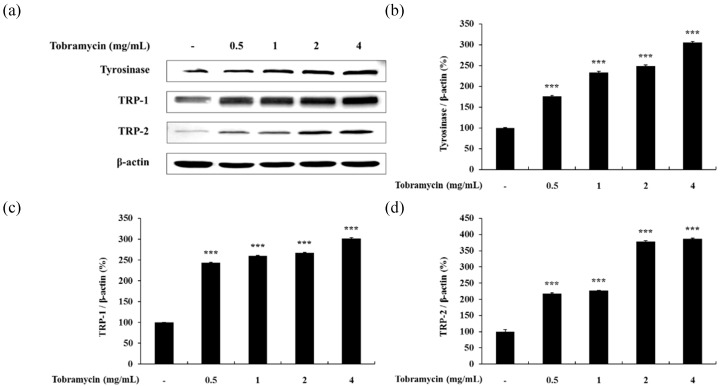
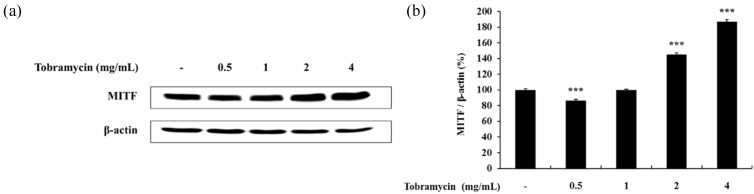
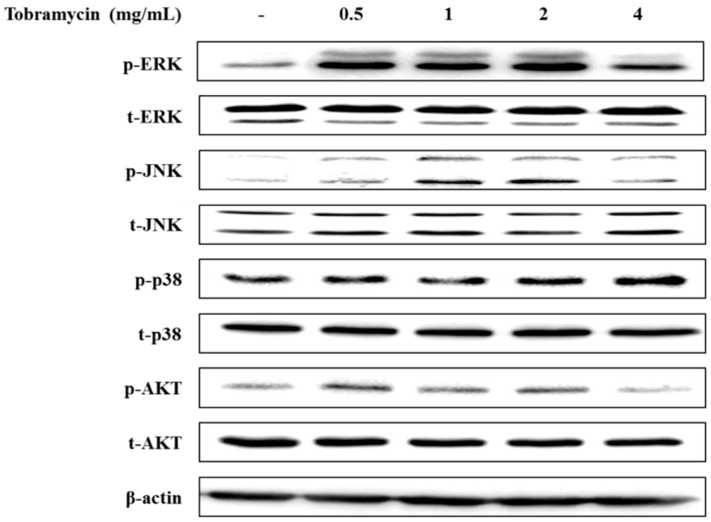
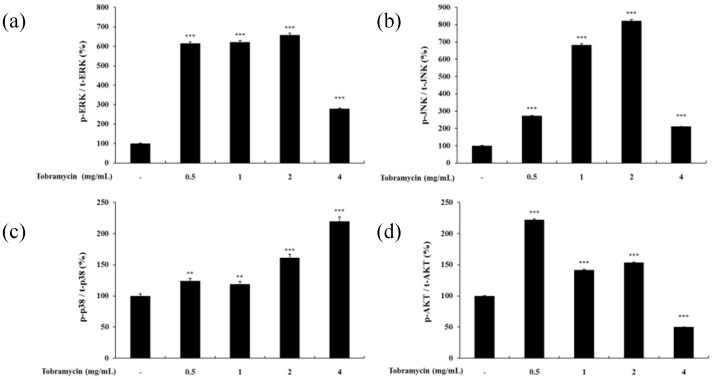
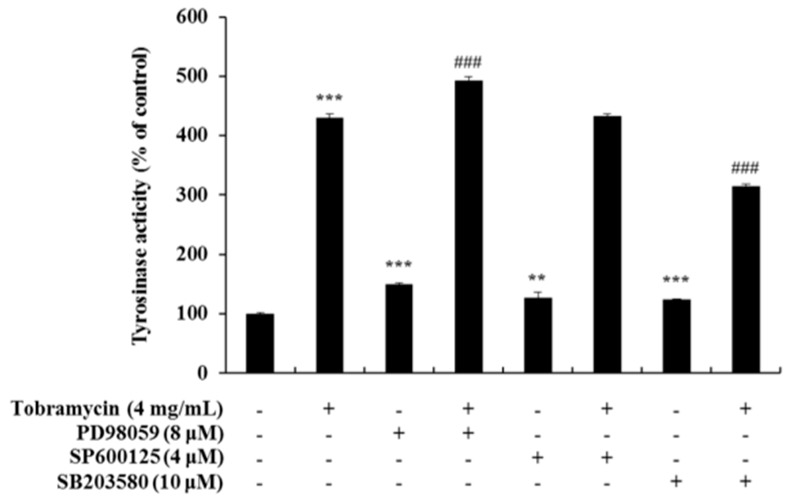
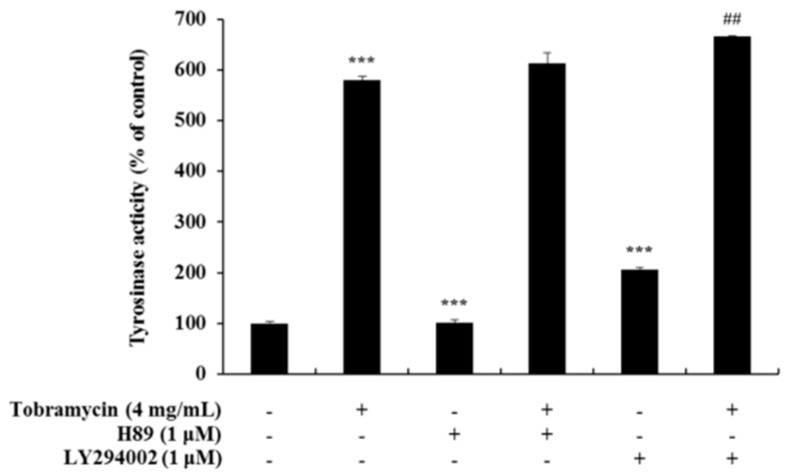
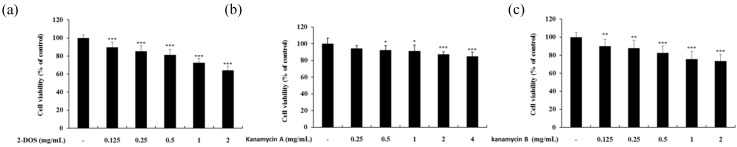
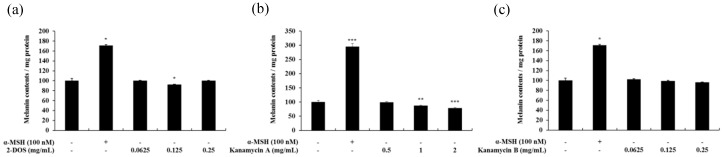
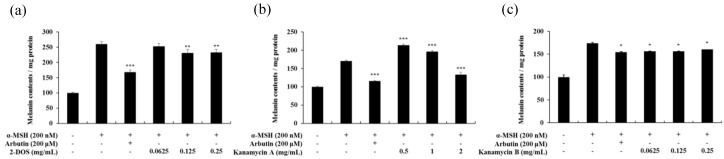
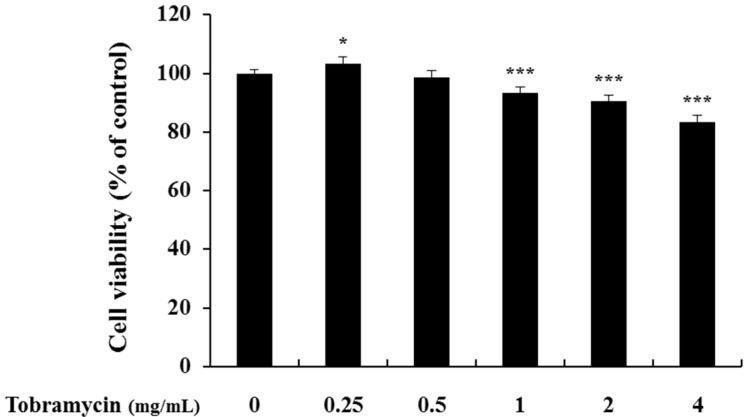
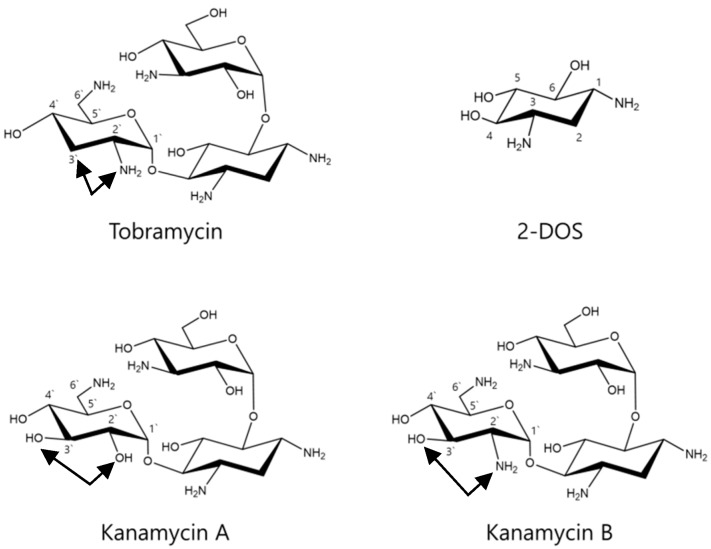
Tobramycin is an aminoglycoside-based natural antibiotic derived from Streptomyces tenebrarius, which is primarily used for Gram-negative bacterial infection treatment. Although tobramycin has been utilized in clinical practice for a long time, it has exhibited several side effects, leading to the introduction of more effective antibiotics. Therefore, we conducted our experiments focusing on new possibilities for the clinical use of tobramycin. How tobramycin affects skin melanin formation is unknown. This study used B16F10 melanoma cells to assess the effect of tobramycin on melanin production. After cytotoxicity was assessed by MTT assay, melanin content and tyrosinase activity analyses revealed that tobramycin induces melanin synthesis in B16F10 cells. Next, Western blot analyses were performed to elucidate the mechanism by which tobramycin increases melanin production; phosphorylated p38 protein expression was upregulated. Protein inhibitors have been used to elucidate the mechanism of tobramycin. Kanamycin A and B are structurally similar to tobramycin, and 2-DOS represents the central structure of these antibiotics. The effects of these substances on melanogenesis were evaluated. Kanamycin A reduced melanin production, whereas kanamycin B and 2-DOS had no effect. Overall, our data indicated that tobramycin increases melanin production by promoting p38 protein phosphorylation in B16F10 melanoma cells.

Keywords: 2-DOS; B16F10 melanoma cell; aminoglycoside; kanamycin; melanin; melanogenesis; p-p38; tobramycin.


Conflict of interest statement

The authors declare no conflict of interest.

Figures

Figure 1
Figure 1
Chemical structure of Tobramycin.
Figure 2
Figure 2
Cell viability of tobramycin-treated B16F10 melanoma cells. The cells were supplemented with various concentrations of tobramycin for 72 h. Data are presented as mean ± standard deviation (SD) of at least four independent experiments (n = 4). ** indicates p < 0.01, *** p < 0.001 vs. untreated cells.
Figure 3
Figure 3
Melanin levels in tobramycin-treated B16F10 melanoma cells. The cells were treated with various concentrations of tobramycin for 72 h, and α-MSH was used as a positive control. (a) Melanin concentrations are expressed as percentages compared to the respective values obtained for the control cells. (b) Images of corresponding B16F10 cell pellets harvested by centrifugation. Data are presented as mean ± standard deviation (SD) of at least four independent experiments (n = 4). *** indicates p < 0.001 vs. untreated cells.
Figure 4
Figure 4
Tyrosinase activity in tobramycin-treated B16F10 melanoma cells. The cells were treated with various concentrations of tobramycin for 72 h, and α-MSH was used as a positive control. Data are presented as mean ± standard deviation (SD) of at least four independent experiments (n = 4). *** indicates p < 0.001 vs. untreated cells.
Figure 5
Figure 5
Effect of tobramycin on tyrosinase, TRP-1, and TRP-2 expression in B16F10 cells. Cells were treated with various concentrations of tobramycin for 40 h. Protein levels were examined by Western blotting. (a) Representative Western blotting results and quantified (b) tyrosinase, (c) TRP-1, and (d) TRP-2 protein levels. Results are expressed as percentages of the control. Data are presented as mean ± standard deviation (SD) of at least three independent experiments (n = 3). *** indicates p < 0.001 vs. untreated cells.
Figure 6
Figure 6
Effect of tobramycin on MITF expression in B16F10 cells. Cells were treated with various concentrations of tobramycin for 20 h, and protein levels were examined by Western blotting. (a) Representative Western blotting results, and (b) quantified MITF protein levels. Results are expressed as percentages of the control. Data are presented as mean ± standard deviation (SD) of at least three independent experiments (n = 3). *** indicates p < 0.001 vs. untreated cells.
Figure 7
Figure 7
Effect of tobramycin on MAPK expression in B16F10 cells. Cells were treated with various concentrations of tobramycin for 4 h. Protein levels were examined by Western blotting.
Figure 8
Figure 8
Quantified protein levels of (a) p-ERK, (b) p-JNK, (c) p-p38, and (d) p-AKT from Western blot experiments. Results are expressed as percentages of the control. Data are presented as mean ± SD of at least three independent experiments (n = 3). ** indicates p < 0.01, *** p < 0.001 vs. control.
Figure 9
Figure 9
Effect of MAPK inhibitors on tobramycin-induced tyrosinase activity in B16F10 cells. To confirm the mechanism underlying the effect of tobramycin in melanogenesis, cellular tyrosinase activity was measured using the following MAPK inhibitors: PD98059 (ERK inhibitor), SP600125 (JNK inhibitor), and SB203580 (p38 inhibitor). Results are expressed as percentages of the control. Data are presented mean ± SD of four independent experiments (n = 4). ** indicates p < 0.01 *** indicates p < 0.001 vs. untreated cells and ### indicates p < 0.001 vs. tobramycin treated cells.
Figure 10
Figure 10
Effect of PKA inhibitors on tobramycin-induced tyrosinase activity in B16F10 cells. To confirm tobramycin mechanism in melanogenesis, cellular tyrosinase activity was measured using H89 (PKA inhibitor) and LY294002 (AKT inhibitor). Results are expressed as percentages of the control. Data are presented as mean ± SD of four independent experiments (n = 4). *** indicates p < 0.001 vs. untreated cells and ## indicates p < 0.01 vs. tobramycin treated cells.
Figure 11
Figure 11
Cell viability of kanamycin A-(a), kanamycin B-(b), and 2-DOS-(c) treated B16F10 melanoma cells. Cells were treated with various concentrations of these drugs for 72 h. Data are presented as mean ± standard deviation (SD) of at least four independent experiments (n = 4). * indicates p < 0.05, ** p < 0.01, *** p < 0.001 vs. untreated cells.
Figure 12
Figure 12
Melanin contents in 2-DOS-(a), kanamycin A-(b), and kanamycin B-(c) treated B16F10 melanoma cells. The cells were treated with various concentrations for 72 h. α-MSH was used as a positive control. Melanin concentrations are expressed as percentages compared to the respective values obtained for the control cells. Data are presented as mean ± standard deviation (SD) of at least four independent experiments (n = 4). * indicates p < 0.05, ** p < 0.01, *** p < 0.001 vs. untreated cells.
Figure 13
Figure 13
Melanin contents of 2-DOS(a), kanamycin A(b), and kanamycin B(c)-treated B16F10 melanoma cells. The cells were treated with various drug concentrations for 72 h. α-MSH was used as a negative control and arbutin was used as a positive control. Melanin concentrations are expressed as percentages compared to the respective values obtained for the control cells. Data are presented as mean ± standard deviation (SD) of at least four independent experiments (n = 4). * indicates p < 0.05, ** p < 0.01, *** p < 0.001 vs. tobramycin treatment.
Figure 14
Figure 14
Cell viability of tobramycin-treated HaCaT keratinocyte cells. The cells were treated with various concentrations of tobramycin for 24 h. Data are presented as mean ± standard deviation (SD) of at least four independent experiments (n = 4). * indicates p < 0.05, *** p < 0.001 vs. control.
Figure 15
Figure 15
Structures of 2-DOS, tobramycin, kanamycin A, and kanamycin B.

Similar articles

Cited by

References

    1. Brenner M., Hearing V.J. The protective role of melanin against UV damage in human skin. Photochem. Photobiol. 2008;84:539–549. doi: 10.1111/j.1751-1097.2007.00226.x. - DOI - PMC - PubMed
    1. D’Orazio J., Jarrett S., Amaro-Ortiz A., Scott T. UV radiation and the skin. Int. J. Mol. Sci. 2013;14:12222–12248. doi: 10.3390/ijms140612222. - DOI - PMC - PubMed
    1. Tran T.N.T., Schulman J., Fisher D.E. UV and pigmentation: Molecular mechanisms and social controversies. Pigment Cell Melanoma Res. 2008;21:509–516. doi: 10.1111/j.1755-148X.2008.00498.x. - DOI - PMC - PubMed
    1. Pillaiyar T., Manickam M., Jung S.-H. Recent development of signaling pathways inhibitors of melanogenesis. Cell. Signal. 2017;40:99–115. doi: 10.1016/j.cellsig.2017.09.004. - DOI - PubMed
    1. Pillaiyar T., Manickam M., Jung S.H. Inhibitors of melanogenesis: A patent review (2009–2014) Expert Opin. Ther. Pat. 2015;25:775–788. doi: 10.1517/13543776.2015.1039985. - DOI - PubMed

LinkOut - more resources