. 2019 Sep 5;10(9):678.
doi: 10.3390/genes10090678.

Focal Recurrent Copy Number Alterations Characterize Disease Relapse in High Grade Serous Ovarian Cancer Patients with Good Clinical Prognosis: A Pilot Study

Affiliations

Focal Recurrent Copy Number Alterations Characterize Disease Relapse in High Grade Serous Ovarian Cancer Patients with Good Clinical Prognosis: A Pilot Study

Matteo Dugo et al. Genes (Basel). .

Abstract

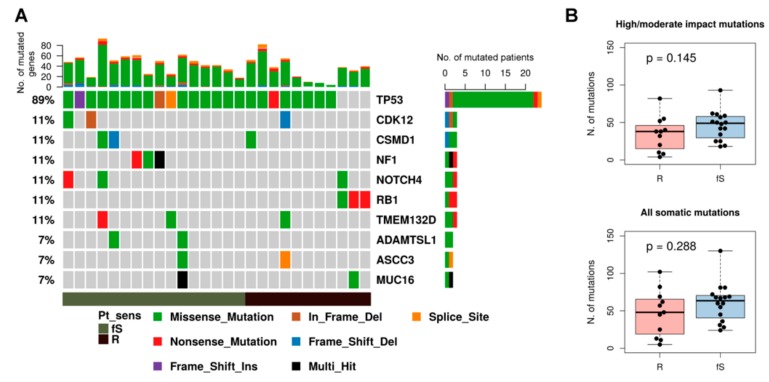
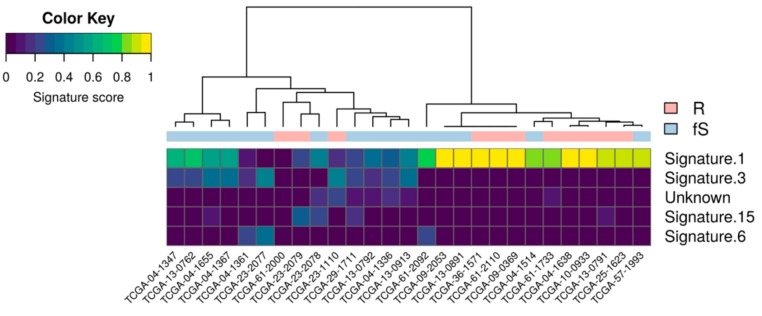
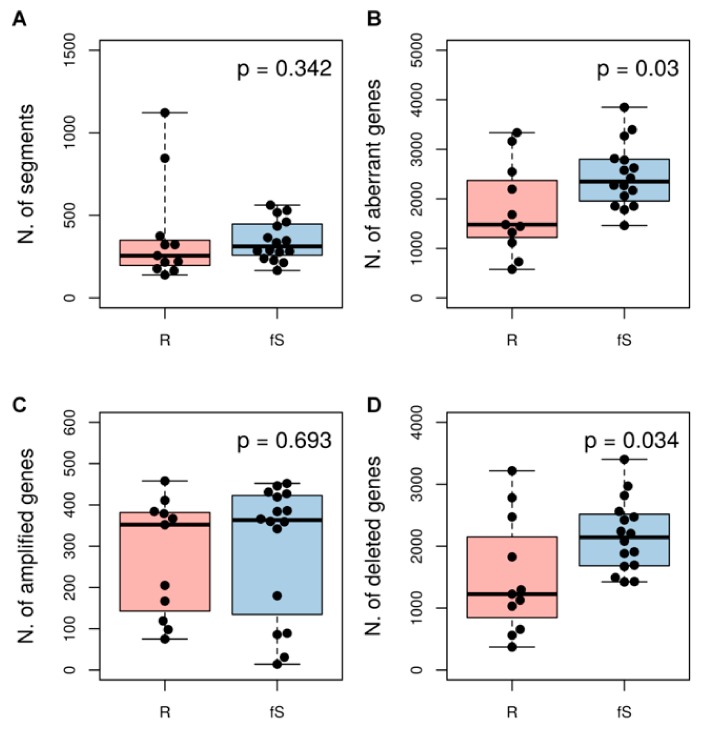
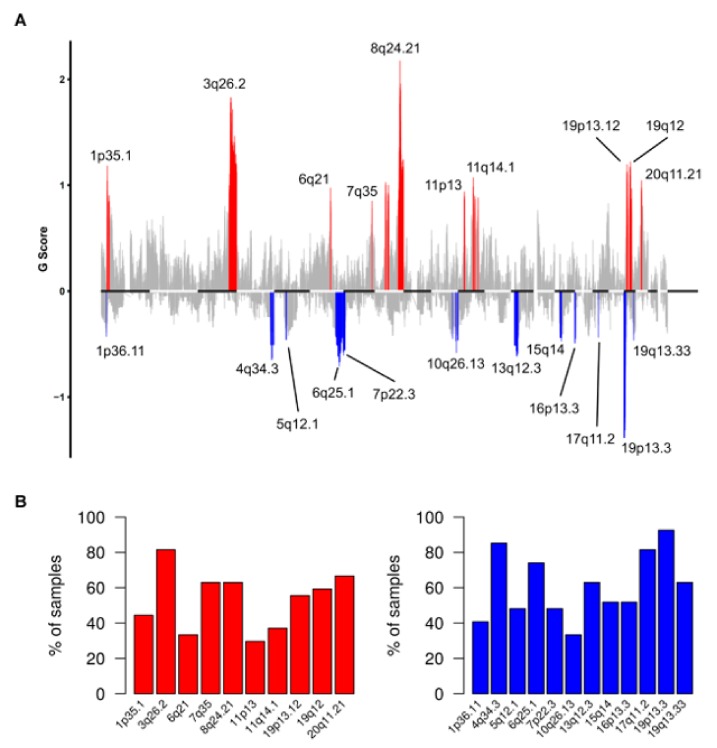
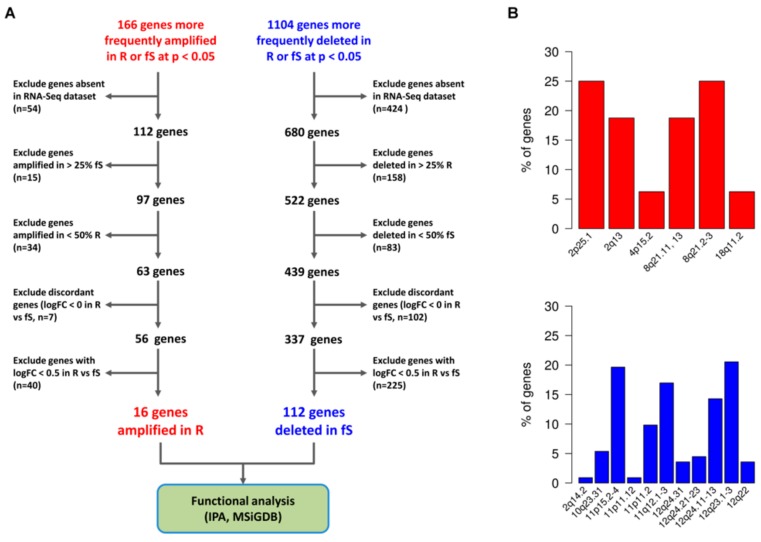
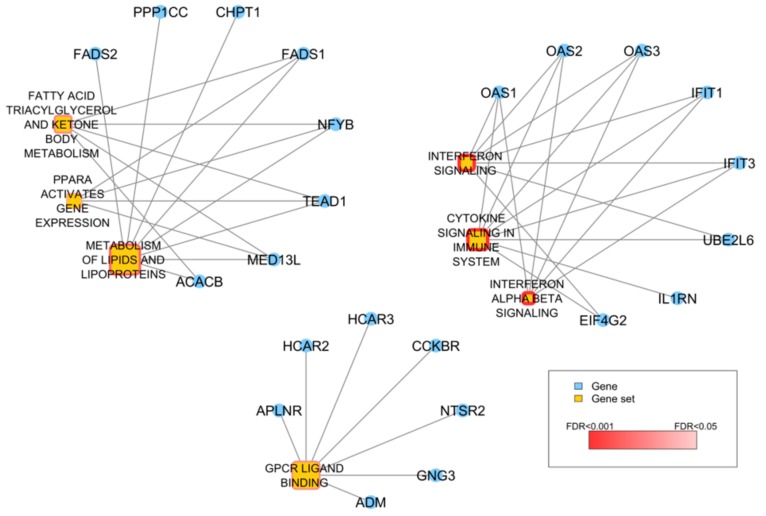
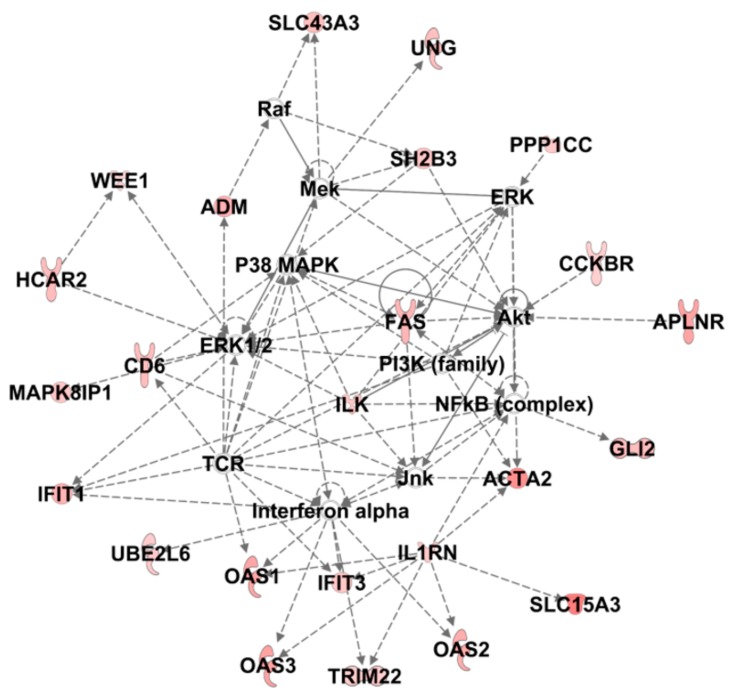
High grade serous ovarian cancer (HGSOC) retains high molecular heterogeneity and genomic instability, which currently limit the treatment opportunities. HGSOC patients receiving complete cytoreduction (R0) at primary surgery and platinum-based therapy may unevenly experience early disease relapse, in spite of their clinically favorable prognosis. To identify distinctive traits of the genomic landscape guiding tumor progression, we focused on the R0 patients of The Cancer Genome Atlas (TCGA) ovarian serous cystadenocarcinoma (TCGA-OV) dataset and classified them according to their time to relapse (TTR) from surgery. We included in the study two groups of R0-TCGA patients experiencing substantially different outcome: Resistant (R; TTR ≤ 12 months; n = 11) and frankly Sensitive (fS; TTR ≥ 24 months; n = 16). We performed an integrated clinical, RNA-Sequencing, exome and somatic copy number alteration (sCNA) data analysis. No significant differences in mutational landscape were detected, although the lack of BRCA-related mutational signature characterized the R group. Focal sCNA analysis showed a higher frequency of amplification in R group and deletions in fS group respectively, involving cytobands not commonly detected by recurrent sCNA analysis. Functional analysis of focal sCNA with a concordantly altered gene expression identified in R group a gain in Notch, and interferon signaling and fatty acid metabolism. We are aware of the constraints related to the low number of OC cases analyzed. It is worth noting, however, that the sCNA identified in this exploratory analysis and characterizing Pt-resistance are novel, deserving validation in a wider cohort of patients achieving complete surgical debulking.

Keywords: focal copy number alterations; ovarian cancer; platinum resistance; whole exome sequencing.


Conflict of interest statement

The authors declare no conflict of interest. The funders had no role in the design of the study; in the collection, analyses, or interpretation of data; in the writing of the manuscript, or in the decision to publish the results.

Figures

Figure 1
Figure 1
Mutational spectrum of TCGA-OV27 samples. (A) Oncoplot of the top-10 most frequently mutated genes in cytoreduction (R0) patients of the TCGA-OV27 dataset, grouped according to sensitivity class. Each column represents a sample and each row a different gene. Colored squares show mutated genes, while grey squares show no mutated genes. Different type of mutations are colored according to the variant type as indicated in the legend at the bottom. Genes annotated as “Multi_Hit” have more than one mutation in the same sample. The barplot at the top shows the number of mutated genes for each patient colored according to the mutation type. The barplot on the right reports the number of mutated patients for each gene, colored according to the mutation type. (B) Boxplot showing the tumor mutational load of R and fS samples, calculated both considering only mutations with high/moderate impact (upper panel) or all somatic mutations (lower panel). P-value was calculated by Wilcoxon rank-sum test.
Figure 2
Figure 2
Mutational signatures in TCGA-OV27 cohort. Heatmap showing the contribution of the top-5 most represented COSMIC signatures in the mutational profiles of TCGA-OV27 samples.
Figure 3
Figure 3
Association between genomic instability and sensitivity class in TCGA-OV27 dataset. As measure of genomic instability for each sample we considered: (A) the number of segments that represents the number of regions with different copy number levels within a genome; (B) the total number of amplified or deleted genes; the total number of amplified genes only (C) or deleted genes only (D). P-values are according to Wilcoxon rank-sum test.
Figure 4
Figure 4
Recurrent somatic copy number alterations (sCNA) in R0 patients of TCGA-OV27 cohort. (A) Plot of G scores (defined as the amplitude of the copy number multiplied by its frequency across samples) calculated by Genomic Identification of Significant Targets in Cancer (GISTIC) for genomic regions recurrently amplified (red) or deleted (blue) in the TCGA-OV27 dataset, at an FDR < 0.1. (B) Barplot showing the frequency of samples positive for the recurrently amplified (left) or deleted (right) regions identified by GISTIC.
Figure 5
Figure 5
Association between sCNA and altered gene expression in Pt-sensitivity classes. (A) Selection of significant focal sCNA with concordant alteration of gene expression. Gene expression was assessed by RNA-sequencing (RNASeq) data, and for each altered gene, the logFC expression ratio of R vs fS patients was calculated. The workflow guiding selection of both amplified and deleted genes with concordant expression is shown. (B) Cytobands associated with significant sCNA and altered gene expression. In the plot are reported the cytobands affected by significant amplification (upper panel, red bars) and deletions (lower panel, blue bars). For each type of alteration, the relative frequency of each cytoband affected is shown.
Figure 6
Figure 6
Over-representation analysis of the 128 genes with concordant sCNA and expression. Network showing the 7 Reactome gene sets significantly over-represented in the list of 128 genes. Yellow nodes represent gene sets and the size of the node is proportional to the number of genes catalogued in the gene set. The significance of the over-representation is represented by a dark-to-light red color scale. Blue nodes represent genes and are connected to a gene set if they are among its gene members.
Figure 7
Figure 7
IPA analysis of the 128 significantly altered genes. The top-scoring regulatory network built from Core Analysis and named Dermatological Diseases and Conditions, Organismal Injury and Abnormalities, Immunological Disease is shown. Colored nodes are the genes of the dataset participating to the network.

References

    1. Siegel R.L., Miller K.D., Jemal A. Cancer statistics, 2019. CA Cancer J. Clin. 2019;69:7–34. doi: 10.3322/caac.21551. - DOI - PubMed
    1. Jayson G.C., Kohn E.C., Kitchener H.C., Ledermann J.A. Ovarian cancer. Lancet. 2014;384:1376–1388. doi: 10.1016/S0140-6736(13)62146-7. - DOI - PubMed
    1. Lheureux S., Gourley C., Vergote I., Oza A.M. Epithelial ovarian cancer. Lancet. 2019;393:1240–1253. doi: 10.1016/S0140-6736(18)32552-2. - DOI - PubMed
    1. Ciriello G., Miller M.L., Aksoy B.A., Senbabaoglu Y., Schultz N., Sander C. Emerging landscape of oncogenic signatures across human cancers. Nat. Genet. 2013;45:1127–1133. doi: 10.1038/ng.2762. - DOI - PMC - PubMed
    1. Cancer Genome Atlas Research Network Integrated genomic analyses of ovarian carcinoma. Nature. 2011;474:609–615. doi: 10.1038/nature10166. - DOI - PMC - PubMed

Publication types

MeSH terms