. 2019 Sep 5;9(9):452.
doi: 10.3390/biom9090452.

Differential Sympathetic Activation of Adipose Tissues by Brain-Derived Neurotrophic Factor

Affiliations

Differential Sympathetic Activation of Adipose Tissues by Brain-Derived Neurotrophic Factor

Qi Zhu et al. Biomolecules. .

Abstract

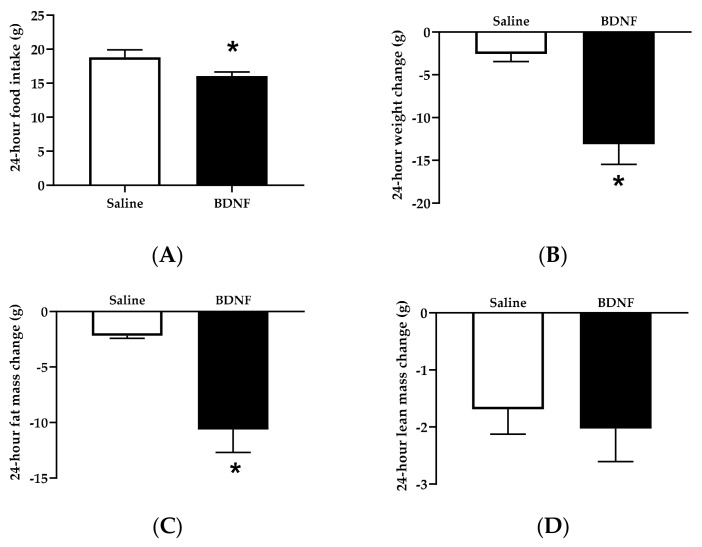
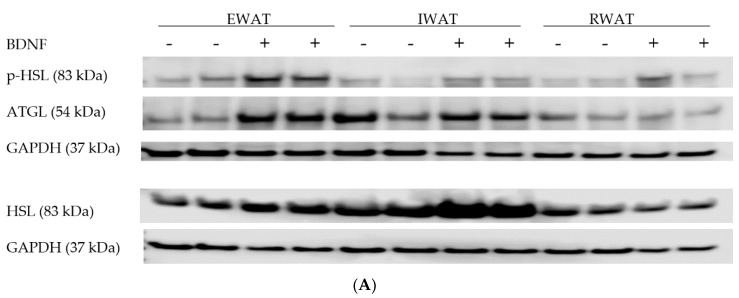
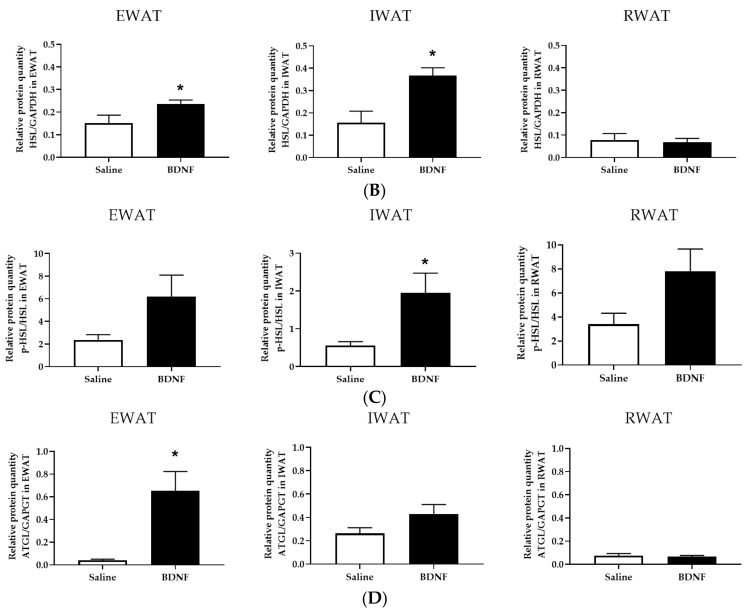
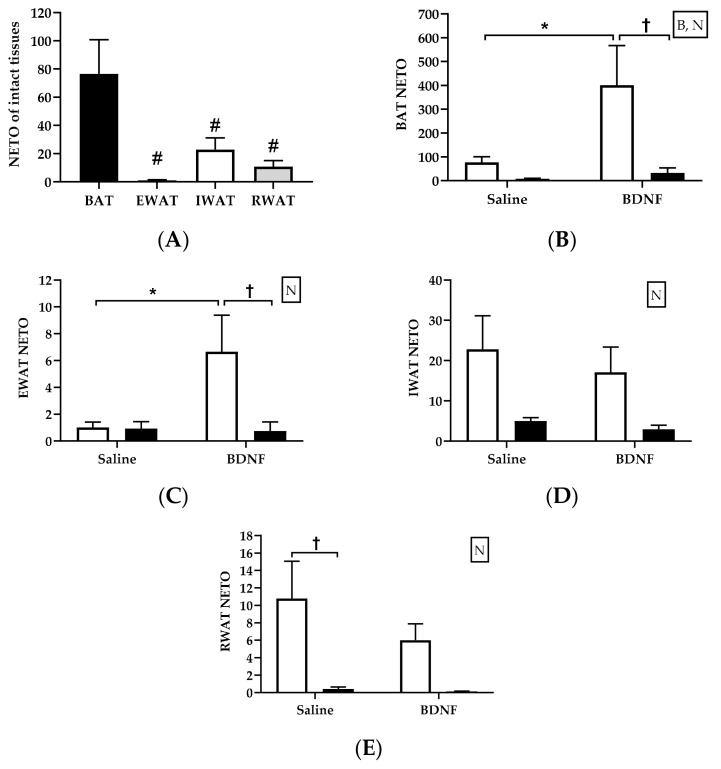
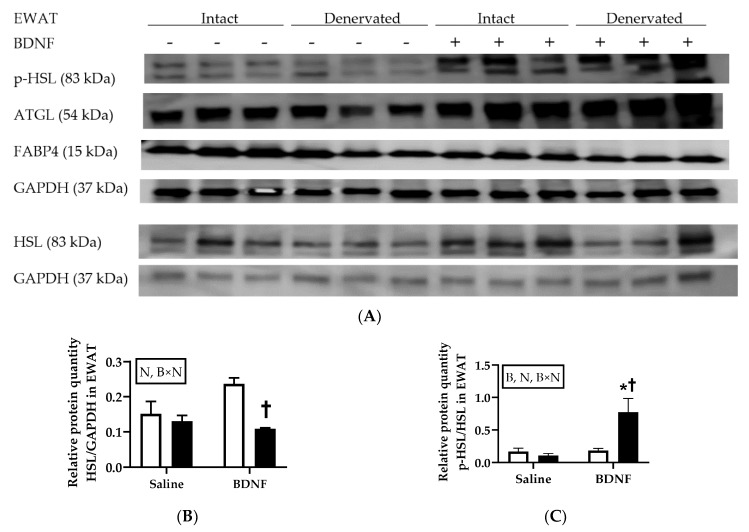
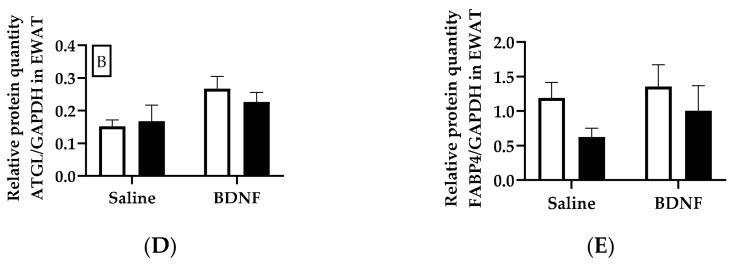
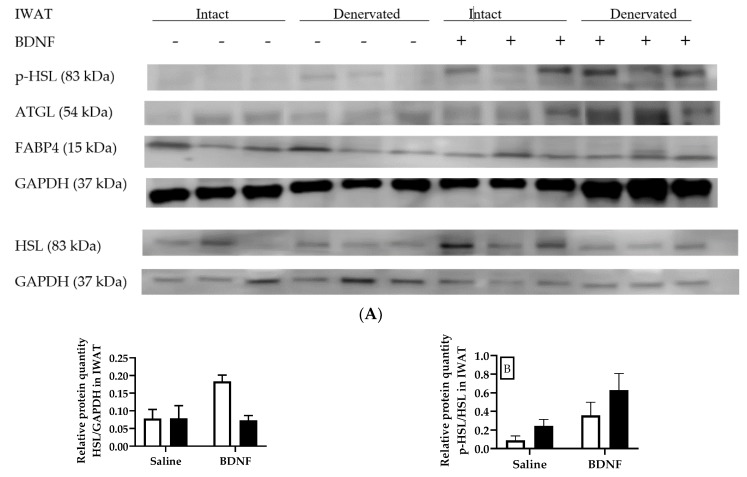
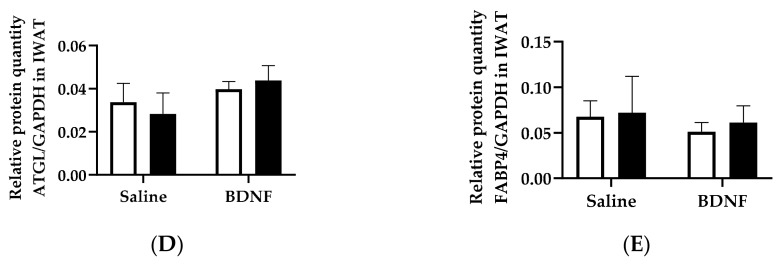
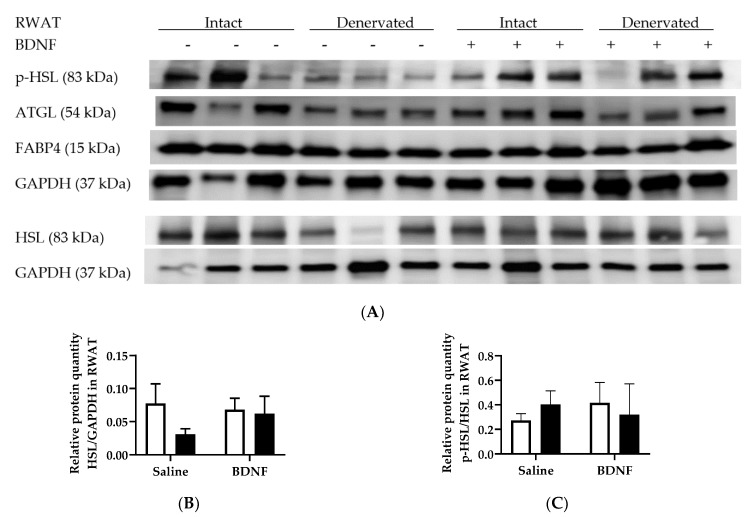
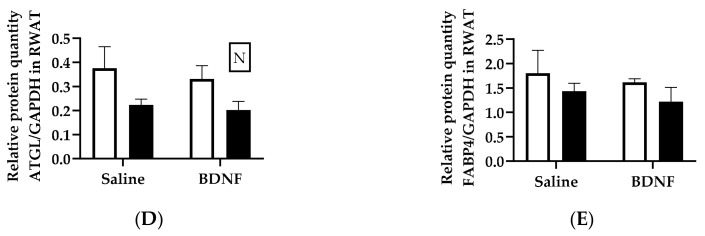
Centrally administered brain-derived neurotrophic factor (BDNF) decreases body adiposity beyond what can be accounted for by decreased food intake, implying enhanced lipid metabolism by BDNF. Consistent with this notion, intracerebroventricular (icv) injection of BDNF in rats increased the expression of lipolytic enzymes in white adipose tissues (WAT) and increased circulating concentrations of lipolytic products without changing the levels of adrenal gland hormones. This suggests that central BDNF-induced lipid mobilization is likely due to sympathetic neural activation, rather than activation of the adrenocortical or adrenomedullary system. We hypothesized that BDNF activated sympathetic innervation of adipose tissues to regulate lipolysis. Rats with unilateral denervation of interscapular brown adipose tissue (BAT) and different WAT depots received icv injections of saline or BDNF. Both intact and denervated adipose tissues were exposed to the same circulating factors, but denervated adipose tissues did not receive neural signals. Norepinephrine (NE) turnover (NETO) of BAT and WAT was assessed as a measure of sympathetic activity. Findings revealed that central BDNF treatment induced a change in NETO in some but not all the adipose tissues tested. Specifically, greater NETO rates were found in BAT and gonadal epididymal WAT (EWAT), but not in inguinal WAT (IWAT) or retroperitoneal WAT (RWAT), of BDNF-treated rats compared to saline-treated rats. Furthermore, intact innervation was necessary for BDNF-induced NETO in BAT and EWAT. In addition, BDNF increased the expression of lipolytic enzymes in both intact and denervated EWAT and IWAT, suggesting that BDNF-induced WAT lipolysis was independent of intact innervation. To summarize, centrally administered BDNF selectively provoked sympathetic drives to BAT and EWAT that was dependent on intact innervation, while BDNF also increased lipolysis in a manner independent of intact innervation.

Keywords: adrenal hormones; brown adipose tissue; denervation; energy homeostasis; lipolysis; sympathetic activity; white adipose tissue.


Conflict of interest statement

The authors declare no conflict of interest. The founding sponsors had no role in the design of the study; in the collection, analyses, or interpretation of data; in the writing of the manuscript, and in the decision to publish the results.

Figures

Figure 1
Figure 1
Food intake, body weight change, and body composition change in saline- or BDNF-treated rats. (A) Food intake, (B) body weight change, and body composition changes in (C) fat mass and (D) lean mass measured before and 24 hours after intracerebroventricular injections of saline or BDNF. Data are expressed as mean ± SEM, n = 10 per group, and unpaired two-tailed t-tests were used to compare between saline and BDNF treatment groups. * Represents significant differences relative to saline-treated rats (p < 0.05).
Figure 2
Figure 2
Expression of lipolytic proteins involved in lipid mobilization in white adipose tissues of intracerebroventricular (icv) saline- or BDNF-treated rats. Quantifications of HSL and ATGL were normalized to GAPDH. Quantifications of p-HSL/GAPDH were normalized to HSL/GAPDH to obtain p-HSL/HSL. (A) Representative western blot images of expression of p-HSL, HSL, ATGL, and GAPDH in EWAT, IWAT, and RWAT of saline- (−) or BDNF-treated (+) rats. Quantification of (B) HSL/GAPDH, (C) p-HSL/HSL, and (D) ATGL/GAPDH in epididymal white adipose tissue (EWAT), inguinal WAT (IWAT), and retroperitoneal WAT (RWAT) of saline- or BDNF-treated rats. Each sample was loaded on two separate gels, one being labeled with p-HSL, ATGL and GAPDH and the other being labeled with HSL and GAPDH. Data are expressed as mean ± SEM, n = 10 per group, and unpaired two-tailed t-tests were used to compare between saline and BDNF treatment groups. * Represents significant differences relative to saline-treated rats (p < 0.05).
Figure 2
Figure 2
Expression of lipolytic proteins involved in lipid mobilization in white adipose tissues of intracerebroventricular (icv) saline- or BDNF-treated rats. Quantifications of HSL and ATGL were normalized to GAPDH. Quantifications of p-HSL/GAPDH were normalized to HSL/GAPDH to obtain p-HSL/HSL. (A) Representative western blot images of expression of p-HSL, HSL, ATGL, and GAPDH in EWAT, IWAT, and RWAT of saline- (−) or BDNF-treated (+) rats. Quantification of (B) HSL/GAPDH, (C) p-HSL/HSL, and (D) ATGL/GAPDH in epididymal white adipose tissue (EWAT), inguinal WAT (IWAT), and retroperitoneal WAT (RWAT) of saline- or BDNF-treated rats. Each sample was loaded on two separate gels, one being labeled with p-HSL, ATGL and GAPDH and the other being labeled with HSL and GAPDH. Data are expressed as mean ± SEM, n = 10 per group, and unpaired two-tailed t-tests were used to compare between saline and BDNF treatment groups. * Represents significant differences relative to saline-treated rats (p < 0.05).
Figure 3
Figure 3
Norepinephrine turnover in intact and denervated brown and white adipose tissues of intracerebroventricular (icv) saline- or BDNF-treated rats. (A) Norepinephrine turnover (NETO) in intact brown adipose tissues (BAT), epididymal white adipose tissue (EWAT), inguinal WAT (IWAT), and retroperitoneal WAT (RWAT) of icv saline-treated rats that received intraperitoneal injection of vehicle. One-way analysis of variance (ANOVA) was used to compare NETO of intact adipose tissues in saline-treated rats. (BE) NETO in intact (open bar) and denervated (filled bar) BAT, EWAT, IWAT, and RWAT of icv saline- or BDNF-treated rats. Two-way ANOVA with factors “innervation” (N; intact vs. denervated) and “BDNF” (B; icv saline vs. BDNF) and multiple comparisons post hoc Tukey’s test were used to compare NETO. # Represents significant differences relative to BAT (p < 0.05). * Represents significant differences relative to saline-treated rats (p < 0.05). † Represents significant differences relative to denervated adipose tissue (p < 0.05).
Figure 4
Figure 4
Expression of lipolytic p-HSL, HSL, ATGL, and FABP4 in intact and denervated epididymal white adipose tissue (EWAT) of intracerebroventricular saline- or BDNF-treated rats. Quantifications of p-HSL, HSL, ATGL, and FABP4 were normalized to GAPDH. Quantifications of p-HSL/GAPDH were also normalized to HSL/GAPDH to obtain p-HSL/HSL. (A) Representative western blot images of expression of p-HSL, HSL, ATGL, and GAPDH; and quantifications of (B) HSL/GAPDH, (C) p-HSL/HSL, (D) ATGL/GAPDH, and (E) FABP4/GAPDH in intact (open bar) and denervated (filled bar) EWAT of saline- or BDNF-treated rats. Two-way ANOVA with the factors “innervation” (N; intact vs. denervated) and “BDNF” (B; icv saline vs. BDNF treatment) and multiple comparisons post hoc Tukey’s test were used to compare relative protein quantities. * Represent significant differences relative to saline-treated rats (p < 0.05). † Represent significant differences relative to denervated adipose tissue (p < 0.05).
Figure 4
Figure 4
Expression of lipolytic p-HSL, HSL, ATGL, and FABP4 in intact and denervated epididymal white adipose tissue (EWAT) of intracerebroventricular saline- or BDNF-treated rats. Quantifications of p-HSL, HSL, ATGL, and FABP4 were normalized to GAPDH. Quantifications of p-HSL/GAPDH were also normalized to HSL/GAPDH to obtain p-HSL/HSL. (A) Representative western blot images of expression of p-HSL, HSL, ATGL, and GAPDH; and quantifications of (B) HSL/GAPDH, (C) p-HSL/HSL, (D) ATGL/GAPDH, and (E) FABP4/GAPDH in intact (open bar) and denervated (filled bar) EWAT of saline- or BDNF-treated rats. Two-way ANOVA with the factors “innervation” (N; intact vs. denervated) and “BDNF” (B; icv saline vs. BDNF treatment) and multiple comparisons post hoc Tukey’s test were used to compare relative protein quantities. * Represent significant differences relative to saline-treated rats (p < 0.05). † Represent significant differences relative to denervated adipose tissue (p < 0.05).
Figure 5
Figure 5
Expression of lipolytic p-HSL, HSL, ATGL, and FABP4 in intact and denervated inguinal white adipose tissue (IWAT) of intracerebroventricular saline- or BDNF-treated rats. Quantifications of p-HSL, HSL, ATGL, and FABP4 were normalized to GAPDH. Quantifications of p-HSL/GAPDH were also normalized to HSL/GAPDH to obtain p-HSL/HSL. (A) Representative western blot images of expression of p-HSL, HSL, ATGL, and GAPDH; and quantifications of (B) HSL/GAPDH, (C) p-HSL/HSL, (D) ATGL/GAPDH, and (E) FABP4/GAPDH in intact (open bar) and denervated (filled bar) IWAT of saline- or BDNF-treated rats. Two-way ANOVA with the factors “innervation” (N; intact vs. denervated) and “BDNF” (B; icv saline vs. BDNF treatment) and multiple comparisons post hoc Tukey’s test were used to compare relative protein quantities. * Represents significant differences relative to saline-treated rats (p < 0.05).
Figure 5
Figure 5
Expression of lipolytic p-HSL, HSL, ATGL, and FABP4 in intact and denervated inguinal white adipose tissue (IWAT) of intracerebroventricular saline- or BDNF-treated rats. Quantifications of p-HSL, HSL, ATGL, and FABP4 were normalized to GAPDH. Quantifications of p-HSL/GAPDH were also normalized to HSL/GAPDH to obtain p-HSL/HSL. (A) Representative western blot images of expression of p-HSL, HSL, ATGL, and GAPDH; and quantifications of (B) HSL/GAPDH, (C) p-HSL/HSL, (D) ATGL/GAPDH, and (E) FABP4/GAPDH in intact (open bar) and denervated (filled bar) IWAT of saline- or BDNF-treated rats. Two-way ANOVA with the factors “innervation” (N; intact vs. denervated) and “BDNF” (B; icv saline vs. BDNF treatment) and multiple comparisons post hoc Tukey’s test were used to compare relative protein quantities. * Represents significant differences relative to saline-treated rats (p < 0.05).
Figure 6
Figure 6
Expression of lipolytic p-HSL, HSL, ATGL, and FABP4 in intact and denervated retroperitoneal white adipose tissue (RWAT) of intracerebroventricular saline- or BDNF-treated rats. Quantifications of p-HSL, HSL, ATGL, and FABP4 were normalized to GAPDH. Quantifications of p-HSL/GAPDH were also normalized to HSL/GAPDH to obtain p-HSL/HSL. (A) Representative western blot images of expression of p-HSL, HSL, ATGL, and GAPDH; and quantifications of (B) HSL/GAPDH, (C) p-HSL/HSL, (D) ATGL/GAPDH, and (E) FABP4/GAPDH in intact (open bar) and denervated (filled bar) RWAT of saline- or BDNF-treated rats. Two-way ANOVA with the factors “innervation” (N; intact vs. denervated) and “BDNF” (B; icv saline vs. BDNF treatment) and multiple comparisons post hoc Tukey’s test were used to compare relative protein quantities.
Figure 6
Figure 6
Expression of lipolytic p-HSL, HSL, ATGL, and FABP4 in intact and denervated retroperitoneal white adipose tissue (RWAT) of intracerebroventricular saline- or BDNF-treated rats. Quantifications of p-HSL, HSL, ATGL, and FABP4 were normalized to GAPDH. Quantifications of p-HSL/GAPDH were also normalized to HSL/GAPDH to obtain p-HSL/HSL. (A) Representative western blot images of expression of p-HSL, HSL, ATGL, and GAPDH; and quantifications of (B) HSL/GAPDH, (C) p-HSL/HSL, (D) ATGL/GAPDH, and (E) FABP4/GAPDH in intact (open bar) and denervated (filled bar) RWAT of saline- or BDNF-treated rats. Two-way ANOVA with the factors “innervation” (N; intact vs. denervated) and “BDNF” (B; icv saline vs. BDNF treatment) and multiple comparisons post hoc Tukey’s test were used to compare relative protein quantities.
Figure 7
Figure 7
Expression of UCP1 in intact and denervated interscapular brown adipose tissues (BAT) of intracerebroventricular saline- or BDNF-treated rats. Quantification of UCP1 was normalized to GAPDH. (A) Representative western blot image of expression of UCP1 and GAPDH; and (B) quantification of UCP1/GAPDH in intact (open bar) and denervated (filled bar) BAT of saline- or BDNF-treated rats. Two-way ANOVA was used with the factors “innervation” (N; intact vs. denervated) and “BDNF” (B; icv saline vs. BDNF treatment) and multiple comparisons post hoc Tukey’s test were used to compare relative protein quantities.

Similar articles

Cited by

References

    1. Zhu Q., Glazier B.J., Hinkel B.C., Cao J., Liu L., Liang C., Shi H. Neuroendocrine regulation of energy metabolism involving different types of adipose tissues. Int. J. Mol. Sci. 2019;20:2707. doi: 10.3390/ijms20112707. - DOI - PMC - PubMed
    1. Cannon B., Nedergaard J. Brown adipose tissue: Function and physiological significance. Physiol. Rev. 2004;84:277–359. doi: 10.1152/physrev.00015.2003. - DOI - PubMed
    1. Kolditz C.-I., Langin D. Adipose tissue lipolysis. Curr. Opin. Clin. Nutr. Metab. Care. 2010;13:377–381. doi: 10.1097/MCO.0b013e32833bed6a. - DOI - PubMed
    1. Noble E.E., Billington C.J., Kotz C.M., Wang C. The lighter side of BDNF. Am. J. Physiol. Regul. Integr. Comp. Physiol. 2011;300:R1053–R1069. doi: 10.1152/ajpregu.00776.2010. - DOI - PMC - PubMed
    1. Toriya M., Maekawa F., Maejima Y., Onaka T., Fujiwara K., Nakagawa T., Nakata M., Yada T. Long-term infusion of brain-derived neurotrophic factor reduces food intake and body weight via a corticotrophin-releasing hormone pathway in the paraventricular nucleus of the hypothalamus. J. Neuroendocrinol. 2010;22:987–995. doi: 10.1111/j.1365-2826.2010.02039.x. - DOI - PubMed

Publication types

Substances

LinkOut - more resources