

PIV investigation of the flow fields in subject-specific vertebro-basilar (VA-BA) junction
- PMID: 31492145
- PMCID: PMC6731569
- DOI: 10.1186/s12938-019-0711-9
PIV investigation of the flow fields in subject-specific vertebro-basilar (VA-BA) junction
Abstract
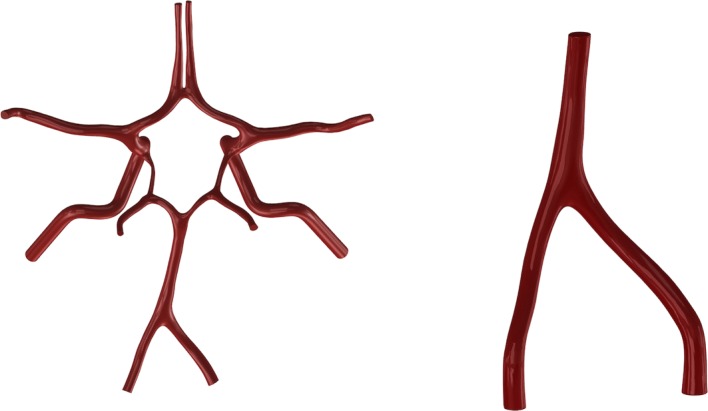
Background: As the only arterial structure of which two main arteries merged into one, the vertebro-basilar (VA-BA) system is one of the favorite sites of cerebral atherosclerotic plaques. The aim of this study was to investigate the detailed hemodynamics characteristics in the VA-BA system.
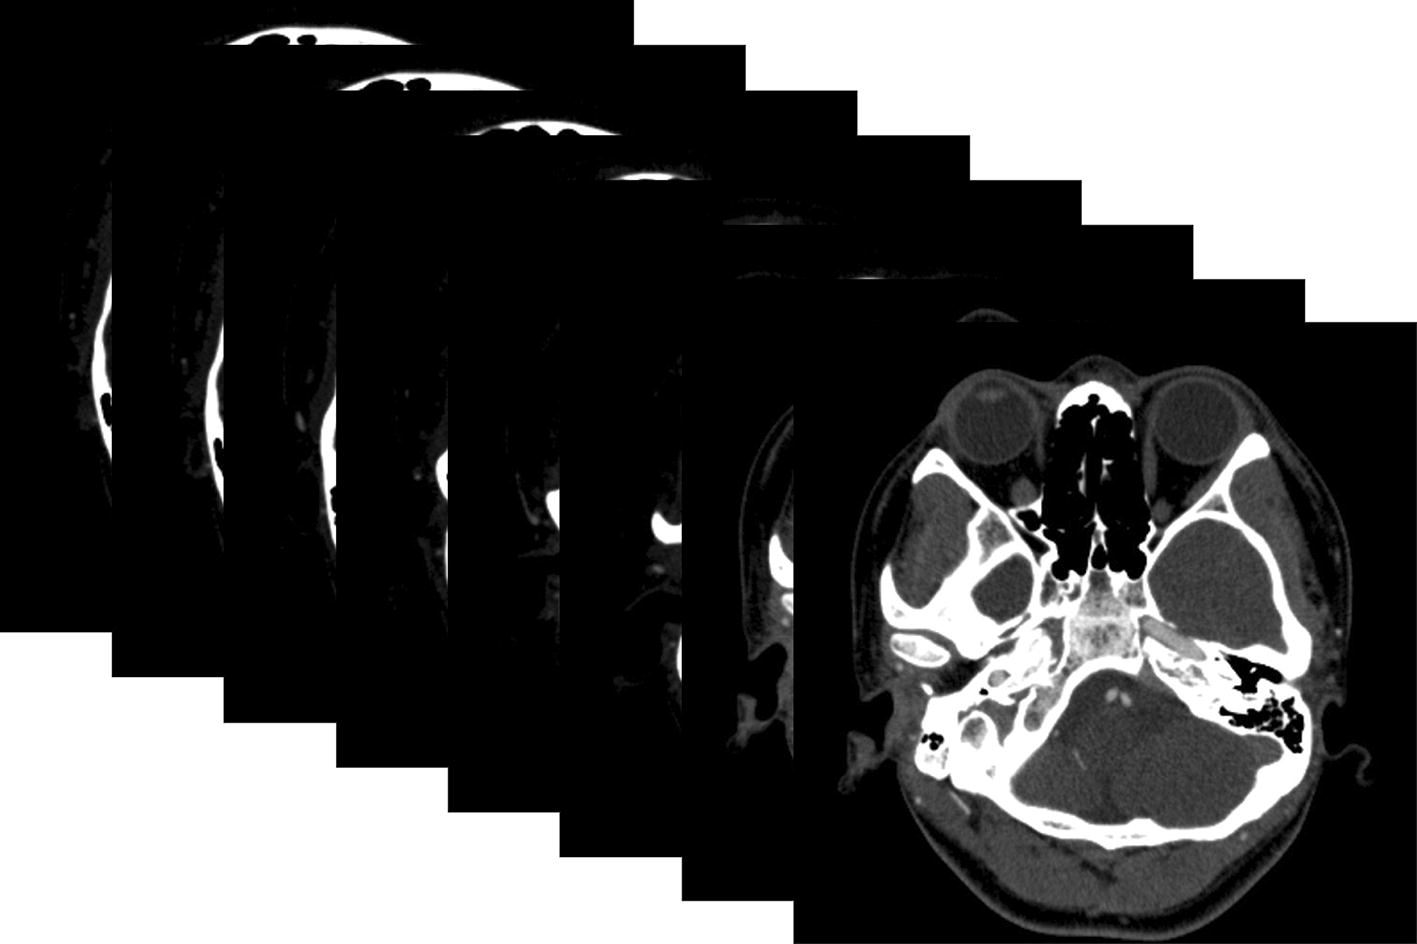
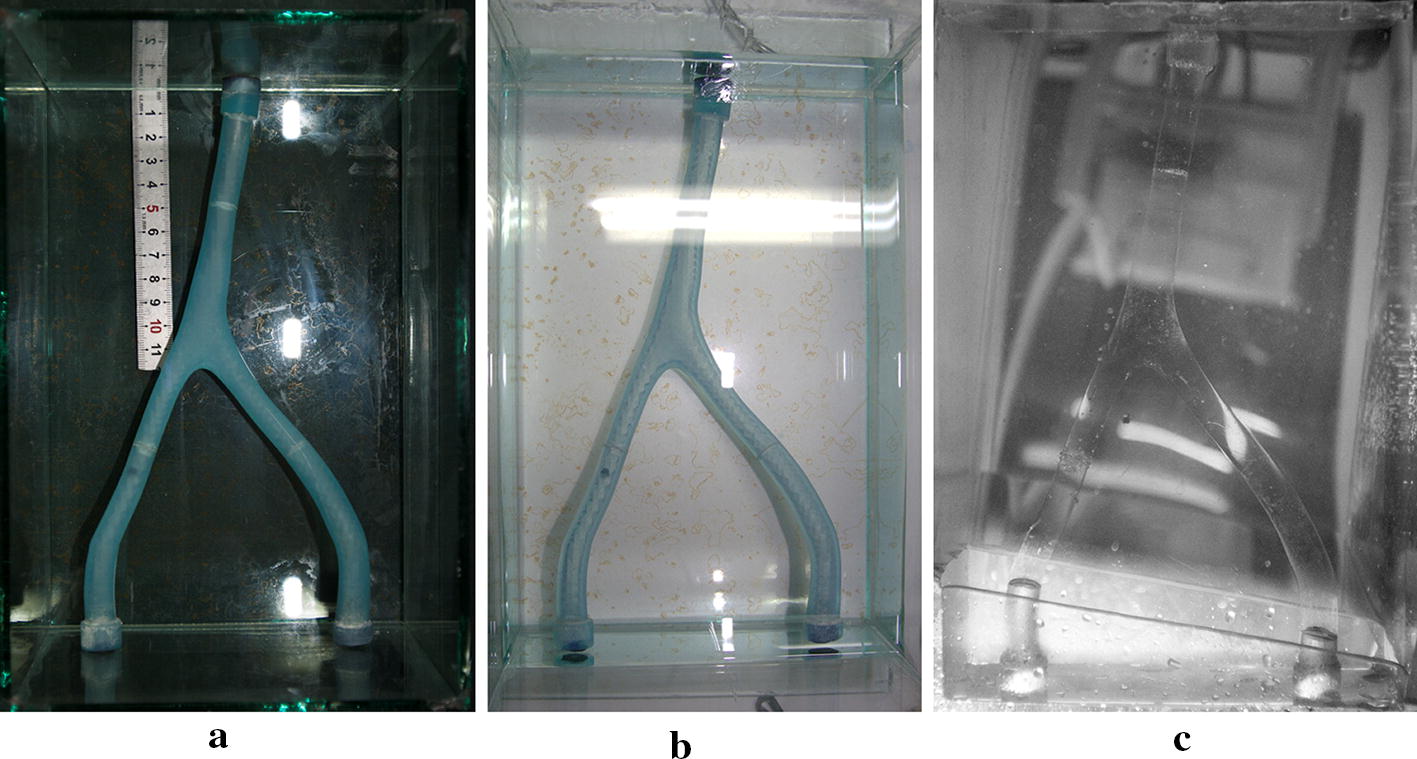
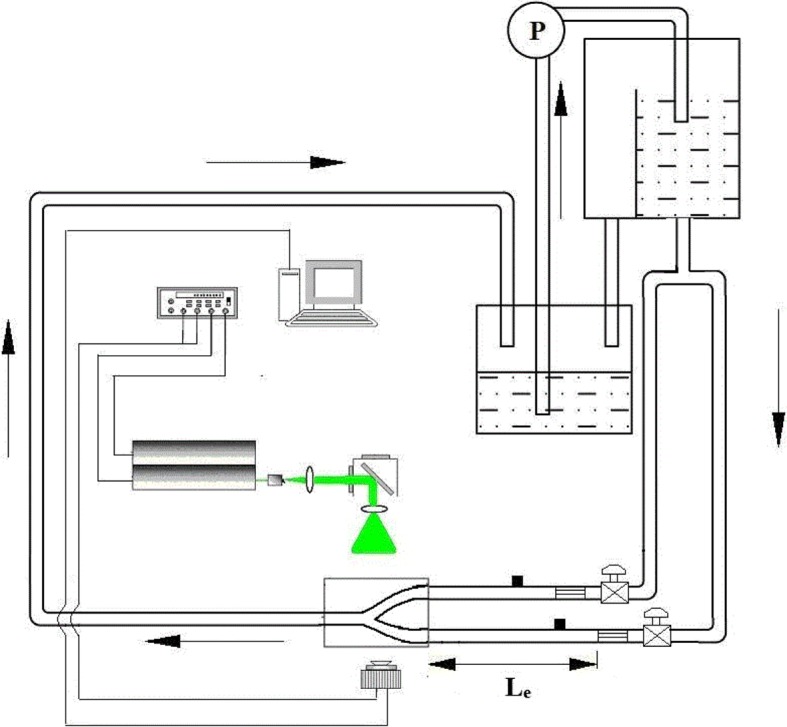
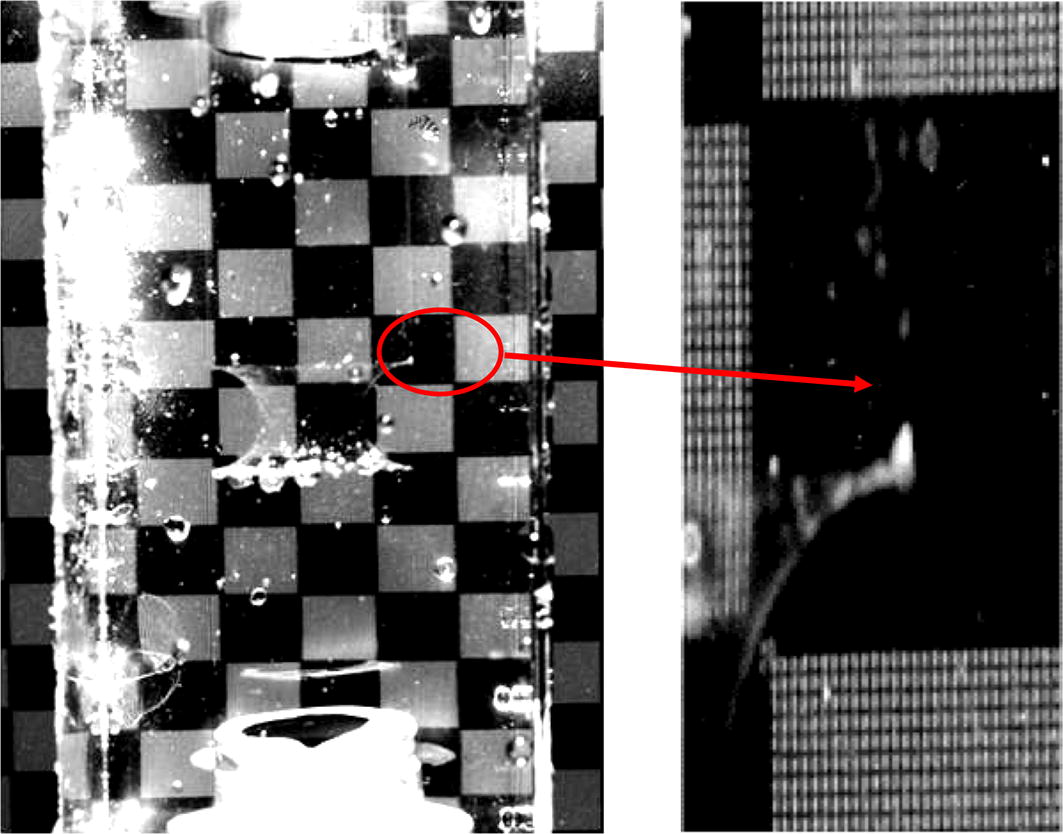
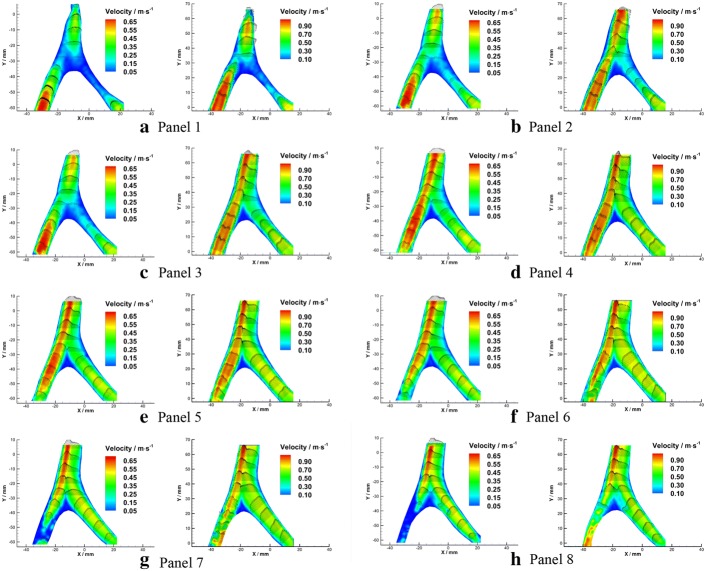
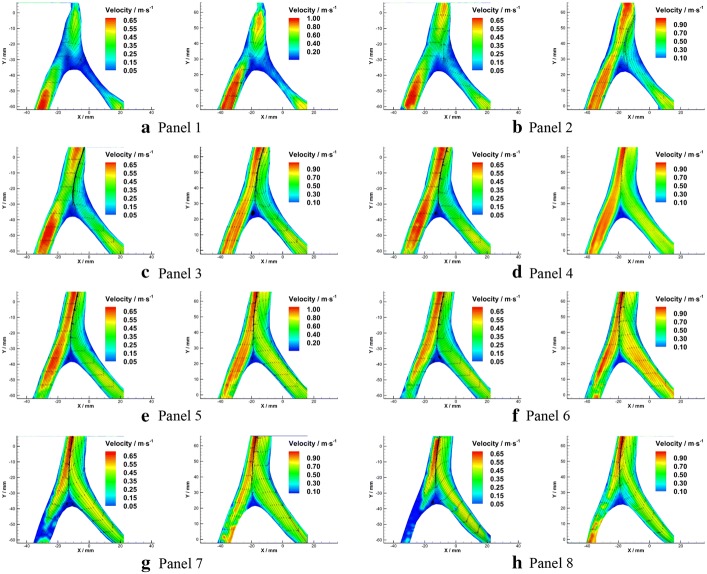
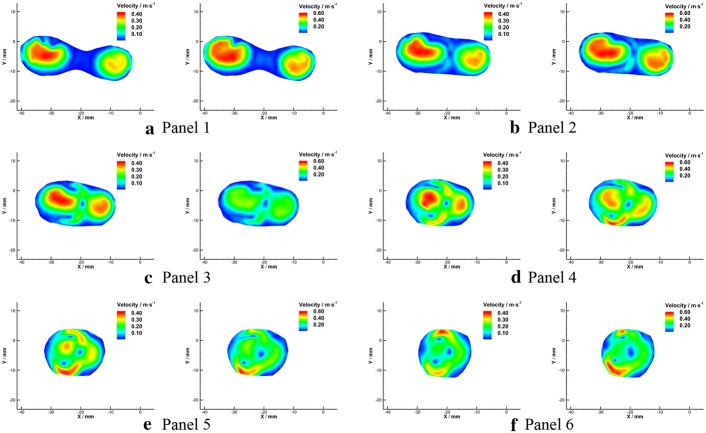
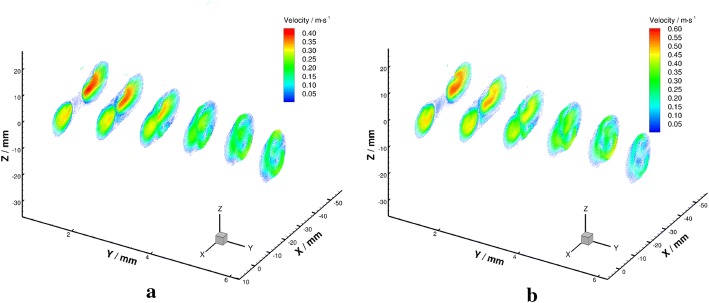
Methods: A scale-up subject-specific flow phantom of VA-BA system was fabricated based on the computed tomography angiography (CTA) scanning images of a healthy adult. Flow fields in eight axial planes and six radial planes were measured and analyzed by using particle image velocimetry (PIV) under steady flow conditions of [Formula: see text], [Formula: see text]. A water-glycerin mixture was used as the working fluid.
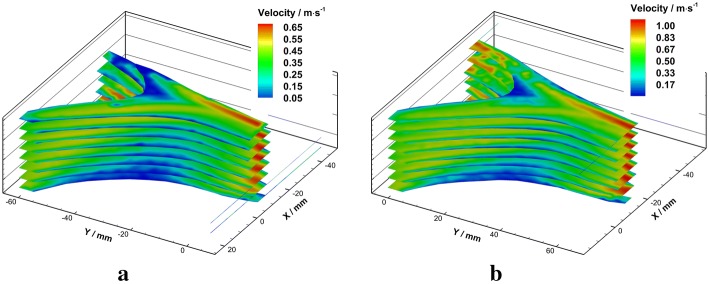
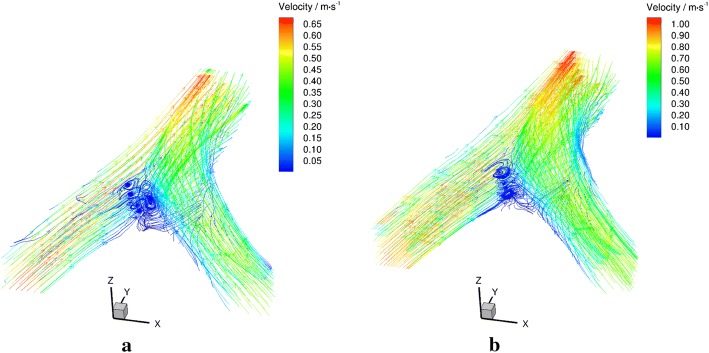
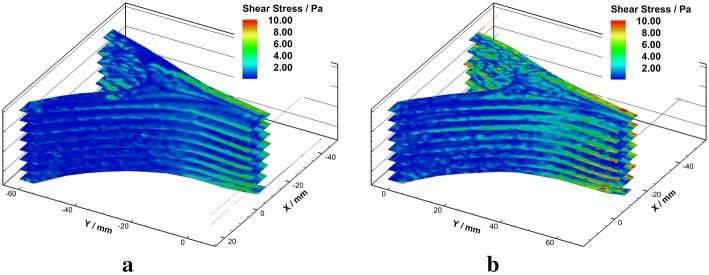
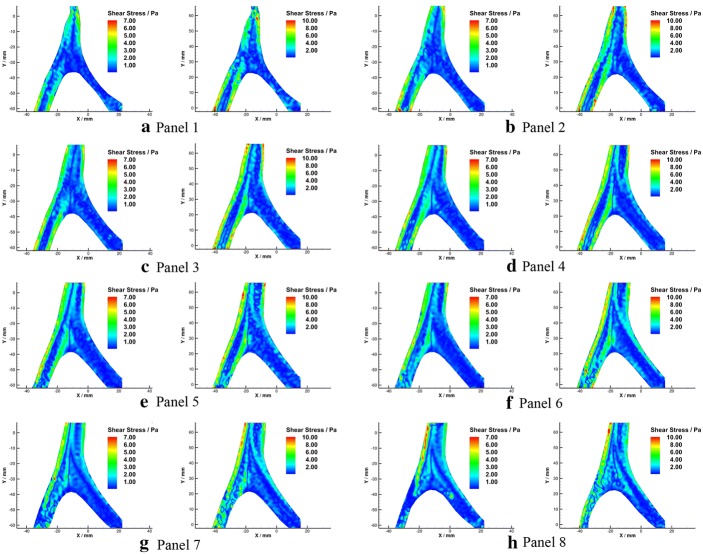
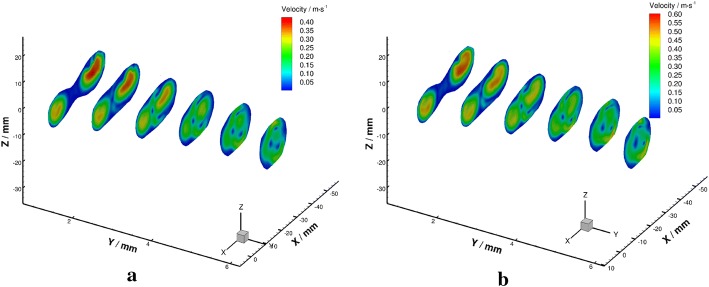
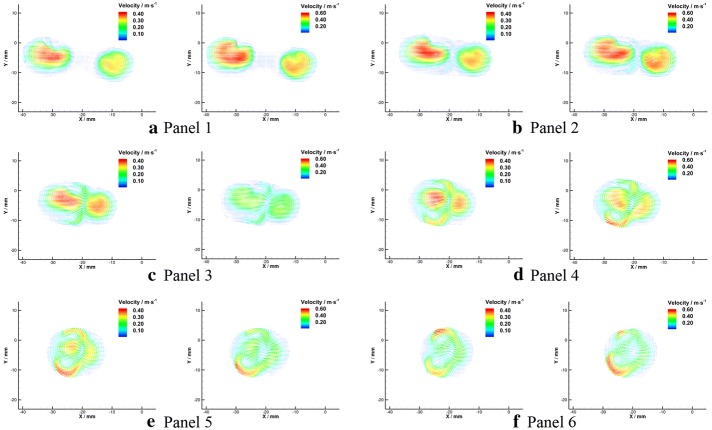
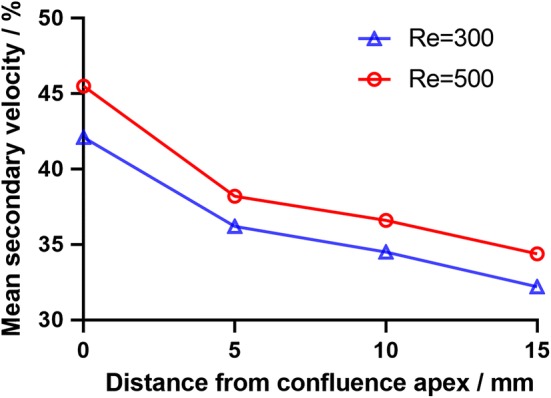
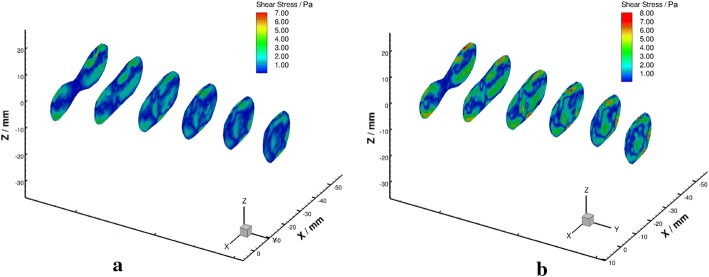
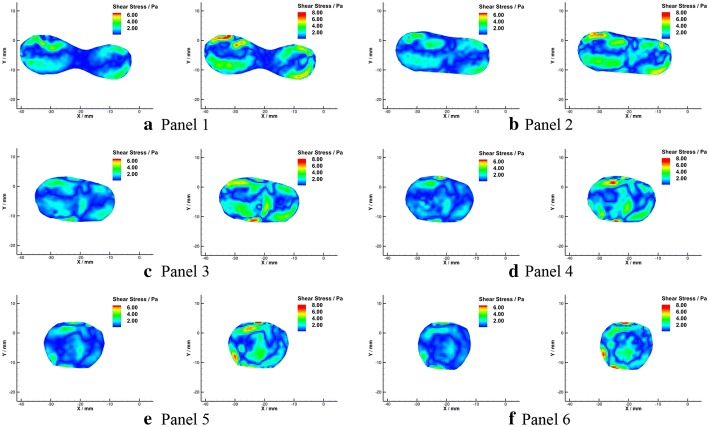
Results: The flow in the current model exhibited highly three-dimensional characteristics. The confluence of VAs flow formed bimodal velocity distribution near the confluence apex. Due to the asymmetrical structural configuration, the bimodal velocity profile skewed towards left, and sharper peaks were observed under higher Reynolds condition. Secondary flow characterized by two vortices formed in the radial planes where 10 mm downstream the confluence apex and persists along the BA under both Reynolds numbers. The strength of secondary flow under [Formula: see text] is around 8% higher than that under [Formula: see text], and decayed nonlinearly along the flow direction. In addition, a low momentum recirculation region induced by boundary layer separation was observed near the confluence apex. The wall shear stress (WSS) in the recirculation area was found to be lower than 0.4 Pa. This region coincides well with the preferential site of vascular lesions in the VA-BA system.
Conclusions: This preliminary study verified that the subject-specific in-vitro experiment is capable of reflecting the detailed flow features in the VA-BA system. The findings from this study may help to expand the understanding of the hemodynamics in the VA-BA system, and further clarifying the mechanism that underlying the localization of vascular lesions.
Keywords: Hemodynamics; In-vitro; PIV; VA-BA.
Conflict of interest statement
The authors declare that they have no competing interests.
Figures
Similar articles
-
Development of an Experimental and Digital Cardiovascular Arterial Model for Transient Hemodynamic and Postural Change Studies: "A Preliminary Framework Analysis".Cardiovasc Eng Technol. 2018 Mar;9(1):1-31. doi: 10.1007/s13239-017-0332-z. Epub 2017 Nov 9. Cardiovasc Eng Technol. 2018. PMID: 29124548
-
The influence of the angle of confluence on the flow in a vertebro-basilar junction model.J Biomech. 1996 Mar;29(3):281-99. doi: 10.1016/0021-9290(95)00064-x. J Biomech. 1996. PMID: 8850635
-
Formation of Vortices in Idealised Branching Vessels: A CFD Benchmark Study.Cardiovasc Eng Technol. 2020 Oct;11(5):544-559. doi: 10.1007/s13239-020-00477-9. Epub 2020 Jul 14. Cardiovasc Eng Technol. 2020. PMID: 32666327
-
The influence of blood velocity and vessel geometric parameters on wall shear stress.Med Eng Phys. 2024 Feb;124:104112. doi: 10.1016/j.medengphy.2024.104112. Epub 2024 Jan 28. Med Eng Phys. 2024. PMID: 38418022
-
Wall shear stress--an important determinant of endothelial cell function and structure--in the arterial system in vivo. Discrepancies with theory.J Vasc Res. 2006;43(3):251-69. doi: 10.1159/000091648. Epub 2006 Feb 20. J Vasc Res. 2006. PMID: 16491020 Review.
References
MeSH terms
Grants and funding
LinkOut - more resources
Full Text Sources
Research Materials
Miscellaneous
