. 2019 Nov 6;104(3):529-543.e6.
doi: 10.1016/j.neuron.2019.08.001. Epub 2019 Sep 3.

Phase Separation-Mediated TARP/MAGUK Complex Condensation and AMPA Receptor Synaptic Transmission

Affiliations

Phase Separation-Mediated TARP/MAGUK Complex Condensation and AMPA Receptor Synaptic Transmission

Menglong Zeng et al. Neuron. .

Abstract

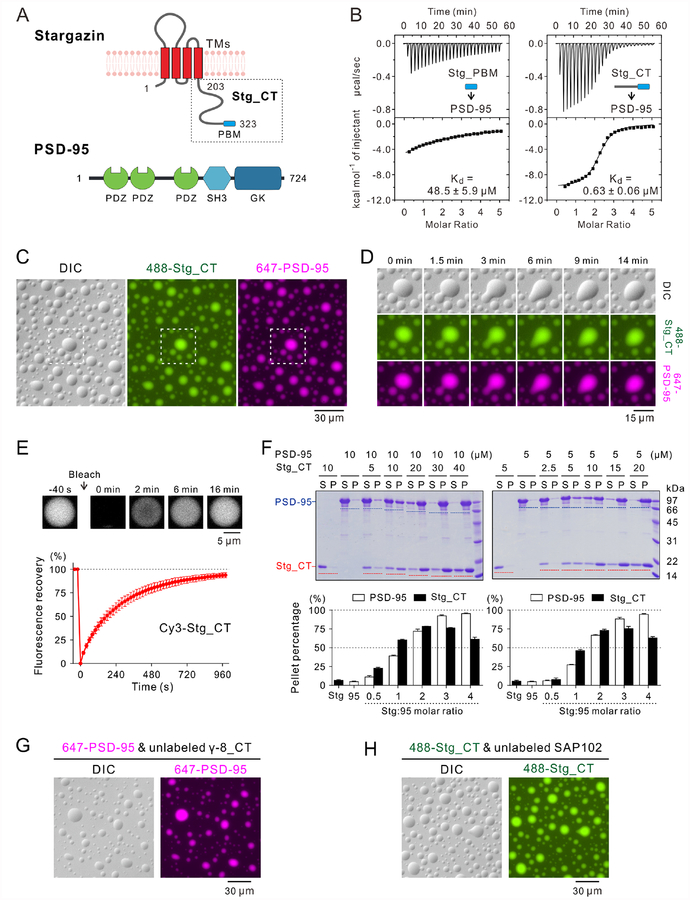
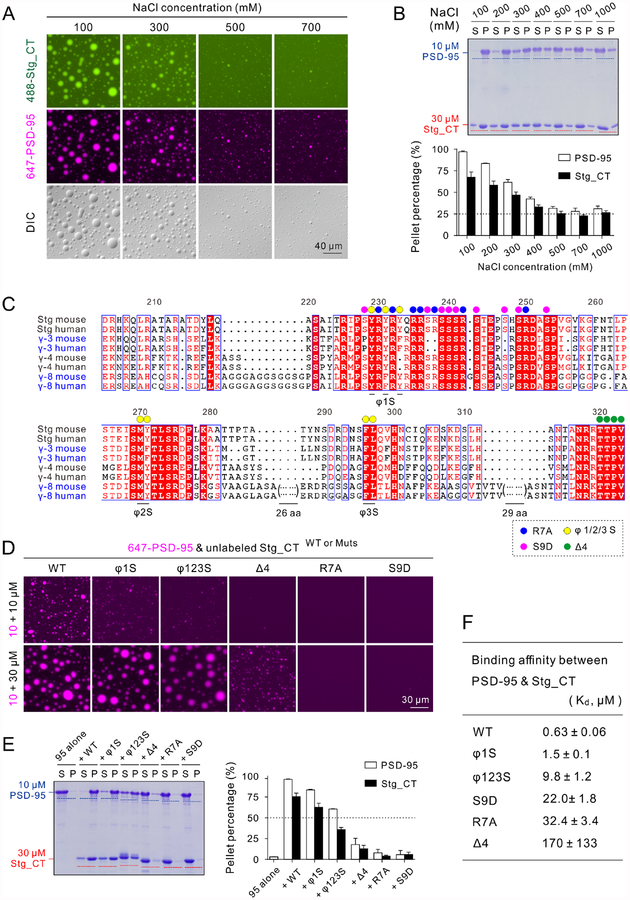
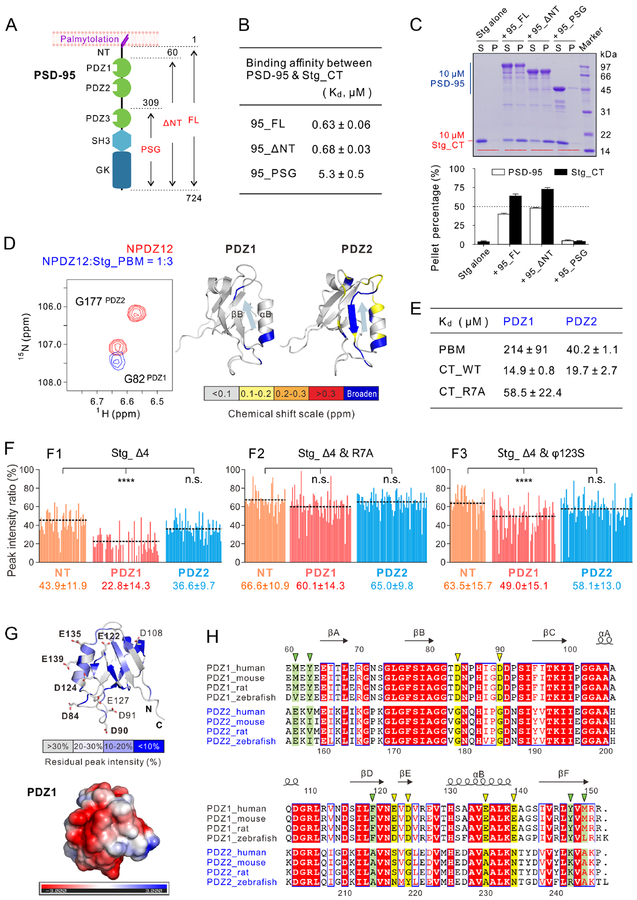
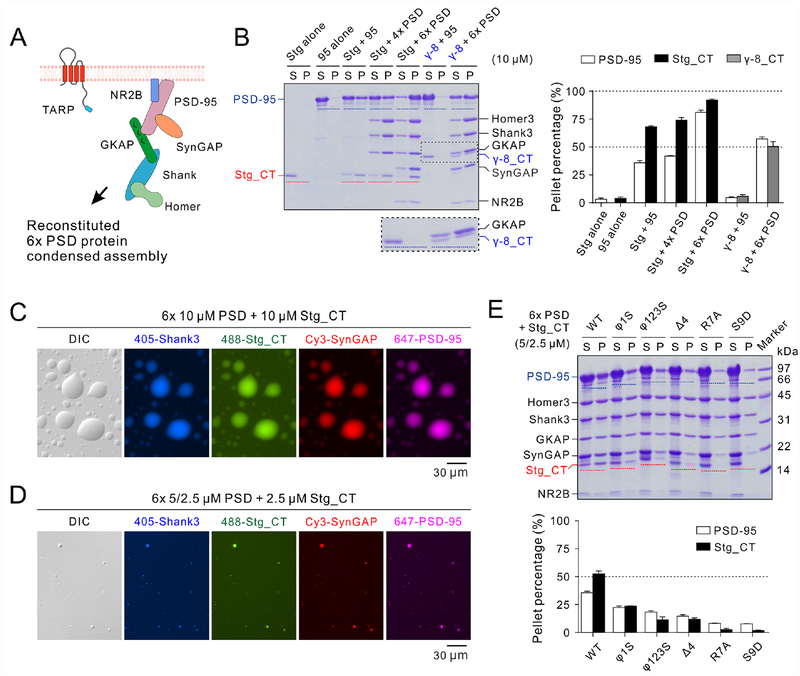
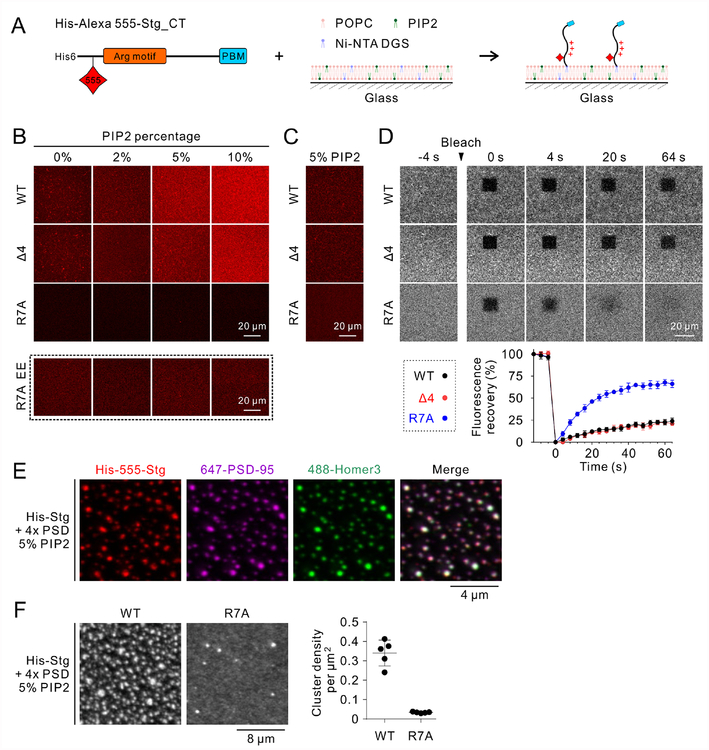
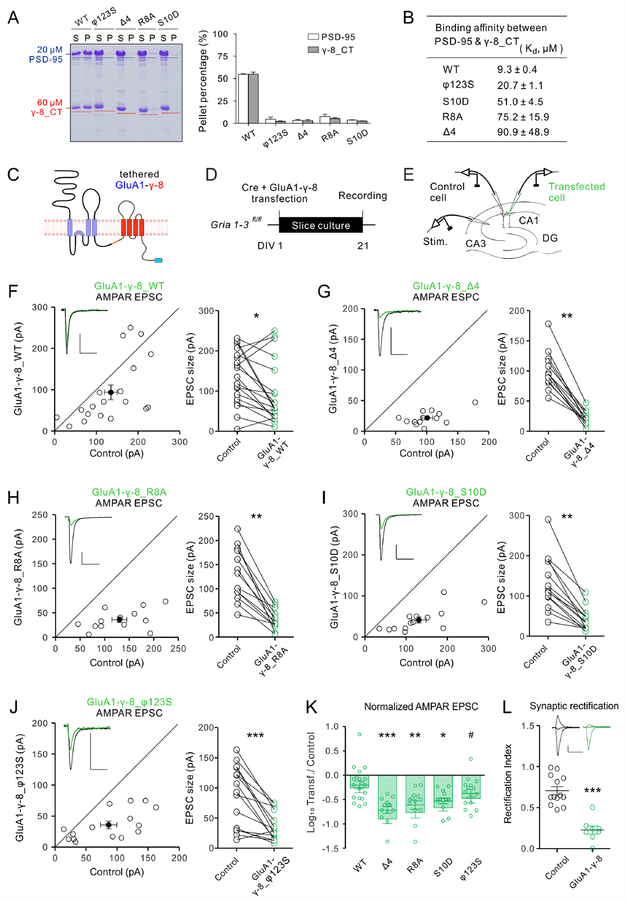
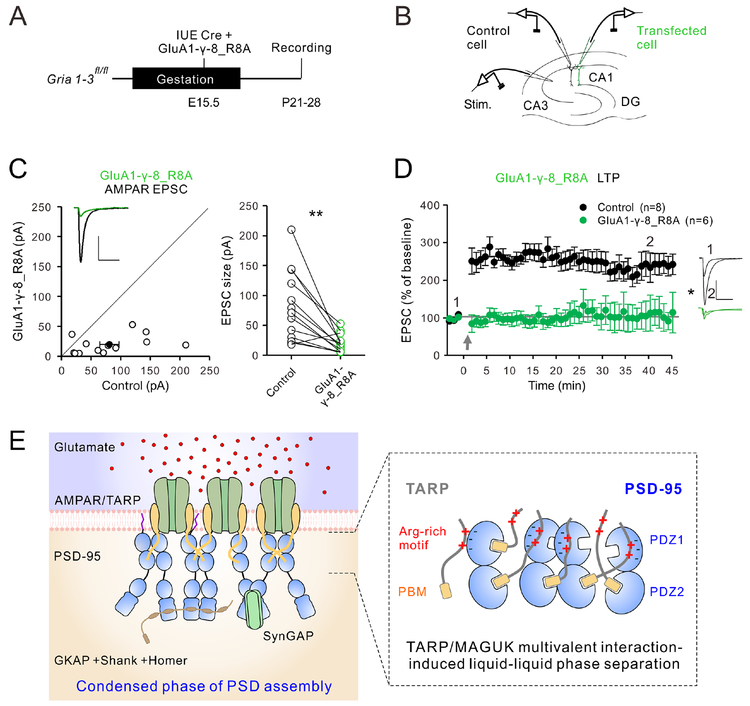
Transmembrane AMPA receptor (AMPAR) regulatory proteins (TARPs) modulate AMPAR synaptic trafficking and transmission via disc-large (DLG) subfamily of membrane-associated guanylate kinases (MAGUKs). Despite extensive studies, the molecular mechanism governing specific TARP/MAGUK interaction remains elusive. Using stargazin and PSD-95 as the representatives, we discover that the entire tail of stargazin (Stg_CT) is required for binding to PSD-95. The PDZ binding motif (PBM) and an Arg-rich motif upstream of PBM conserved in TARPs bind to multiple sites on PSD-95, thus resulting in a highly specific and multivalent stargazin/PSD-95 complex. Stargazin in complex with PSD-95 or PSD-95-assembled postsynaptic complexes form highly concentrated and dynamic condensates via phase separation, reminiscent of stargazin/PSD-95-mediated AMPAR synaptic clustering and trapping. Importantly, charge neutralization mutations in TARP_CT Arg-rich motif weakened TARP's condensation with PSD-95 and impaired TARP-mediated AMPAR synaptic transmission in mice hippocampal neurons. The TARP_CT/PSD-95 interaction mode may have implications for understanding clustering of other synaptic transmembrane proteins.

Keywords: AMPAR; MAGUK; PSD-95; TARP; biological condensates; phase separation; postsynaptic density; stargazin; synaptic transmission.


Conflict of interest statement

DECLARATION OF INTERESTS

The authors declare no competing interests.

Figures

Figure 1:
Figure 1:. Specific interaction between Stg_CT & PSD-95 triggers liquid-liquid phase separation
A: Schematic diagram showing the domain organization of Stg and PSD-95. B: ITC-based measurements comparing PSD-95 binding to Stg_PBM and Stg_CT. Stg_PBM or Stg_CT (250 μM) was titrated into PSD-95 (10 μM). C: DIC and fluorescence images showing that the mixtures of 30 μM Alexa 488-labeled Stg_CT and 10 μM Alexa 647-labeled PSD-95 formed LLPS at room temperature and both components were highly co-enriched in micron-sized droplets. Only 1% of each protein was labeled by the indicated fluorophores and this labeling ratio was used throughout this study unless otherwise specified. The dashed box is selected for zoom-in analysis in panel D. D: Zoom-in and time-lapse images showing small droplets coalesced into larger ones (0–9 min) and the morphology of newly formed large droplet progressively relaxed to a spherical shape (9–14 min). E: FRAP assay showing the Stg_CT exchanging kinetics between the condensed droplets and surrounding aqueous solutions. Cy3-labeled Stg_CT (at 30 μM with only 0.5% of Stg_CT Cy3-labeled) was mixed with 10 μM unlabeled PSD-95. The curve represented the averaged signals from 10 droplets with a diameter ~9 μm and the data were plotted as mean ± SD. F: Representative SDS-PAGE and quantification data of sedimentation experiments showing the distributions of Stg_CT and PSD-95 recovered from the aqueous phase/supernatant (S) and the condensed phase/pellet (P). Proteins were mixed at the indicated concentrations. Results were from 3 independent batches of sedimentation experiments and represented as mean ± SD. G-H: DIC and fluorescence images showing that the mixtures of (G) 30 μM unlabeled TARP γ−8_CT and 10 μM Alexa 647-labeled PSD-95; or (H) 30 μM Alexa 488-labeled Stg_CT and 10 μM unlabeled SAP102 formed LLPS at room temperature. See also Figure S1
Figure 2:
Figure 2:. Sequence upstream of PBM is required for Stg_CT to bind to PSD-95 and to undergo LLPS.
A: DIC and fluorescence images showing high NaCl concentrations weakened but did not disrupt Stg_CT & PSD-95 LLPS. 30 μM Alexa 488-labeled Stg_CT were mixed with 10 μM Alexa 647-labeled PSD-95 at indicated NaCl concentrations. Imaging settings in all panels were identical. B: Sedimentation assay showing progressively decreased LLPS of the Stg_CT and PSD-95 mixtures upon increasing NaCl concentrations. The LLPS levels reached a plateau of ~25% once NaCl concentration reached 500 mM or higher. Indicated concentrations of NaCl were added into protein mixtures containing 30 μM Stg_CT and 10 μM PSD-95. C: Sequence alignment showing conserved motifs identified in cytoplasmic tails of TARP family members. Mutated residues are denoted by colored circles as indicated. Two stretches of Gly- and Pro/Ala-rich sequences in TARP γ−8_CT are omitted but are shown in a more detailed alignment in Figure S1A. D: Fluorescence images showing a series of Stg_CT mutants with progressively weakened LLPS capability with PSD-95. 10 μM Alexa 647-labeled PSD-95 were mixed with 10 μM or 30 μM unlabeled various forms of Stg_CT. Identical imaging settings were used for all groups. E: Sedimentation assay quantifying protein distributions in aqueous/condensed phases when mixed 10 μM PSD-95 with 30 μM Stg_CT proteins. The sedimentation results of apo-form Stg_CT proteins were in Figure S2B. The quantification results in panels B and E were from 3 independent batches of sedimentations experiments and represented as mean ± SD. F: ITC-measured binding affinities between PSD-95 and various forms of Stg_CT. The ITC raw data are listed in Figure S2C. See also Figures S1–S2
Figure 3:
Figure 3:. The PDZ12 tandem of PSD-95 binds to the entire Stg_CT with an unexpected mode
A: Schematic diagram showing the perpendicular orientation of PSD-95 with respect to the PSD plasma membranes. The domain organization and boundary of PSD-95 fragments used in this study are indicated. B: Table listing the ITC-measured binding affinities between WT or truncated PSD-95 and Stg_CT. The affinities were measured by titrating 250 μM Stg_CT into 10 μM PSD-95_WT or NT or 25 μM PSD-95_PSG. C: Sedimentation assay showing phase separation between 10 μM Stg_CT and 10 μM WT or truncated PSD-95. The quantification results were from 3 independent batches of sedimentations experiments and represented as mean ± SD. The sedimentation results of PSD-95 proteins alone are in Figure S3A. D: A selected region of 1H,15N HSQC spectra of PSD-95 NPDZ12 with or without three molar ratios of the Stg_PBM peptide (Left, full spectra are shown in Figure S4A). Mapping of the backbone amide chemical shift changes of PDZ12 induced by Stg_PBM binding (Right). The result was derived by comparing the 1H,15N HSQC spectra of apo form PDZ12 to those PDZ12 titrated with Stg_PBM. E: Table listing the ITC-measured binding affinities of Stg_PBM or Stg_CT to PSD-95 PDZ1 or PDZ2. The ITC raw data are listed in Figures S3C and S3D. F: Quantification of backbone amide peak broadening of PSD-95 NPDZ12 upon binding to Stg_CT_D4 mutants: Stg_CT_ D4 (F1), Stg_CT_ D4&R7A (F2) and Stg_CT_ D4&φ123S (F3). The average peak intensity of each domain is indicated by a dashed line. The peak intensity and error were represented as mean ± SD below each domain. Statistical significance was analyzed using one way ANOVA with Bonferroni multiple comparison test. ****, p<0.0001; ns, not significant. G: Upper panel: mapping of the Stg_CT_D4 binding-induced backbone amide peak broadening of PDZ1 on to a clustered surface of the domain. Negative-charged residues located in this surface is drawn with the stick model. Lower panel: surface representation showing the electrostatic potential of PSD-95 PDZ1 contoured at ±3-kT/e. H: Sequence alignment analysis of PSD-95 PDZ1 and PDZ2, showing a high overall sequence identity between the two domains. Residues corresponding to the negative-charged residues that are uniquely conserved in PDZ1 are indicated using yellow triangles above the alignment. Hydrophobic residues that specifically conserved in PDZ1 are highlighted using green triangles. See also Figures S3–S4
Figure 4:
Figure 4:. TARP_CT incorporating into the reconstituted 6× PSD complexes through LLPS
A: Schematic diagram showing the protein interacting network of the reconstituted 6× PSD (Zeng et al., 2018). B: Sedimentation experiments showing the protein distributions of different PSD components in aqueous/condensed phases. 10 μM Stg_CT or TARP γ−8_CT were mixed with PSD-95 alone or 4× PSD (including PSD-95, GKAP, Shank3 and Homer3) or 6× PSD (including PSD-95, GKAP, Shank3, Homer3, SynGAP and NR2B tail) with each component at 10 μM (except for NR2B at 20 μM, (Zeng et al., 2018)). Zoom-in of the dashed box shows the TARP γ−8_CT distribution. Quantifications of the TARPs and PSD-95 distributions are shown at right. C: DIC and fluorescence images showing the mixtures of 10 μM “Stg + 6× PSD” formed LLPS at room temperature. Stg_CT, PSD-95, Shank3 and SynGAP were labeled by different fluorophores as indicated and were highly co-concentrated in LLPS-mediated droplets. Homer3 and NR2B tail were not labeled and thus invisible. Each component was at 10 μM (except for NR2B at 20 μM). D: DIC and fluorescence images showing the mixtures of “Stg + 6× PSD” underwent LLPS at physiological protein concentrations and molar ratios. Proteins were labeled as illustrated in panel C above. 5 μM PSD-95 and SynGAP were mixed with GKAP, Shank3, Homer3, Stg_CT, NR2B tail each at 2.5 μM. E: Sedimentation assay showing the LLPS levels of Stg_CT (WT and mutants) when mixed with 6× PSD at protein concentrations as illustrated in panel D. The results in panels B and E were from 3 independent batches of sedimentations experiments and represented as mean ± SD.
Figure 5:
Figure 5:. His-Stg_CT undergoes phase transition-mediated clustering with 4× PSD scaffolds on negatively charged lipid bilayers.
A: Schematic diagram showing the design of His-Alexa 555-Stg_CT and its tethering to the supported negatively charged lipid bilayer. B: Confocal images showing the membrane bound levels of different His-Stg_CT variants with the presence of 0–10% PIP2. Same concentration of His-Stg_CT (2 μM) was added to the system. In each variant, only 10% of His-Stg_CT was fluorescently labeled to avoid potential artifacts rendered by fluorescence probes. Same imaging parameters were applied for intensity comparison, except for the R7A EE group in which elongated exposure time was applied to confirm R7A’s membrane binding. C: Representative confocal images showing similar amount of His-Stg_CT were bound to the 5% PIP2-containing lipid bilayers. Initial protein concentrations were adjusted to WT/Δ4/R7A = 0.2/0.2/4 μM. Same initial protein concentrations were used in the experiments in panels D-F. D: FRAP analysis comparing the mobility of different His-Stg_CT variants on lipid bilayers with the presence of 5% PIP2. The FRAP curves represented the averaged results from 5 bleached regions with a squared-shape size of 14 μm2. Data were presented as mean ± SD. E: Confocal images showing His-Stg_CT clustering on negatively charged membrane upon addition of 4× PSD scaffolds (PSD-95, GKAP, Shank3 and Homer3, each at 2 μM; same concentrations were used in panel F). His-Alexa 555-Stg_CT were co-localized with Alexa 647-PSD-95 and Alexa 488-Homer3. GKAP and Shank3 were unlabeled and thus invisible. F: Confocal images showing R7A mutation profoundly diminished Stg_CT clustering upon addition of 4× PSD scaffolds. Each cluster was identified as an area larger than 0.05 μm2 and with a mean fluorescent intensity at least three-folds higher than the mean fluorescent intensity before adding 4× PSD scaffolds. Data were presented as mean ± SD.
Figure 6:
Figure 6:. AMPAR EPSCs upon endogenous AMPAR replacement with tethered GluA1-γ−8.
A: Sedimentation experiments showing that, in contrast to WT TARP γ−8_CT, no LLPS were observed when mixing 60 μM mutant forms TARP γ−8_CT and 20 μM PSD-95. The quantification results were from 3 independent batches of sedimentation experiments and represented as mean ± SD. B: Table listing the ITC-measured binding affinities between PSD-95 and different forms of TARP γ−8_CT. The raw data are shown in Figure S5A. C: Schematic diagram showing the topology of the tethered GluA1-γ−8. D: Scheme of the AMPAR replacement with tethered GluA1-γ−8 and timeline of the experiment. E: Scheme of simultaneous dual whole-cell recording in the hippocampus. F-J: Scatterplots of AMPAR EPSC for single pairs (open circles) of control and GluA1-γ−8_WT (F, n = 19 pairs), GluA1-γ−8_Δ4 (G, n =13 pairs), GluA1-γ−8_R8A (H, n = 13 pairs), GluA1-γ−8_S10D (I, n = 14 pairs) or GluA1-γ−8_φ123S (J, n = 15 pairs). Filled circles represent mean ± SEM. Insets show sample current traces from control (black) and transfected (green) neurons. Scale bars: 50 pA, 50 ms. K: Summary plot comparing the log10 of the transfected/control neuron AMPAR EPSC ratio in all conditions tested. L: Endogenous AMPAR replacement with recombinant GluA1-γ−8 constructs resulted in rectified synaptic AMPAR currents (n = 13 control and 8 transfected cells). Statistical significance was analyzed using the Wilcoxon signed-rank test in F-J and Mann–Whitney U test in L. One way ANOVA with Bonferroni multiple comparison test was used to compare relevant groups in K. * p < 0.05, ** p < 0.01, and *** p < 0.001 vs. control condition. # p < 0.05 vs. GluA1-γ−8_Δ4 condition. See also Figures S5–S6
Figure 7:
Figure 7:. Long-term potentiation in GluA1-γ−8 R8A expressing CA1 pyramidal neurons and working model of AMPAR-TARP synaptic clustering.
A: Timeline of the experiment. B: Scheme of the AMPAR replacement strategy and dual whole-cell recordings from transfected (green) and control (black) CA1 pyramidal neurons. C: Scatterplot (left) and paired dot plot (right) of AMPAR EPSCs for single pairs (open circles) of control and Cre + GluA1-γ−8_R8A expressing cells transfected by in utero electroporation (n=13). Filled circle represents mean ± SEM. Inset shows sample current traces from control (black) and transfected (green) neurons. D: Plots showing mean ± SEM. AMPAR EPSC amplitude of control (black) and Cre + GluA1-γ−8_R8A expressing CA1 pyramidal neurons normalized to the mean AMPAR EPSC amplitude before LTP induction (arrow). Insets shows sample current traces before (1) and 40 min after (2) LTP induction from control (black) and transfected (green) neurons. LTP induction is indicated with a gray arrow. Scale bars: 50 pA, 50 ms. Statistical significance was analyzed using the Wilcoxon signed-rank test in C. Mann–Whitney U test was used in D. * p < 0.05, ** p < 0.01. E: A model depicting AMPAR clustering at PSD via multivalent TARP/PSD-95 interaction-mediated condensate formation by LLPS.

Similar articles

Cited by

References

    1. Araki Y, Zeng M, Zhang M, and Huganir RL (2015). Rapid dispersion of SynGAP from synaptic spines triggers AMPA receptor insertion and spine enlargement during LTP. Neuron 85, 173–189. - PMC - PubMed
    1. Banani SF, Lee HO, Hyman AA, and Rosen MK (2017). Biomolecular condensates: organizers of cellular biochemistry. Nat Rev Mol Cell Biol 18, 285–298. - PMC - PubMed
    1. Bats C, Groc L, and Choquet D (2007). The interaction between Stargazin and PSD-95 regulates AMPA receptor surface trafficking. Neuron 53, 719–734. - PubMed
    1. Biederer T, Kaeser PS, and Blanpied TA (2017). Transcellular Nanoalignment of Synaptic Function. Neuron 96, 680–696. - PMC - PubMed
    1. Borgdorff AJ, and Choquet D (2002). Regulation of AMPA receptor lateral movements. Nature 417, 649–653. - PubMed

Publication types