. 2019 Sep:47:518-528.
doi: 10.1016/j.ebiom.2019.08.051. Epub 2019 Sep 3.

Multi-omics signature of brain amyloid deposition in asymptomatic individuals at-risk for Alzheimer's disease: The INSIGHT-preAD study

Affiliations

Multi-omics signature of brain amyloid deposition in asymptomatic individuals at-risk for Alzheimer's disease: The INSIGHT-preAD study

Laura Xicota et al. EBioMedicine. 2019 Sep.

Abstract

Background: One of the biggest challenge in Alzheimer's disease (AD) is to identify pathways and markers of disease prediction easily accessible, for prevention and treatment. Here we analysed blood samples from the INveStIGation of AlzHeimer's predicTors (INSIGHT-preAD) cohort of elderly asymptomatic individuals with and without brain amyloid load.

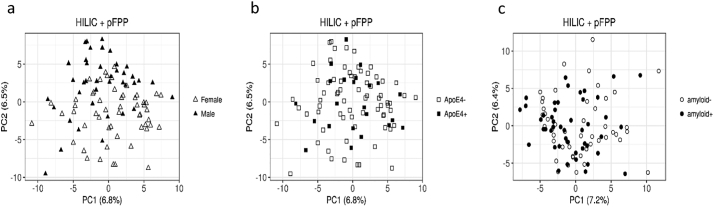
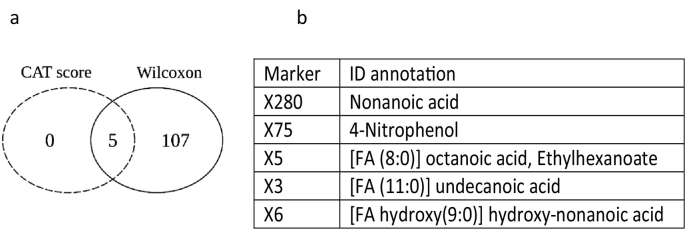
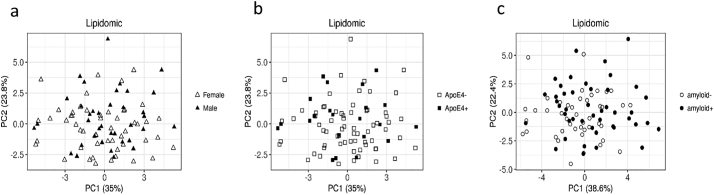
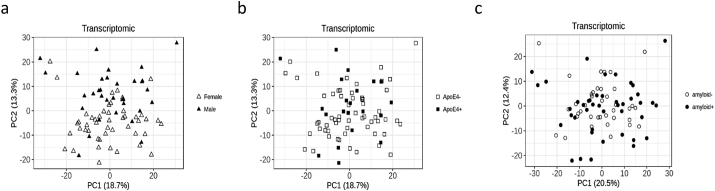
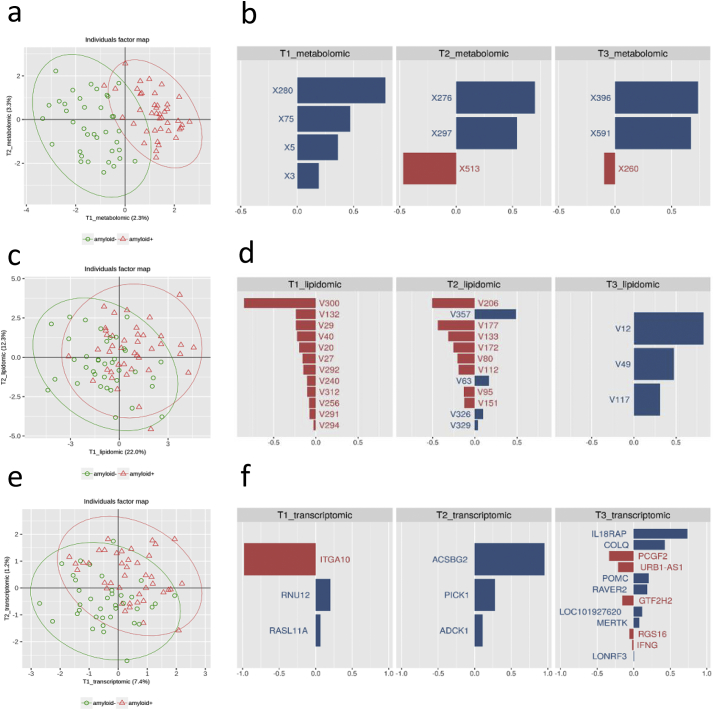
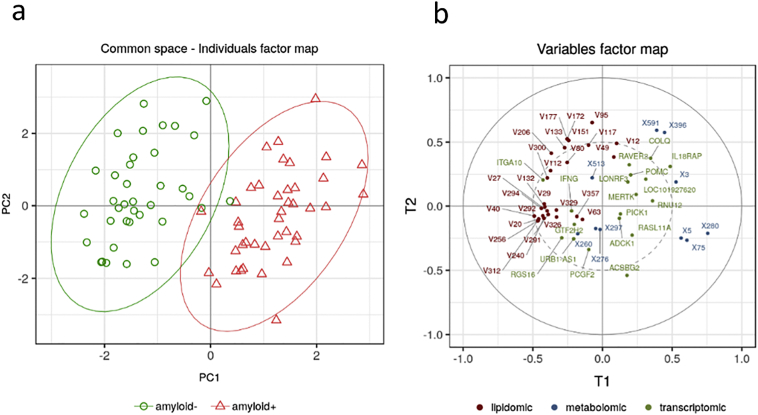
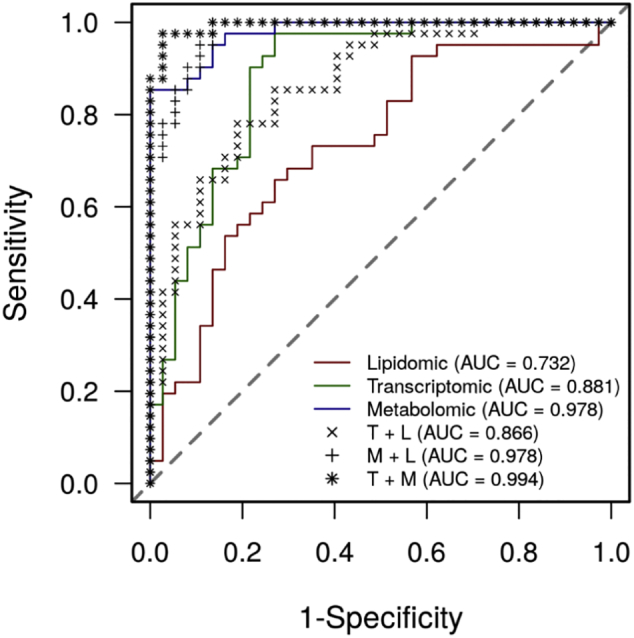
Methods: We performed blood RNAseq, and plasma metabolomics and lipidomics using liquid chromatography-mass spectrometry on 48 individuals amyloid positive and 48 amyloid negative (SUVr cut-off of 0·7918). The three data sets were analysed separately using differential gene expression based on negative binomial distribution, non-parametric (Wilcoxon) and parametric (correlation-adjusted Student't) tests. Data integration was conducted using sparse partial least squares-discriminant and principal component analyses. Bootstrap-selected top-ten features from the three data sets were tested for their discriminant power using Receiver Operating Characteristic curve. Longitudinal metabolomic analysis was carried out on a subset of 22 subjects.

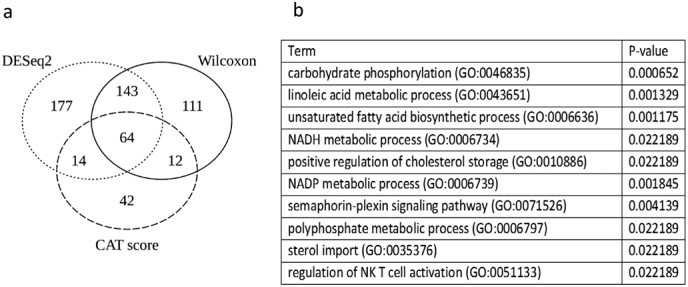
Findings: Univariate analyses identified three medium chain fatty acids, 4-nitrophenol and a set of 64 transcripts enriched for inflammation and fatty acid metabolism differentially quantified in amyloid positive and negative subjects. Importantly, the amounts of the three medium chain fatty acids were correlated over time in a subset of 22 subjects (p < 0·05). Multi-omics integrative analyses showed that metabolites efficiently discriminated between subjects according to their amyloid status while lipids did not and transcripts showed trends. Finally, the ten top metabolites and transcripts represented the most discriminant omics features with 99·4% chance prediction for amyloid positivity.

Interpretation: This study suggests a potential blood omics signature for prediction of amyloid positivity in asymptomatic at-risk subjects, allowing for a less invasive, more accessible, and less expensive risk assessment of AD as compared to PET studies or lumbar puncture. FUND: Institut Hospitalo-Universitaire and Institut du Cerveau et de la Moelle Epiniere (IHU-A-ICM), French Ministry of Research, Fondation Alzheimer, Pfizer, and Avid.

Keywords: Alzheimer; Amyloid PET; Asymptomatic; Biomarkers; Multi-omics; Prediction.


Conflict of interest statement

BD has received consultancy fees from Biogen, Boehringer Ingelheim and Eli Lilly, and grants for his institution from Merck, Pfizer, and Roche. SE has received grants from Eli Lilly and consul tant fees from Astellas Pharma. M-CP has received grants from Fondation Vaincre Alzheimer, Laboratoires Servier, Pfizer, and Roche. M-OH has received consultant fees from Eli Lilly and speaker fees from Piramal. The other authors declare no competing interests.

Figures

Fig. 1
Fig. 1
PCAs of the metabolomics dataset in amyloid (+) and amyloid (−) asymptomatic individuals at-risk for AD. a: Distribution of males and females according to the two principal components (females in hollow triangles, males in filled in triangles); b: Distribution of APOEε4 carriers and APOEε4 non carriers according to the two principal components (APOEε4 negative in hollow squares, APOEε4 positive in filled in squares); c: Distribution of amyloid (+) and amyloid (−) subjects according to the two principal components (hollow circles for amyloid (−) filled in circles for amyloid (+) after correction for APOE genotype and sex.
Fig. 2
Fig. 2
Differential analysis of metabolites between amyloid (+) and amyloid (−) asymptomatic individuals at-risk for AD. a: Venn diagram depicting the overlap of significant metabolites between CAT score and Wilcoxon rank sum test applied on 830 metabolites detected in blood samples. b: Table listing the overlapping features and their variation in amyloid (+) and amyloid (−) subjects.
Fig. 3
Fig. 3
PCAs of the lipidomics dataset in amyloid (+) and amyloid (−) asymptomatic individuals at-risk for AD. a: Distribution of males and females according to the two principal components (females in hollow triangles, males in filled in triangles); b: Distribution of APOEε4 carriers and APOEε4 non carriers according to the two principal components (APOEε4 negative in hollow squares, APOEε4 positive in filled in squares); c: Distribution of amyloid (+) and amyloid (−) subjects according to the two principal components (hollow circles for amyloid (−) filled in circles for amyloid (+) after correction for APOE genotype and sex.
Fig. 4
Fig. 4
PCAs of the transcriptomics dataset in amyloid (+) and amyloid (−) asymptomatic individuals at-risk for AD. a: Distribution of males and females according to the two principal components (females in hollow triangles, males in filled in triangles); b: Distribution of APOEε4 carriers and APOEε4 non carriers according to the two principal components (APOEε4 negative in hollow squares, APOEε4 positive in filled in squares); c: Distribution of amyloid (+) and amyloid (−) subjects according to the two principal components (hollow circles for amyloid (−) filled in circles for amyloid (+) after correction for APOE genotype and sex.
Fig. 5
Fig. 5
Differentially expressed transcripts between amyloid (+) and amyloid (−) asymptomatic individuals at-risk for AD. a: Venn diagram depicting the overlap of significant metabolites between CAT score, Wilcoxon rank sum test and DESeq2 analysis applied to 15,616 transcripts expressed in blood cells. b: Table listing the ten first GO terms obtained through GO Enrichment analysis.
Fig. 6
Fig. 6
Integrative analysis for multi-block data in amyloid (+) and amyloid (−) asymptomatic individuals at-risk for AD using sparse partial least squares-discriminant analysis (sPLS-DA). a: PCA for the metabolomics block (green circles amyloid (−) individuals, red triangles amyloid (+) individuals). Percentages of the variance for the two axis are indicated in parenthesis; b: List of metabolites for the three first components with their corresponding loading plots indicating the most relevant metabolites. Each graph represents one of the components and the weight of metabolites; c: PCA for the lipidomics block (green circles amyloid (−) individuals, red triangles amyloid (+) individuals. Percentages of the variance for the two axis are indicated in parenthesis); d: List of lipids for the three first components with their corresponding loading plots indicating the most relevant lipids. Each graph represents one of the components and the weight of lipids; e: PCA for the transcriptomics block (green circles amyloid (−) individuals, red triangles amyloid (+) individuals). Percentages of the variance for the two axis are indicated in parenthesis; f: List of transcripts for the three first components with their corresponding loading plots indicating the most relevant transcripts. Each graph represents one of the components and the weight of transcripts. (For interpretation of the references to colour in this figure legend, the reader is referred to the web version of this article.)
Fig. 7
Fig. 7
Multi-omics signature of amyloid positivity in asymptomatic individuals at-risk for AD by grouping block-wise sparse components in a super-block. a: Graphic representation of the common space associated with the two superscores corresponding to the two first principal components combining the top omics features (green circles amyloid (−) individuals, red triangles amyloid (+) individuals); b: Variable factor map generated by the two superscores (metabolic variables in blue, genes in green and lipids in dark red). (For interpretation of the references to colour in this figure legend, the reader is referred to the web version of this article.)
Fig. 8
Fig. 8
Discriminant power of the block-wise components and the superscores for detecting brain amyloid deposition in asymptomatic individuals at-risk for AD. ROC curves plots for (a) the first component of each block, (b) the combination of the first two components. The black bold dashed line represents the AUC for the superscore, blue is for the metabolomics block, green for the transcriptomics, and red for lipidomics. (For interpretation of the references to colour in this figure legend, the reader is referred to the web version of this article.)
Fig. 9
Fig. 9
Validation of X3 (undecanoic acid) as a marker of amyloid positivity in asymptomatic individuals at-risk for AD. Box plot analysis of the values obtained for X3 metabolite identified as undecanoic acid in a follow-up longitudinal study of 22 subjects. Wilcoxon p = 0·03.

References

    1. Golde T.E., DeKosky S.T., Galasko D. Alzheimer's disease: the right drug, the right time. Science. 2018;362(6420):1250–1251. - PubMed
    1. Jack C.R., Jr., Wiste H.J., Therneau T.M. Associations of amyloid, tau, and neurodegeneration biomarker profiles with rates of memory decline among individuals without dementia. JAMA. 2019;321(23):2316–2325. - PMC - PubMed
    1. Knopman D.S., Petersen R.C., Jack C.R., Jr. A brief history of "Alzheimer disease": multiple meanings separated by a common name. Neurology. 2019;92(22):1053–1059. - PMC - PubMed
    1. Kanehisa M., Goto S. KEGG: kyoto encyclopedia of genes and genomes. Nucleic Acids Res. 2000;28(1):27–30. - PMC - PubMed
    1. Kanehisa M., Sato Y., Furumichi M., Morishima K., Tanabe M. New approach for understanding genome variations in KEGG. Nucleic Acids Res. 2019;47(D1):D590–d5. - PMC - PubMed

Substances