. 2019 Sep:47:384-401.
doi: 10.1016/j.ebiom.2019.08.042. Epub 2019 Sep 3.

Obese mice exposed to psychosocial stress display cardiac and hippocampal dysfunction associated with local brain-derived neurotrophic factor depletion

Affiliations

Obese mice exposed to psychosocial stress display cardiac and hippocampal dysfunction associated with local brain-derived neurotrophic factor depletion

Jacopo Agrimi et al. EBioMedicine. 2019 Sep.

Abstract

Introduction: Obesity and psychosocial stress (PS) co-exist in individuals of Western society. Nevertheless, how PS impacts cardiac and hippocampal phenotype in obese subjects is still unknown. Nor is it clear whether changes in local brain-derived neurotrophic factor (BDNF) account, at least in part, for myocardial and behavioral abnormalities in obese experiencing PS.

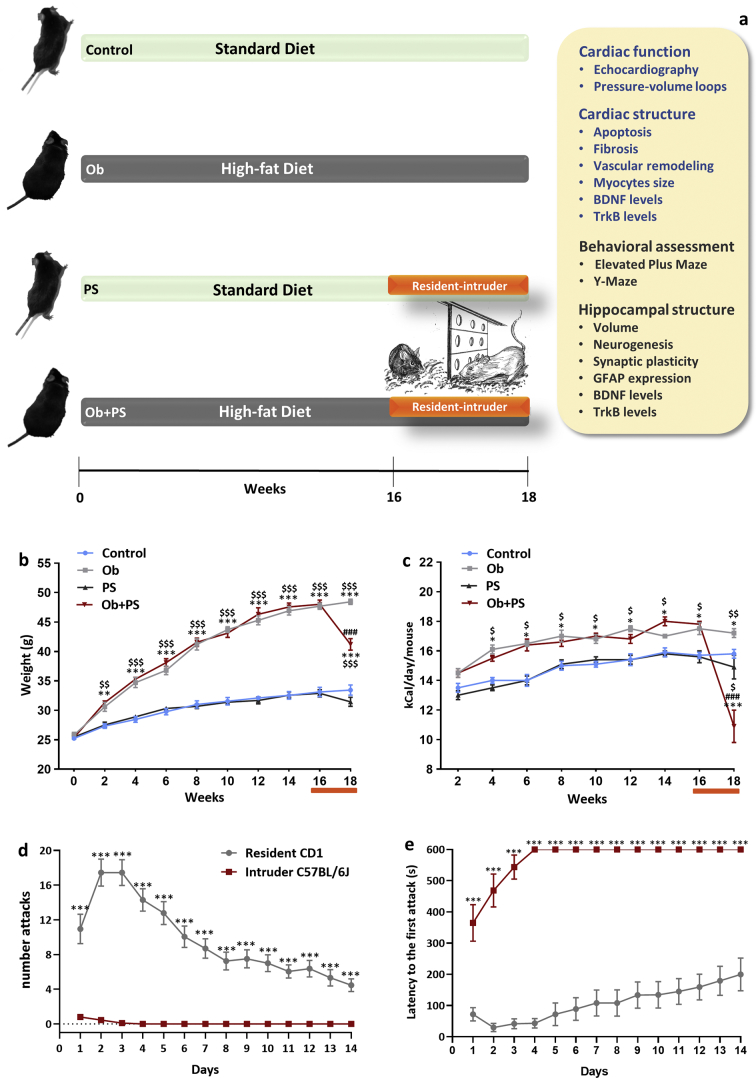
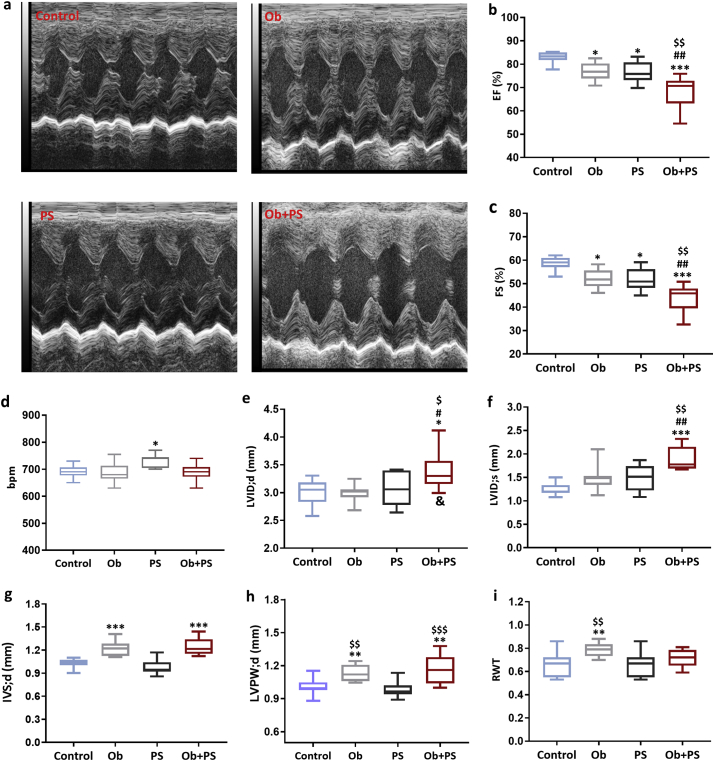
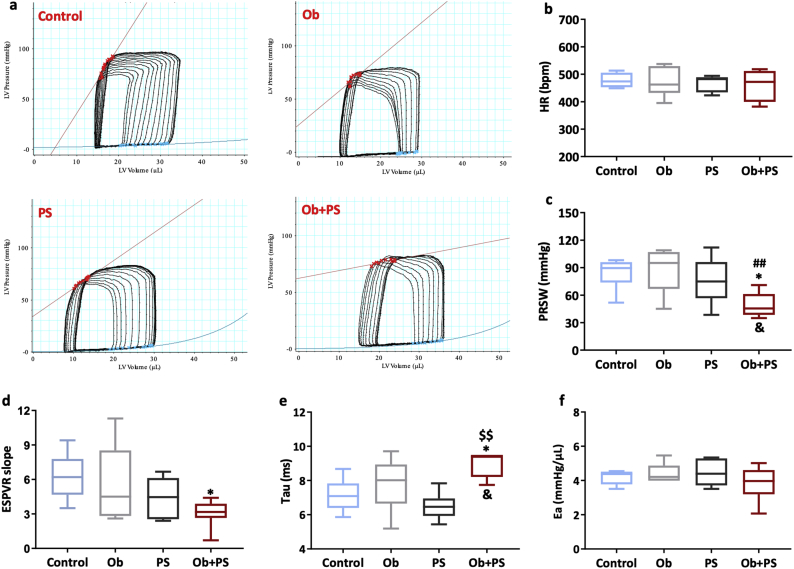
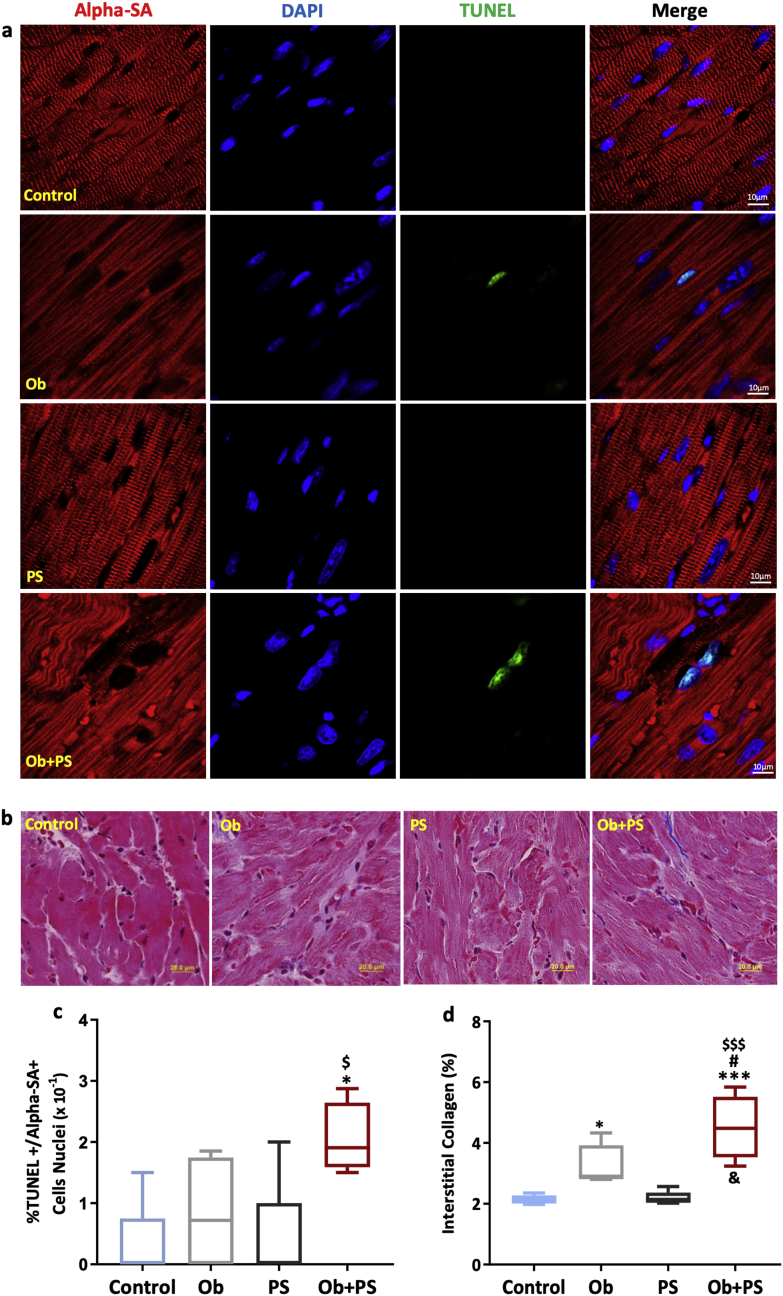
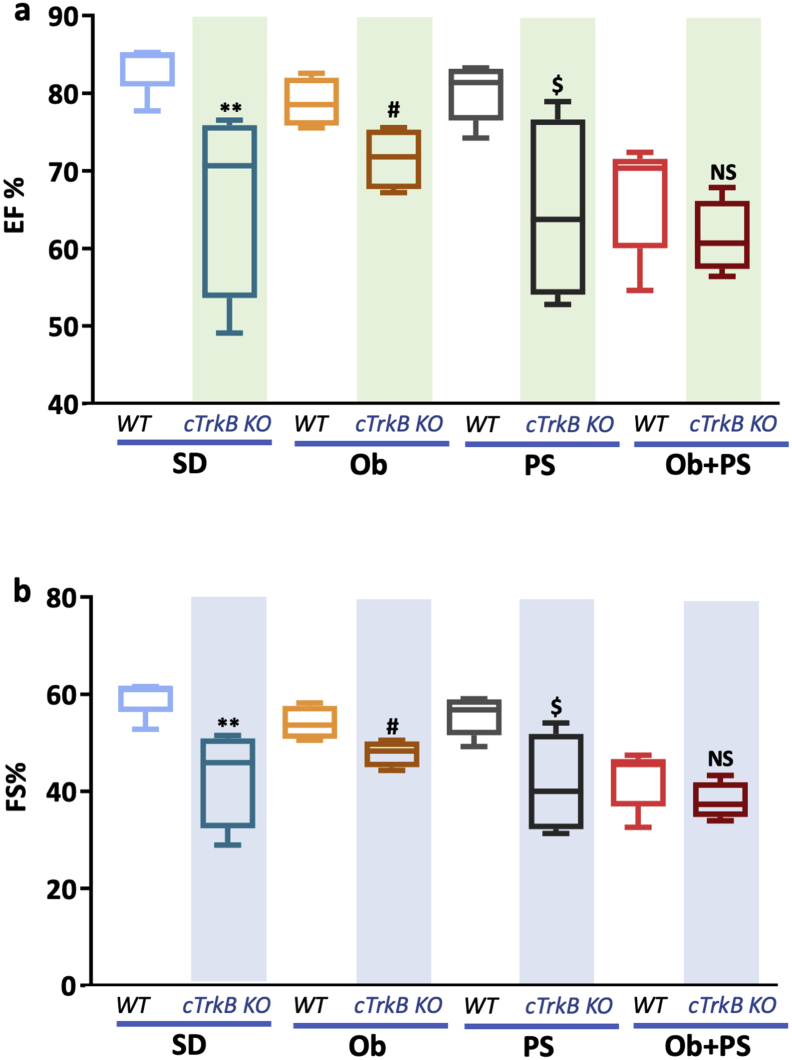
Methods: In adult male WT mice, obesity was induced via a high-fat diet (HFD). The resident-intruder paradigm was superimposed to trigger PS. In vivo left ventricular (LV) performance was evaluated by echocardiography and pressure-volume loops. Behaviour was indagated by elevated plus maze (EPM) and Y-maze. LV myocardium was assayed for apoptosis, fibrosis, vessel density and oxidative stress. Hippocampus was analyzed for volume, neurogenesis, GABAergic markers and astrogliosis. Cardiac and hippocampal BDNF and TrkB levels were measured by ELISA and WB. We investigated the pathogenetic role played by BDNF signaling in additional cardiac-selective TrkB (cTrkB) KO mice.

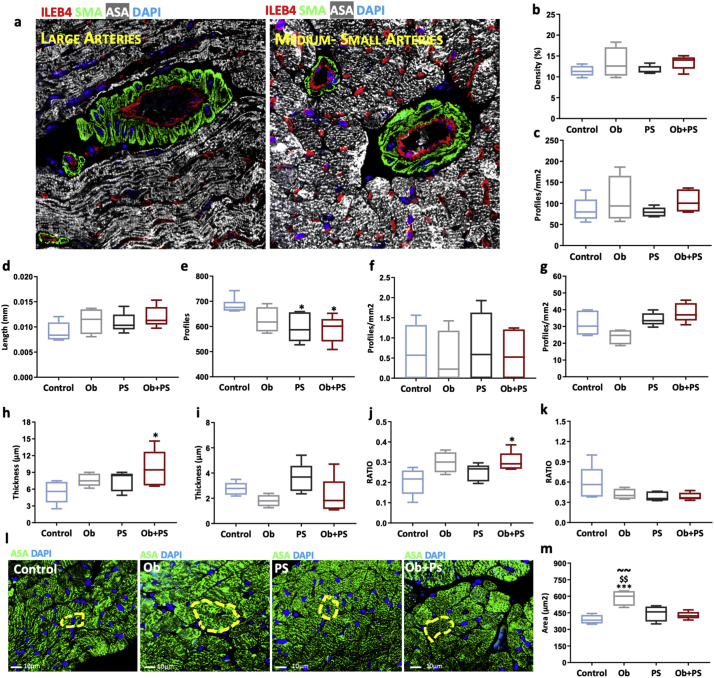
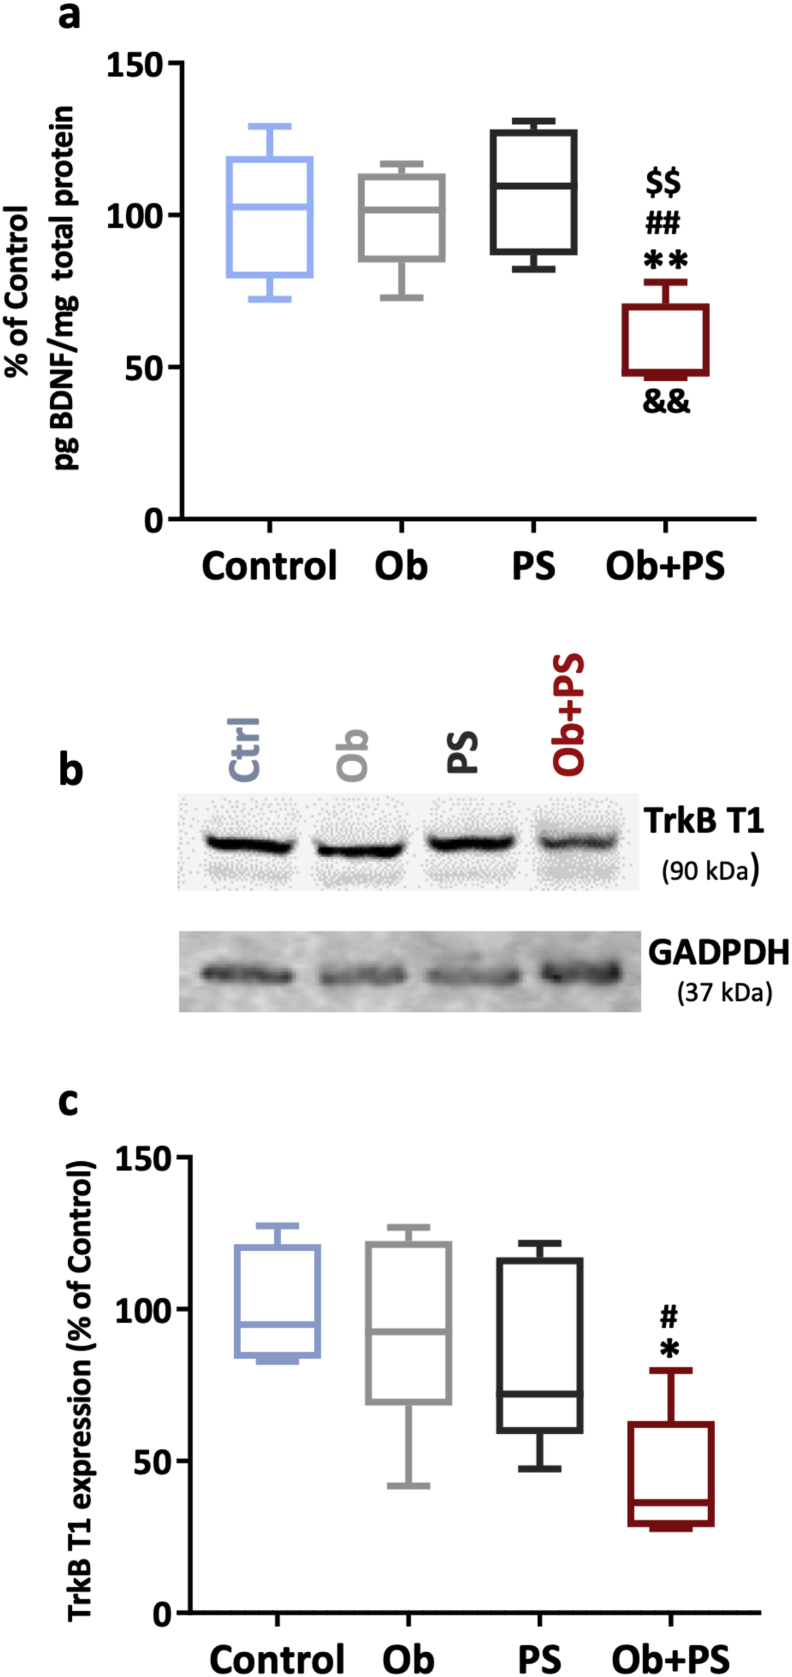
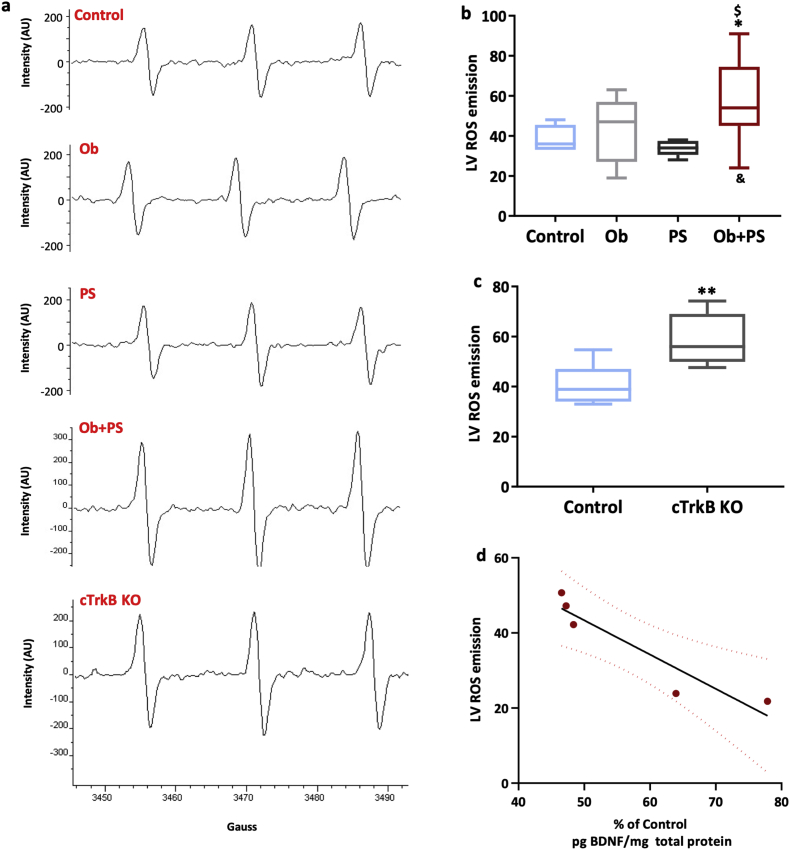
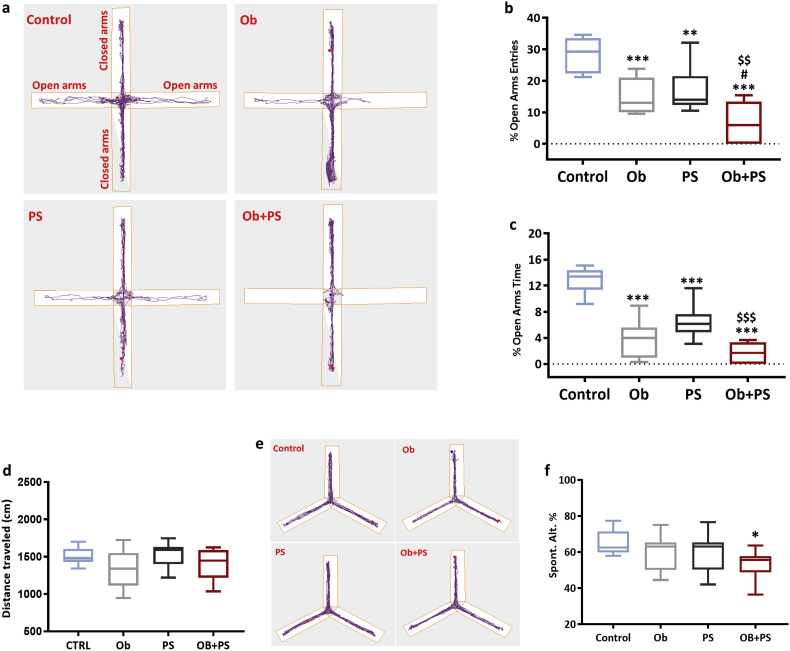
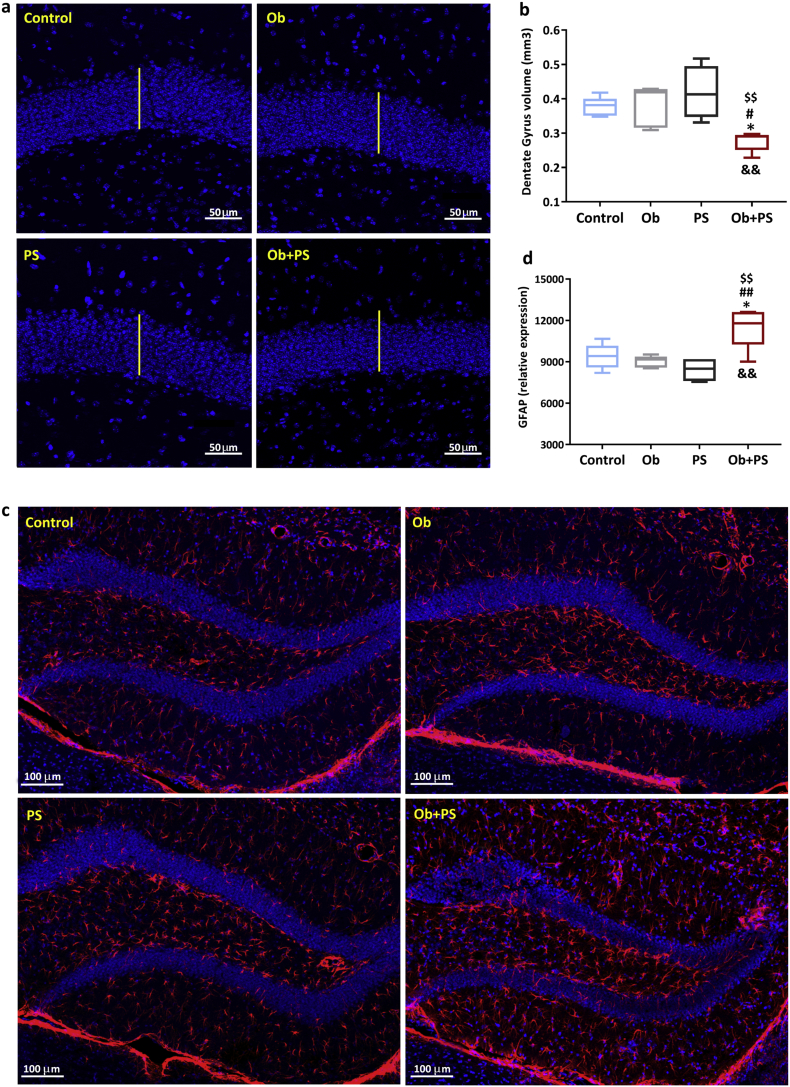
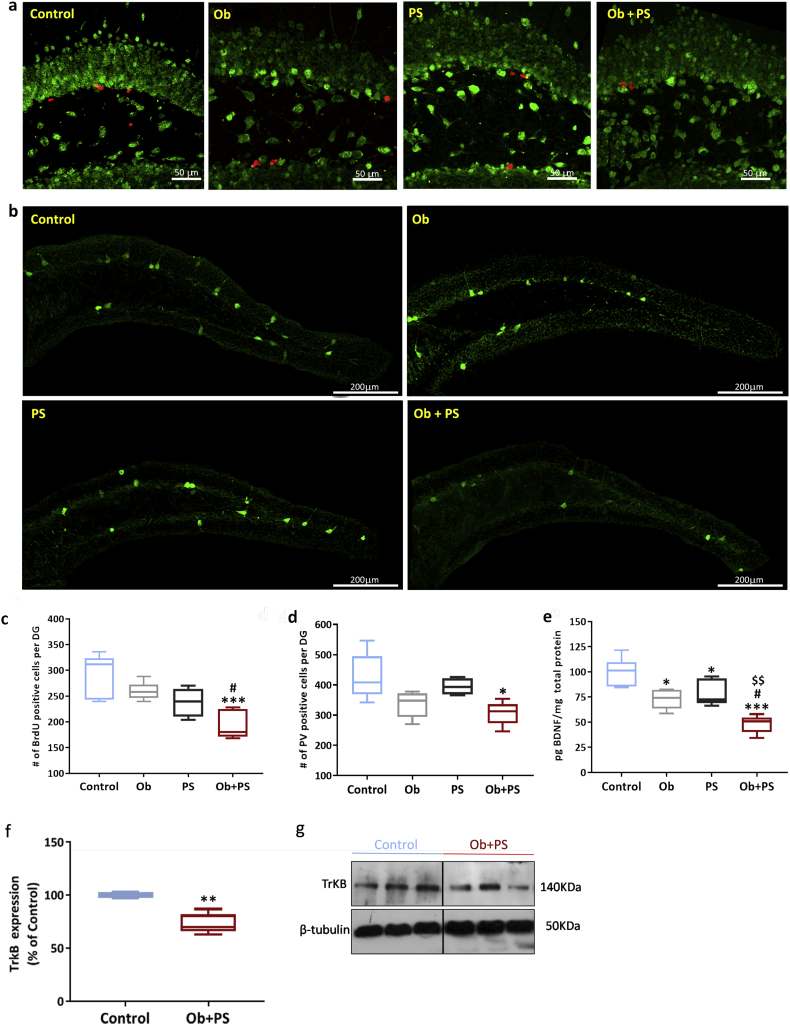
Findings: When combined, obesity and PS jeopardized LV performance, causing prominent apoptosis, fibrosis, oxidative stress and remodeling of the larger coronary branches, along with lower BDNF and TrkB levels. HFD/PS weakened LV function similarly in WT and cTrkB KO mice. The latter exhibited elevated LV ROS emission already at baseline. Obesity/PS augmented anxiety-like behaviour and impaired spatial memory. These changes were coupled to reduced hippocampal volume, neurogenesis, local BDNF and TrkB content and augmented astrogliosis.

Interpretation: PS and obesity synergistically deteriorate myocardial structure and function by depleting cardiac BDNF/TrkB content, leading to augmented oxidative stress. This comorbidity triggers behavioral deficits and induces hippocampal remodeling, potentially via lower BDNF and TrkB levels. FUND: J.A. was in part supported by Rotary Foundation Global Study Scholarship. G.K. was supported by T32 National Institute of Health (NIH) training grant under award number 1T32AG058527. S.C. was funded by American Heart Association Career Development Award (19CDA34760185). G.A.R.C. was funded by NIH (K01HL133368-01). APB was funded by a Grant from the Friuli Venezia Giulia Region entitled: "Heart failure as the Alzheimer disease of the heart; therapeutic and diagnostic opportunities". M.C. was supported by PRONAT project (CNR). N.P. was funded by NIH (R01 HL136918) and by the Magic-That-Matters fund (JHU). V.L. was in part supported by institutional funds from Scuola Superiore Sant'Anna (Pisa, Italy), by the TIM-Telecom Italia (WHITE Lab, Pisa, Italy), by a research grant from Pastificio Attilio Mastromauro Granoro s.r.l. (Corato, Italy) and in part by ETHERNA project (Prog. n. 161/16, Fondazione Pisa, Italy). Funding source had no such involvement in study design, in the collection, analysis, interpretation of data, in the writing of the report; and in the decision to submit the paper for publication.

Keywords: Brain-derived neurotrophic factor (BDNF); Brain-heart axis; Hippocampus; Left ventricle; Obesity; Oxidative stress; Psychosocial stress; Tropomyosin receptor kinase B (TrkB).


Conflict of interest statement

The authors have declared that no competing interests exist.

Figures

Fig. 1
Fig. 1
PS in obese mice induces hypophagia and body weight loss. (a) Simplified cartoon of experimental design. The experimental groups are represented from top to bottom as follow: Control (n = 10), mice fed with a standard diet (SD) for 18 weeks; Ob (n = 10) mice fed with a high fat diet (HFD) for 18 weeks; PS (n = 10) mice fed with a standard diet for 18 weeks and subjected to the resident-intruder paradigm from week 16th to week 18th of the protocol; Ob + PS (n = 10) mice fed a high fat diet for 18 weeks and subjected to the resident-intruder paradigm from week 16th to week 18th. At the end of the protocol the analysis indicated on the right panel was performed. (b) Time-dependent effects of standard diet (control, n = 10; PS, n = 10) or high fat diet (Ob, n = 10; Ob + Ps, n = 10) on murine body weight and (c) caloric (kcal) intake. (d) Number attacks and (e) latency to the first attack of mice exposed to the resident-intruder paradigm. One-way ANOVA was performed for each temporal point of the curves represented in the panels b and c (*p < 0·05, **p < 0·01, and ***p < 0·001 Vs Controls; #p < 0·05, ### p < 0·001 Vs Ob; $p < 0·05, $$$p < 0·001 Vs PS). Two-tailed Student's t-test was performed for each temporal point of the curves represented in d and e (***p < 0·001). All measurements are shown as mean ± SEM.
Fig. 2
Fig. 2
Subjecting obese mice to PS jeopardizes cardiac function. (a) Representative left ventricular (LV) M-Mode echocardiograms of each experimental group. Global LV function (b-d) and structure (e-i) of conscious mice. EF, ejection fraction; FS, fractional shortening; HR, heart rate; LVID;d, LV end-diastolic internal diameter; LVID;s, LV end-systolic internal diameter; IVS;d, end-diastolic interventricular septum thickness; LVPW;d, end-diastolic LV posterior wall thickness; RWT, relative wall thickness. All values are represented trough box-and-whisker plots (n = 10, two-way ANOVA, *p < 0·05, **p < 0·01, and ***p < 0·001 Vs Controls; #p < 0·05, ## p < 0·01,### p < 0·001 Vs Ob; $p < 0·05,$$p < 0·01, $$$p < 0·001 Vs PS; &p < 0·05 interaction between Ob and PS).
Fig. 3
Fig. 3
Superimposing PS to obesity primarily affects myocardial performance. (a) Representative left ventricular Pressure-Volume loops of each experimental group. (b)HR, heart rate; (c) PRSW, preload recruitable stroke work; (d) ESPVR, end-systolic pressure-volume relationship; (e) Tau, LV relaxation time constant; (f) Ea, arterial elastance. All values are represented trough box-and-whisker plots (n = 6–8, two-way ANOVA, *p < 0·05, Vs Controls; #p < 0·05, ## p < 0·01 Vs Ob; $p < 0·05, $$p < 0·01Vs PS; &p < 0·05 interaction between Ob and PS).
Fig. 4
Fig. 4
PS in obese mice increases myocardial apoptosis and interstitial collagen deposition. (a) Representative images of the detection of left ventricular apoptotic cardiomyocytes in each experimental group (a white arrow indicates an example of an apoptotic interstitial cell, a yellow arrow an example of an apoptotic cardiomyocyte). DAPI, 4′,6-diamidino-2-phenylindole; TUNEL,terminal deoxynucleotidyl transferase dUTP nick end labeling. (b) Representative images of histological Masson's trichrome-stained sections to detect left ventricle interstitial collagen in each experimental group. (c) LV fraction of alpha-sarcomeric actin positive cells that are TUNEL positive (%). (d) LV % Interstitial collagen amount(n = 4–5 per group). All values are represented trough box-and-whisker plots (n = 4–5 per group, two-way ANOVA, **p < 0·01 Vs Controls; ## p < 0·01 Vs Ob; $$p < 0·01, $$$p < 0·001 Vs PS; &p < 0·05 interaction between Ob and PS). (For interpretation of the references to colour in this figure legend, the reader is referred to the web version of this article.)
Fig. 5
Fig. 5
PS in obese mice induces arteriolar remodeling without affecting vascular density. (a) Representative images of large and medium-small coronary arteries. DAPI, 4′,6-diamidino-2-phenylindole; ILEB4, isolectin B4; SMA, alpha-smooth muscle actin. (b) Vascular density. (c) Branching index. (d) Average vessel length. (e) Total number of endpoints. (f) Total number of large coronary arteries. (g) Total number of medium-small arteries. (h) Wall thickness of large arteries. (i) Wall thickness of medium-small arteries. (j) Wall-to-lumen ratio of large arteries. (k) Wall-to-lumen ration of medium-small arteries. (l) Representative images of the cross-sectional area of left ventricular cardiomyocytes in each experimental group. Control, mice fed with standard diet; Ob, high-fat diet-induced obese mice; PS, mice fed with standard diet and exposed to psychosocial stress; Ob + PS, high-fat diet-induced obese mice exposed to psychosocial stress. ASA, alpha-sarcomeric actin. (m) Cardiomyocyte cross-sectional area. All values are represented trough box-and-whisker plots (n = 4–5per group, two-way ANOVA, *p < 0·05 Vs Controls, ***p < 0·001 Vs Controls; ## p < 0·01 Vs Ob; $p < 0·05, $$p < 0·01 Vs PS; ~~p < 0·01 Vs Ob + PS).
Fig. 6
Fig. 6
HFD/PS combination depletes myocardial BDNF levels while decreasing left ventricular (LV) TrkB.T1 expression. (a) LV brain-derived neurotrophic factor (BDNF) levels of each experimental group. (b) representative densitometric bands of LV TrkB.T1 expression in each experimental group. (c) LV TrkB.T1 levels of each experimentl group. All values are represented trough box-and-whisker plots (n = 6–8per group, two-way ANOVA,*p < 0·05, **p < 0·01 Vs Controls; ## p < 0·01 Vs Ob; $p < 0·05, $$p < 0·01 Vs PS; &&p < 0·01 interaction between Ob and PS).
Fig. 7
Fig. 7
The reduction of left ventricular (LV)ejection fraction (EF,%) and fractional shortening (FS,%) is similar in wild type (WT) and cTrkB knockout (KO) obese mice experiencing psychosocial stress. (a) Changes of LVEF in each experimental group of WT and KO mice. (b) Changes of LV FS in each experimental group of WT and KO mice.All values are represented trough box-and-whisker plots (n = 4–8, **p < .01 Vs corresponding WT standard diet (SD) mice; # p < .05 Vs corresponding WT obese (Ob) mice; $p < 0·05 Vs corresponding WT mice experiencing psychosocial stress (PS); NS, not signifcant).
Fig. 8
Fig. 8
HFD/PS combination enhances cardiac oxidative stress. (a) Representative images of electron paramagnetic resonance spectra at room temperature of left ventricular (LV) myocardium of each experimental group. (b) Measure of LV reactive oxygen species (ROS) emission (n = 6–10 per group). (c) LV ROS emission in Control wild type and cTrkB knockout (KO) murine left ventricle (n = 4–5per group). (d) Relationship between LV ROS emission and myocardial BDNF content. All values are represented trough box-and-whisker plots (n = 4–8, two-way ANOVA, *p < 0·05, **p < 0·01 Vs Controls; ## p < 0·01 Vs Ob; $p < 0·05, $$p < 0·01 Vs PS; &&p < 0·01 interaction between Ob and PS).
Fig. 9
Fig. 9
PS in obese mice triggers severe anxiety while impairing spatial memory. (a) Representative examples of mice exploratory activity in the elevated plus maze apparatus. (b) % of entries of mice into open arms (n = 10 per group). (c) % of time spent in open arms (n = 10 per group). (d) The average distance traveled in elevated plus maze apparatus (n = 10 per group). (e) Representative images show typical examples of mice trajectories in the Y-maze apparatus. (f) % of spontaneous alternation in the Y-maze. All values are represented trough box-and-whisker plots (n = 10, two-way ANOVA, *p < 0·05, **p < 0·01, and ***p < 0·001 Vs Controls; #p < 0·05 Vs Ob; $$p < 0·01, $$$p < 0·001 Vs PS).
Fig. 10
Fig. 10
PS in obese mice decreases DG volume, while inducing astrogliosis. (a) Representative images of measurement of dentate gyrus (DG) volume in each experimental group. The white bar denotes normal thickness of the DG in controls. (b) Average measure of DG volume. (c) Representative images of detection of glial fibrillary acidic protein (GFAP)-positive cells in the DG for each experimental group. (d) Relative expression of GFAP. All values are represented trough box-and-whisker plots (n = 5, two-way ANOVA, *p < 0·05 Vs Controls; ## p < 0·05 Vs Ob; $$p < 0·01 Vs PS; &&p < 0·01 interaction between Ob and PS).
Fig. 11
Fig. 11
HFD/PS mice display impaired hippocampal neurogenesis, reduced number of parvalbumin− + interneurons,and halved BDNF levels. (a) Representative images of BrdU-positive cells (red) in the DG per each group. Green, NeuN counterstaining. (b) Representative images of detection of parvalbumin (PV)-positive cells resident in the DG per each experimental group. (c) Number (#) of BrdU-positive cells per DG. (d) Number (#) of PV-positive cells per DG. (e) Hippocampal brain-derived neurotrophic factor (BDNF) protein levels. (f) Hippocampal TrkB protein levels. (g) Representative images of cropped densitometric bands of hippocampal TrkB expression in Control and Ob + PS mice. The full-length blots/gels are presented in Supplementary Fig. 5. All values are represented trough box-and-whisker plots (n = 5, two-way ANOVA, *p < .05, **p < .01, ***p < .001 Vs Controls; #p < .05 Vs Ob; $$p < 0·01, Vs PS). (For interpretation of the references to colour in this figure legend, the reader is referred to the web version of this article.)

Similar articles

Cited by

References

    1. Lifshitz F., Lifshitz J.Z. Globesity: the root causes of the obesity epidemic in the USA and now worldwide. Pediatr Endocrinol Rev. 2014;12(1):17–34. - PubMed
    1. McEwen B.S., Tucker P. Critical biological pathways for chronic psychosocial stress and research opportunities to advance the consideration of stress in chemical risk assessment. Am J Public Health. 2011;101(Suppl. 1):S131–S139. - PMC - PubMed
    1. Kogler L., Muller V.I., Chang A., Eickhoff S.B., Fox P.T., Gur R.C. Psychosocial versus physiological stress - meta-analyses on deactivations and activations of the neural correlates of stress reactions. Neuroimage. 2015;119:235–251. - PMC - PubMed
    1. Egan M., Tannahill C., Petticrew M., Thomas S. Psychosocial risk factors in home and community settings and their associations with population health and health inequalities: a systematic meta-review. BMC Public Health. 2008;8:239. - PMC - PubMed
    1. Siervo M., Wells J.C., Cizza G. The contribution of psychosocial stress to the obesity epidemic: an evolutionary approach. Horm Metab Res. 2009;41(4):261–270. - PMC - PubMed

MeSH terms