. 2019 Oct 17;134(16):1323-1336.
doi: 10.1182/blood.2019000015.

Suz12 inactivation cooperates with JAK3 mutant signaling in the development of T-cell acute lymphoblastic leukemia

Affiliations

Suz12 inactivation cooperates with JAK3 mutant signaling in the development of T-cell acute lymphoblastic leukemia

Michael Broux et al. Blood. .

Abstract

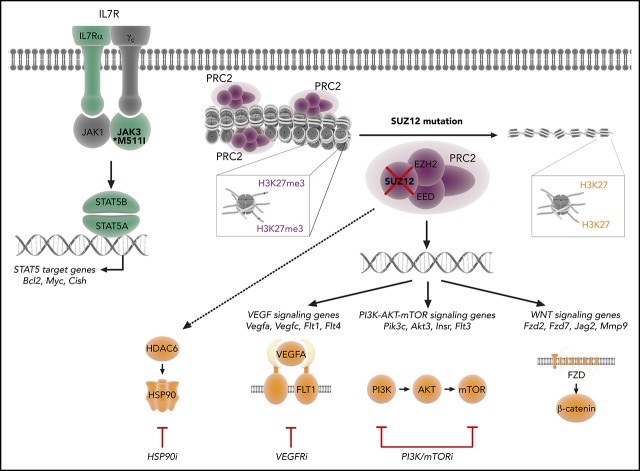
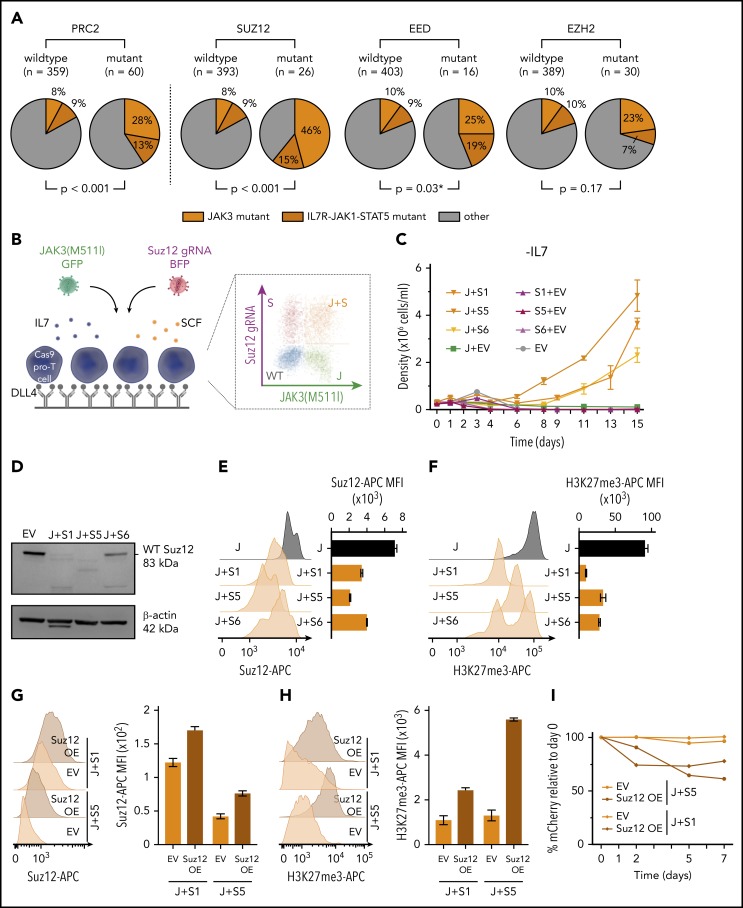
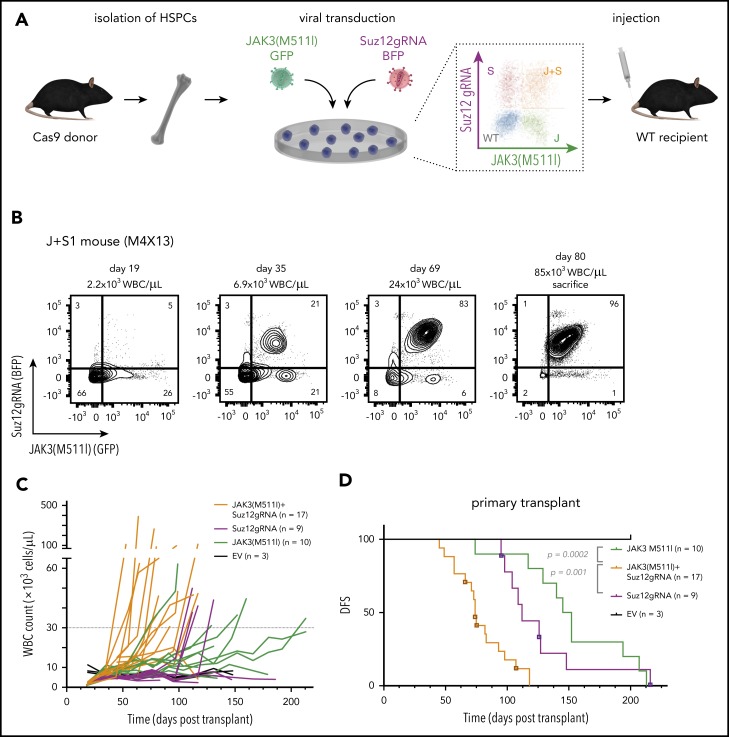
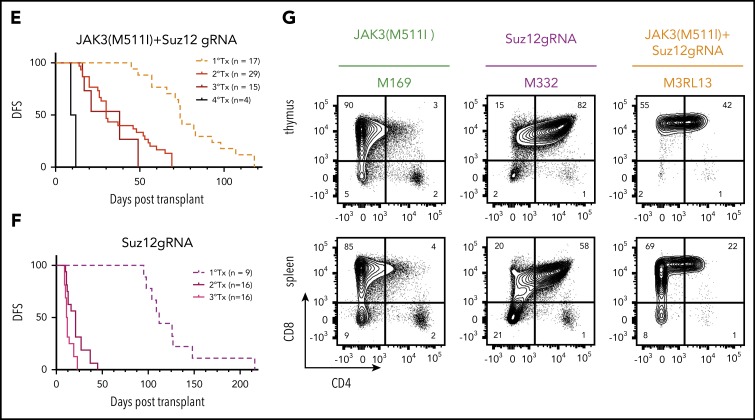
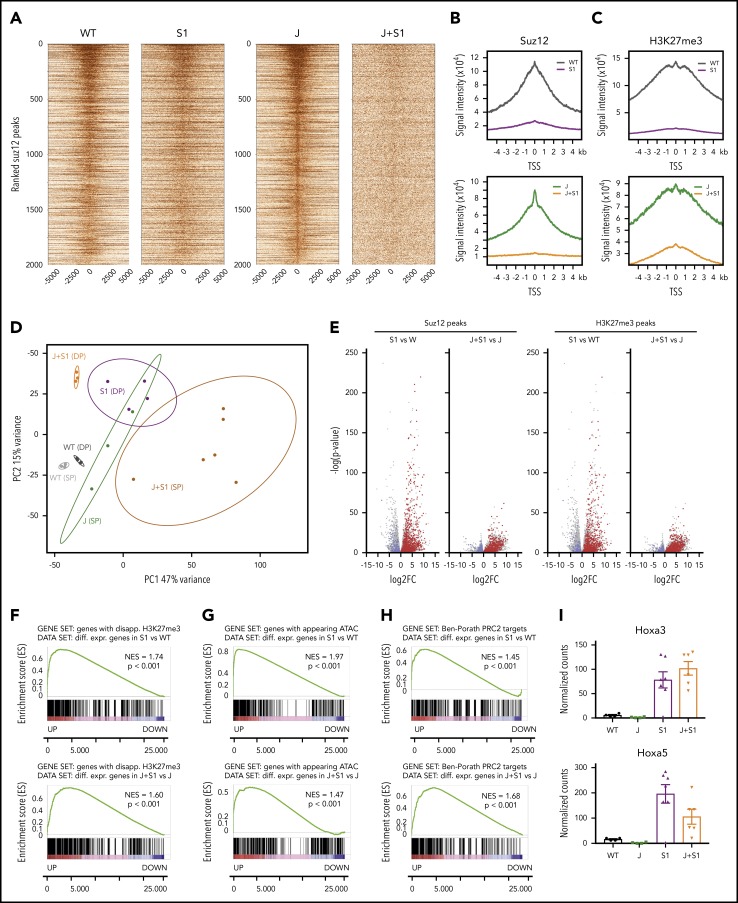
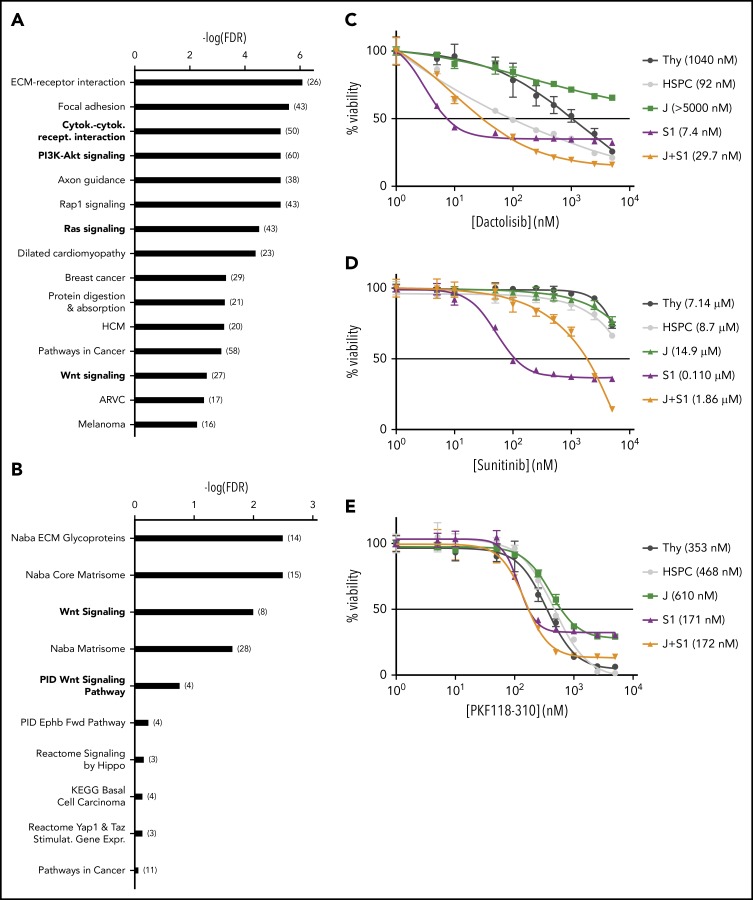
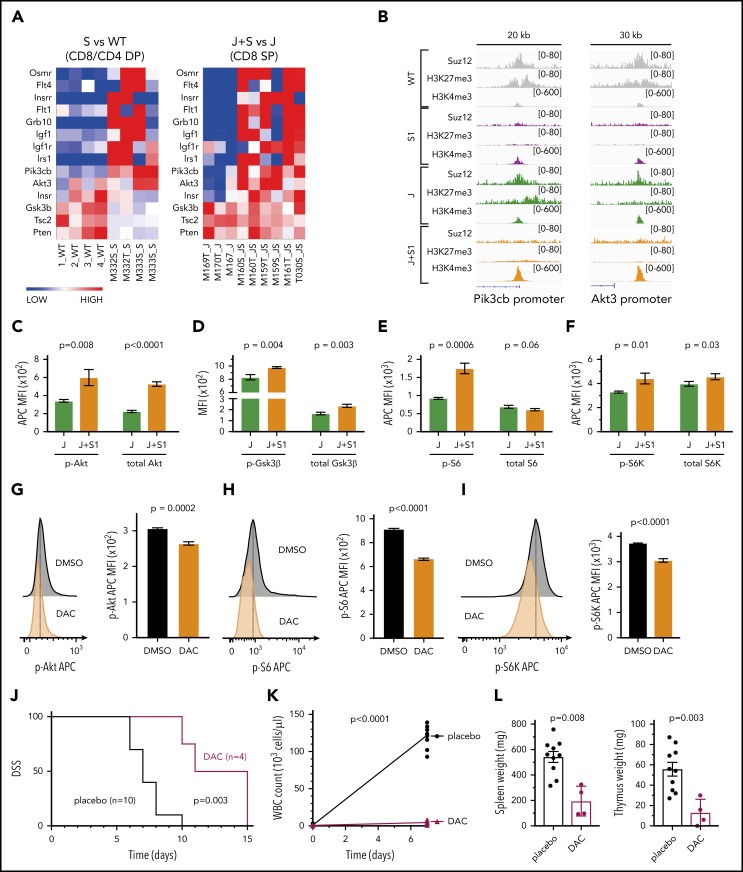
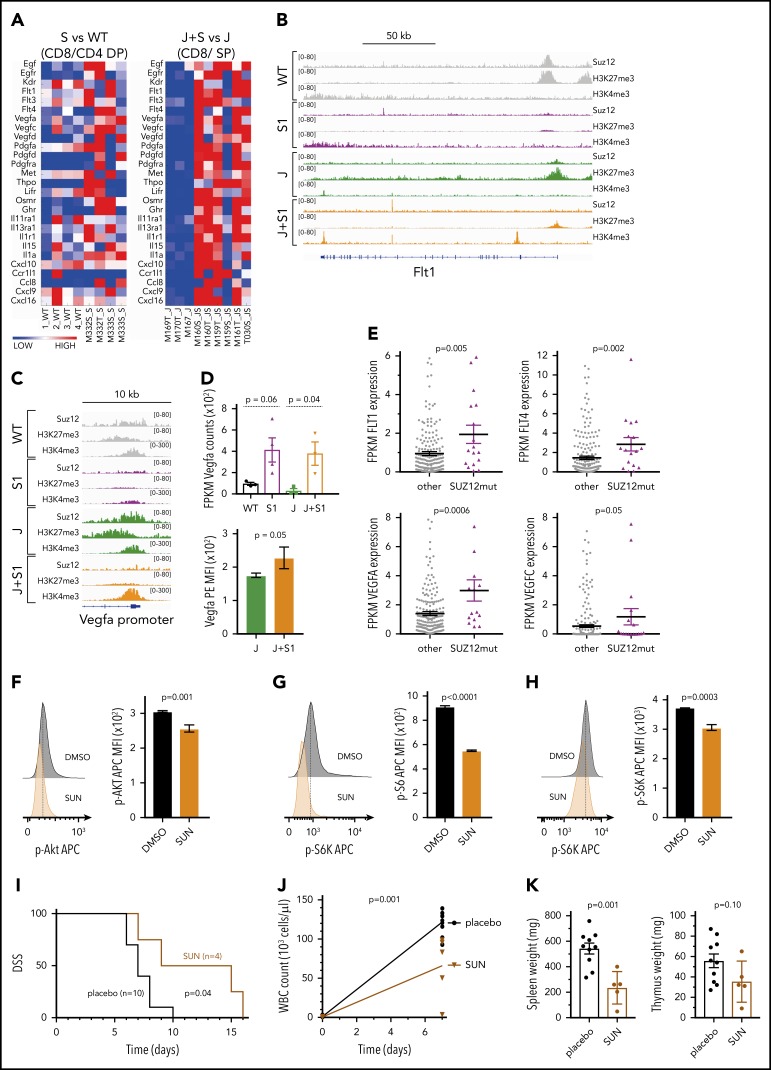
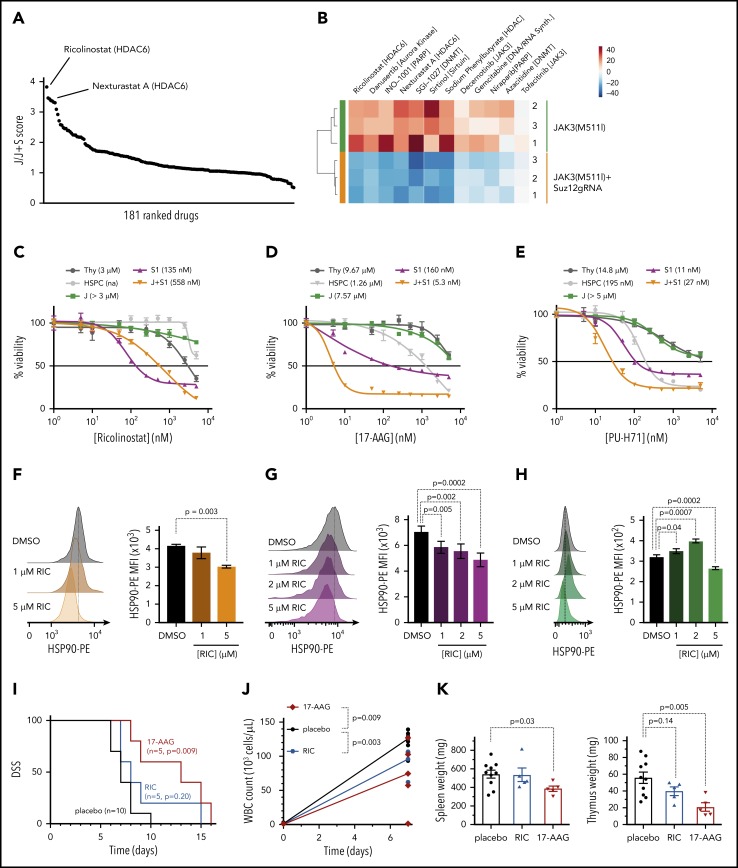
The polycomb repressive complex 2, with core components EZH2, SUZ12, and EED, is responsible for writing histone 3 lysine 27 trimethylation histone marks associated with gene repression. Analysis of sequence data from 419 T-cell acute lymphoblastic leukemia (T-ALL) cases demonstrated a significant association between SUZ12 and JAK3 mutations. Here we show that CRISPR/Cas9-mediated inactivation of Suz12 cooperates with mutant JAK3 to drive T-cell transformation and T-ALL development. Gene expression profiling integrated with ChIP-seq and ATAC-seq data established that inactivation of Suz12 led to increased PI3K/mammalian target of rapamycin (mTOR), vascular endothelial growth factor (VEGF), and WNT signaling. Moreover, a drug screen revealed that JAK3/Suz12 mutant leukemia cells were more sensitive to histone deacetylase (HDAC)6 inhibition than JAK3 mutant leukemia cells. Among the broad genome and gene expression changes observed on Suz12 inactivation, our integrated analysis identified the PI3K/mTOR, VEGF/VEGF receptor, and HDAC6/HSP90 pathways as specific vulnerabilities in T-ALL cells with combined JAK3 and SUZ12 mutations.


Conflict of interest statement

Conflict-of-interest disclosure: The authors declare no competing financial interests.

Figures

None
Graphical abstract
Figure 1.
Figure 1.
PRC2 mutations co-occur with JAK3 mutations and Suz12 loss cooperates with JAK3(M511I) in vitro. (A) Pie charts comparing the frequency of JAK3 mutations (orange) and IL7R-JAK1-STAT5 mutations (brown) within patients with PRC2 mutant T-ALL vs patients with PRC2 wild-type. Similar pie charts for JAK/STAT mutation frequencies for patients with T-ALL carrying mutations in the 3 different PRC2 components SUZ12, EED, and EZH are shown aside. Using Pearson’s χ-squared test (*) or the Fisher’s exact test, P values were calculated for testing significance of positive association between JAK3 mutations and mutations in PRC2, SUZ12, EZH2, or EED. T-ALL patient data (n = 419). (B) Scheme of ex vivo pro-T-cell culture requiring interleukin 7 (IL7), stem cell factor (SCF), and immobilized Δ-like ligand 4 (DLL4). (C) Cell densities (mean with standard deviation) over time for different IL7-deprived pro-T-cell conditions: JAK3(M511I)+Suz12gRNA TS1, TS5, and TS6 (J+S1, J+S5, J+S6); Suz12 gRNA TS1, TS5, and TS6, always in combination with green fluorescent protein (GFP) empty vector (S1+EV, S5+EV, S6+EV) controls; JAK3(M511I) in combination with blue fluorescent protein (BFP) empty vector (J+EV); and BFP empty+GFP empty vector (EV) controls. (D) Western blot on EV pro-T cells and IL7-independent JAK3(M511I)+Suz12gRNA pro-T cells (J+S1, J+S5, J+S6). β-actin was used as loading control. (E-F) Suz12 protein (E) and H3K27me3 (F) levels were measured by intracellular flow cytometry in IL7-independent JAK3(M511I)+Suz12gRNA pro-T-cells (J+S1, J+S5, J+S6) and JAK3(M511I) (J) pro-T-cells. MFIs were calculated for APC emission. (G-H) Suz12 protein (G) and H3K27me3 (H) levels were measured by intracellular flow cytometry. MFIs were calculated for APC emission. (I) Percentage mCherry relative to d0 was measured over time in IL7-independent J+S1 and J+S5 pro-T-cells that were transduced with mCherry EV or mCherry Suz12 cDNA overexpression (Suz12 OE).
Figure 2.
Figure 2.
Suz12 loss cooperates with JAK3(M511I) in driving an aggressive T-ALL in vivo. (A) Scheme of bone marrow transplantation set-up. HSPCs were isolated from the bone marrow of Cas9 donor mice, followed by retroviral transduction with constructs overexpressing JAK3(M511I) and/or Suz12gRNA before injection into recipient mice. (B) Clonal evolution of different populations (WT, S, J, J+S) in the blood of a representative JAK3(M511I)+Suz12gRNA mouse (M1R15) over time, showing competitive advantage of J+S cells over other populations. Cell populations: nontransduced (wild-type; WT), Suz12gRNA (S; BFP only), JAK3(M511I) (J; GFP only), and JAK3(M511I)+Suz12gRNA (J+S, BFP+GFP double positive). (C) WBC counts of recipient mice over time for 4 different cohorts: JAK3(M511I)+Suz12gRNA, JAK3(M511I), Suz12gRNA, and control (GFP and BFP empty vectors, EV) mice. A WBC count of 30 000 was used as cutoff for DFS. (D) Survival curve showing DFS of mice in the same 3 cohorts as in C. Mice in which Suz12gRNA-TS5 instead of TS1 was used were designated with a box and darker color. P values were calculated with Gehan-Breslow-Wilcoxon test. (E-F) Survival curves of JAK3(M511I)+Suz12gRNA (E) and Suz12gRNA (F) leukemias that were serially transplanted. (G) Representative flow cytometry stainings for CD8 (APC-Cy7, y-axis) and CD4 (PerCP-Cy5.5, x-axis) of thymus and spleen of leukemia cells (pregated on GFP and/or BFP) from 3 different cohorts at time of sacrifice. For all figures except Fig. 2D, Suz12gRNA TS1 was used in Suz12gRNA and JAK3(M511I)+Suz12gRNA mice.
Figure 2.
Figure 2.
Suz12 loss cooperates with JAK3(M511I) in driving an aggressive T-ALL in vivo. (A) Scheme of bone marrow transplantation set-up. HSPCs were isolated from the bone marrow of Cas9 donor mice, followed by retroviral transduction with constructs overexpressing JAK3(M511I) and/or Suz12gRNA before injection into recipient mice. (B) Clonal evolution of different populations (WT, S, J, J+S) in the blood of a representative JAK3(M511I)+Suz12gRNA mouse (M1R15) over time, showing competitive advantage of J+S cells over other populations. Cell populations: nontransduced (wild-type; WT), Suz12gRNA (S; BFP only), JAK3(M511I) (J; GFP only), and JAK3(M511I)+Suz12gRNA (J+S, BFP+GFP double positive). (C) WBC counts of recipient mice over time for 4 different cohorts: JAK3(M511I)+Suz12gRNA, JAK3(M511I), Suz12gRNA, and control (GFP and BFP empty vectors, EV) mice. A WBC count of 30 000 was used as cutoff for DFS. (D) Survival curve showing DFS of mice in the same 3 cohorts as in C. Mice in which Suz12gRNA-TS5 instead of TS1 was used were designated with a box and darker color. P values were calculated with Gehan-Breslow-Wilcoxon test. (E-F) Survival curves of JAK3(M511I)+Suz12gRNA (E) and Suz12gRNA (F) leukemias that were serially transplanted. (G) Representative flow cytometry stainings for CD8 (APC-Cy7, y-axis) and CD4 (PerCP-Cy5.5, x-axis) of thymus and spleen of leukemia cells (pregated on GFP and/or BFP) from 3 different cohorts at time of sacrifice. For all figures except Fig. 2D, Suz12gRNA TS1 was used in Suz12gRNA and JAK3(M511I)+Suz12gRNA mice.
Figure 3.
Figure 3.
Suz12 inactivation causes loss of the H3K27me3 repression mark and increased chromatin accessibility. (A) Centered heat maps of the ChIP-seq Suz12 signals in the different leukemia conditions, centered on Suz12 peaks in J control leukemias. (B-C) Global Suz12 and H3K27me3 signal densities comparing J+S1 vs J and S1 vs WT. J, JAK3(M511I) leukemia; J+S1, JAK3(M511I)+Suz12gRNA leukemia; S1, Suz12gRNA leukemia; WT, wild-type cells. (D) Principle component analysis (PCA) plot showing clustering of RNA samples according to genotype and immunophenotype (SP = CD8 single positive vs DP = CD8/CD4 double positive). (E) Volcano plots showing the significance of the differential gene expression vs fold change. Red dots are upregulated genes with a disappearing Suz12 (left) or H3K27me3 (right) peak; blue dots are downregulated genes with a disappearing Suz12 (left) or H3K27me3 (right) peak. (F) GSEA showing significant positive enrichment of genes with a disappearing H3K27me3 peak in the ranked list of differentially expressed genes in J+S1 vs J (SP background) and S1 vs WT (DP background). (G) GSEA showing significant positive enrichment of genes with an appearing ATAC-seq peak in the ranked list of differentially expressed genes in J+S1 vs J (SP background) and S1 vs WT (DP background). (H) GSEA showing significant positive enrichment of PRC2 target genes in the ranked list of differentially expressed genes in J+S1 vs J (SP background) and S1 vs WT (DP background). NES, normalized enrichment score; p, nominal P value. (I) RNA-seq counts show upregulation of canonical PRC2 targets Hoxa3 and Hoxa5 on Suz12 loss (S1, J+S1). Expression (mean with SEM) is relative to wild-type (WT) levels. P values, calculated with 2-tailed unpaired Student t test, denote significant differences between J+S1 vs J cells and S1 vs J cells.
Figure 4.
Figure 4.
Suz12 inactivation causes activation of the PI3K/mTOR, VEGF/VEGFR and WNT signaling pathways. (A) Results of overrepresentation enrichment analysis of the KEGG canonical pathways in the set of upregulated genes in JAK3(M511I)+Suz12gRNA leukemias (J+S1 vs J), ranked according to lowest false discovery rate (FDR). The number of genes within a pathway is indicated in brackets. (B) Similar analysis as in A, but now with the canonical pathways. (C-E) Drug dose response curves showing viability of (leukemia) cells in response to 24 hours of treatment with increasing concentrations of PI3K/mTOR inhibitor dactolisib (C), VEGFR inhibitor sunitinib (D), and WNT inhibitor PKF118-310 (E). HSPC, wild-type hematopoietic stem and progenitor cells; Thy, wild-type thymocytes. For all drug dose response curves, percentage viability is defined as percentage surviving cells relative to DMSO concentration. GI50 values are shown.
Figure 5.
Figure 5.
Suz12 loss activates PI3K-AKT-mTOR pathway signaling. (A) Heat map of PI3K/mTOR signaling pathway genes in leukemias with Suz12 inactivation (J+S1 vs J and S1 vs WT), gene expression is shown as normalized read counts. (B) ChIP-seq tracks showing Suz12, H3K27me3, and H3K4me3 signals in S1 vs WT and J+S1 vs J conditions for the Pik3cb and Akt3 promoter. (C-F) Quantifications of MFI with SEM of phosphorylation (p-) levels and (total) protein levels of key components of the PI3K-AKT-mTOR signaling pathway: Akt (C), GSK3β (D), S6 (E), and S6K (F). P values, calculated with 2-tailed unpaired Student t test, denote significant differences between J+S1 and J cells. All MFI measurements were in APC, except total GSK3β was in PE. (G-I) Flow cytometry plots and quantifications of MFI with SEM of phosphorylation levels of Akt (G), S6 (H), and S6K (I) in J+S1 leukemia cells treated for 3 hours with 1 μM dactolisib (DAC). P values, calculated with 2-tailed unpaired Student t test, denote significant differences between DMSO and DAC. (J) Survival curve showing disease-specific survival (DSS) of J+S1 leukemia mice treated with DAC. The P value was calculated with Gehan-Breslow-Wilcoxon test. (K) WBC counts of J+S1 mice after 5 days of treatment. The P value, calculated with a 2-tailed unpaired Student t test, denotes a significant difference between DAC and placebo. (L) Weights of spleen and thymus of J+S1 leukemic mice at time of sacrifice. P values, calculated with 2-tailed unpaired Student t test, denote significant differences between placebo and DAC.
Figure 6.
Figure 6.
Suz12 loss enhances VEGF/VEGFR signaling. (A) Heat map of cytokine-cytokine receptor interaction genes in leukemias with Suz12 inactivation (J+S1 vs J and S1 vs WT); gene expression is shown as normalized read counts. (B-C) ChIP-seq tracks showing Suz12, H3K27me3, and H3K4me3 signals in S1 vs WT and J+S1 vs J conditions for the Flt1 locus (B) and Vegfa promoter (C). (D) Vegfa mRNA expression measured as fragments per kilobase per million reads mapped (FPKM) values (RNA-seq, upper panel) and Vegfa protein expression quantified as MFI with SEM. P values were calculated with 2-tailed unpaired Student t test. (E) mRNA expression measured as FPKM values (RNA-seq). P values were calculated with 2-tailed Mann-Whitney test. (F-H) Flow cytometry plots and quantifications of MFI with SEM of phosphorylation levels of Akt (F), S6 (G), and S6K (H) in J+S1 leukemia cells treated for 3 hours with 5 μM sunitinib (SUN). P values, calculated with 2-tailed unpaired Student t test, denote significant differences between DMSO vs SUN. (I) Survival curve showing DSS of J+S1 leukemic mice treated with SUN. The P value was calculated with Gehan-Breslow-Wilcoxon test. (J) WBC counts of J+S1 leukemic mice after 5 days of treatment. The P value was calculated with a 2-tailed unpaired Student t test. (K) Weights of spleen and thymus at time of sacrifice of J+S1 leukemic mice treated with SUN vs placebo. P values were calculated with 2-tailed unpaired Student t test.
Figure 7.
Figure 7.
Leukemias with Suz12 loss are sensitive to inhibitors targeting the HDAC6/HSP90 axis. (A) Graph showing results of drug screen performed on JAK3(M511I)+Suz12gRNA (J+S1) vs JAK3(M511I) (J) leukemia cells ex vivo. A total of 181 drugs in screen are ranked according to J/J+S score. J/J+S score is defined as the ratio of the viability of the JAK3(M511I) leukemia cells (J) divided by the viability of the JAK3(M511I)+Suz12gRNA leukemia cells (J+S). (B) Heat map of a selection of 12 drugs from the screen showing differential sensitivity between J+S1 leukemia cells and J leukemia cells. The average viability of the 2 conditions was centered to 0. (C-E) Drug dose response curves showing viability of (leukemia) cells in response to 24 hours of treatment with increasing concentrations of HDAC6 inhibitor ricolinostat (C), HSP90 inhibitor 17-AAG (D), and HSP90 inhibitor PU-H71 (E). Percentage viability is defined as percentage surviving cells relative to DMSO concentration. GI50 values are shown. (F-H) Intracellular flow cytometry plots and quantifications of HSP90-PE MFIs with SEM after overnight (18 hours) treatment with Ricolinostat (RIC: 1, 2, or 5 μM) vs DMSO in J+S1 (F), S1 (G), and J (H) leukemia cells. (I) Survival curve showing DSS of J+S1 leukemic mice treated with RIC, 17-AAG, or placebo. The P values were calculated with Gehan-Breslow-Wilcoxon test. (J) WBC counts of J+S1 leukemic mice after 5 days of treatment. P values were calculated with 2-tailed unpaired Student t tests. (K) Weights of spleen and thymus at time of sacrifice of J+S1 leukemic mice treated with placebo vs RIC or 17-AAG. P values were calculated with 2-tailed unpaired Student t test.

References

    1. Margueron R, Reinberg D. The Polycomb complex PRC2 and its mark in life. Nature. 2011;469(7330):343-349. - PMC - PubMed
    1. Comet I, Riising EM, Leblanc B, Helin K. Maintaining cell identity: PRC2-mediated regulation of transcription and cancer. Nat Rev Cancer. 2016;16(12):803-810. - PubMed
    1. Kim KH, Roberts CWM. Targeting EZH2 in cancer. Nat Med. 2016;22(2):128-134. - PMC - PubMed
    1. McCabe MT, Graves AP, Ganji G, et al. . Mutation of A677 in histone methyltransferase EZH2 in human B-cell lymphoma promotes hypertrimethylation of histone H3 on lysine 27 (H3K27). Proc Natl Acad Sci USA. 2012;109(8):2989-2994. - PMC - PubMed
    1. Béguelin W, Popovic R, Teater M, et al. . EZH2 is required for germinal center formation and somatic EZH2 mutations promote lymphoid transformation. Cancer Cell. 2013;23(5):677-692. - PMC - PubMed

Publication types