. 2019 Nov;96(5):641-654.
doi: 10.1124/mol.119.117069. Epub 2019 Sep 6.

Induction via Functional Protein Stabilization of Hepatic Cytochromes P450 upon gp78/Autocrine Motility Factor Receptor (AMFR) Ubiquitin E3-Ligase Genetic Ablation in Mice: Therapeutic and Toxicological Relevance

Affiliations

Induction via Functional Protein Stabilization of Hepatic Cytochromes P450 upon gp78/Autocrine Motility Factor Receptor (AMFR) Ubiquitin E3-Ligase Genetic Ablation in Mice: Therapeutic and Toxicological Relevance

Doyoung Kwon et al. Mol Pharmacol. 2019 Nov.

Abstract

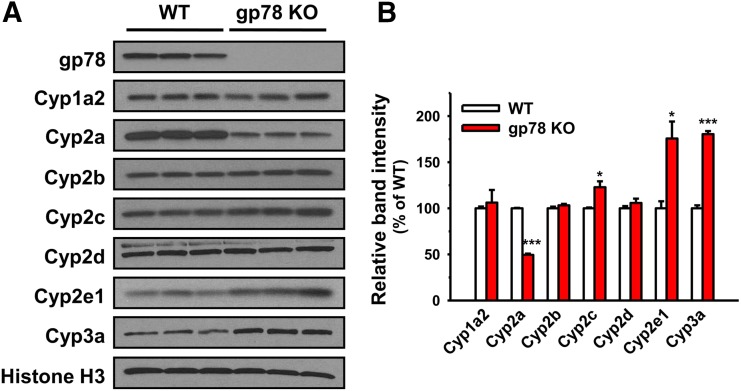
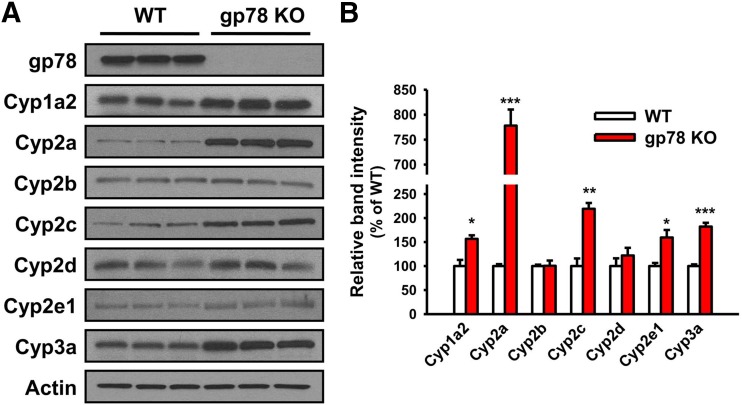
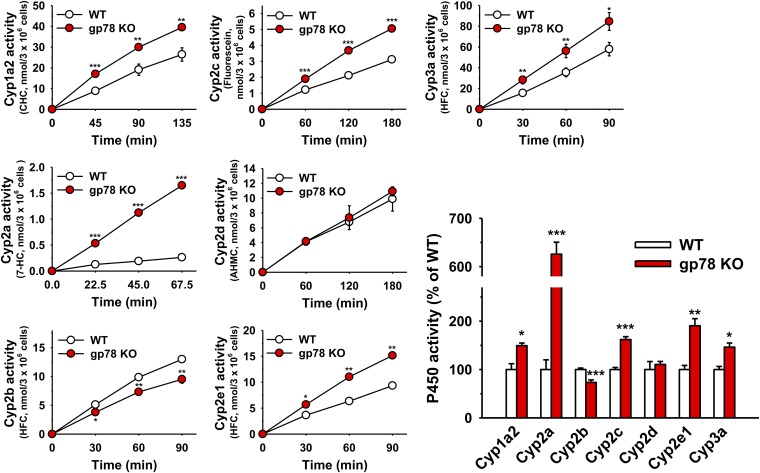
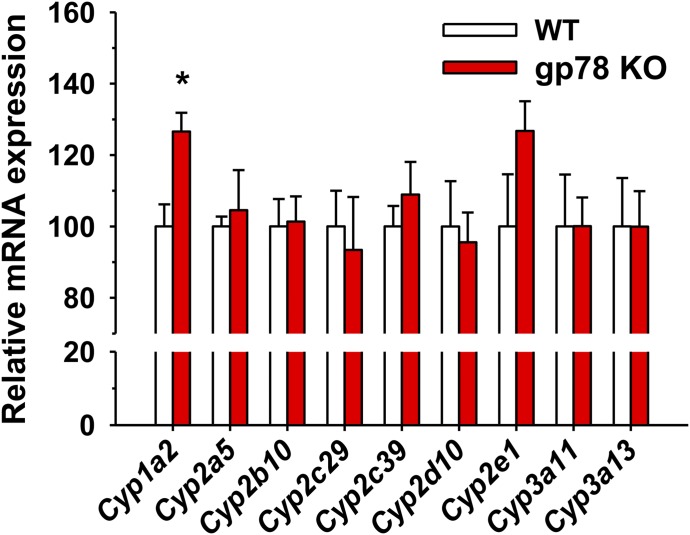
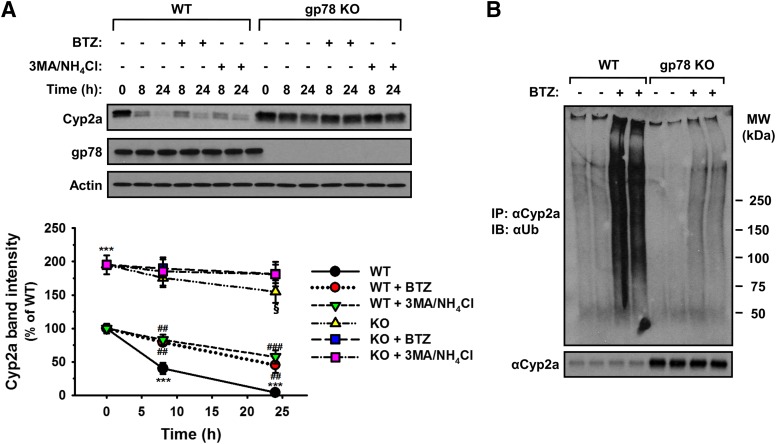
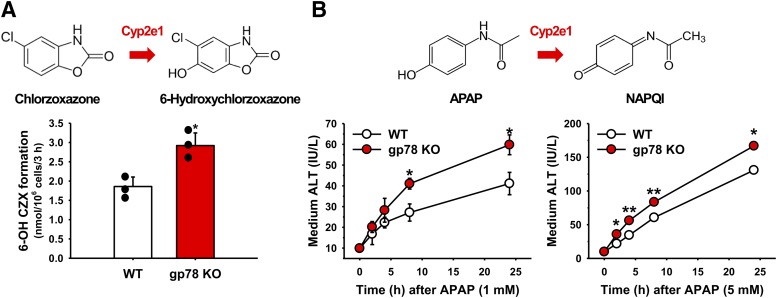
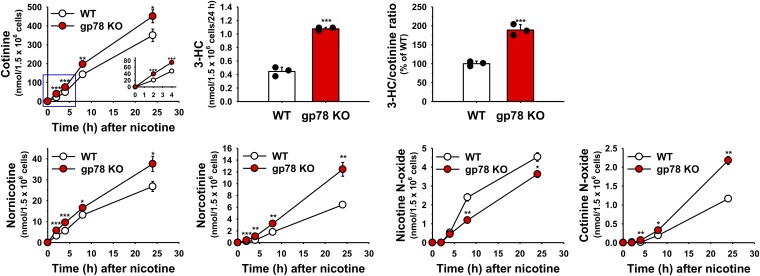
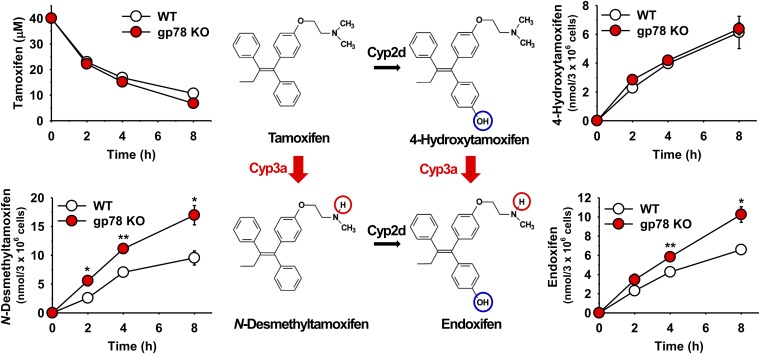
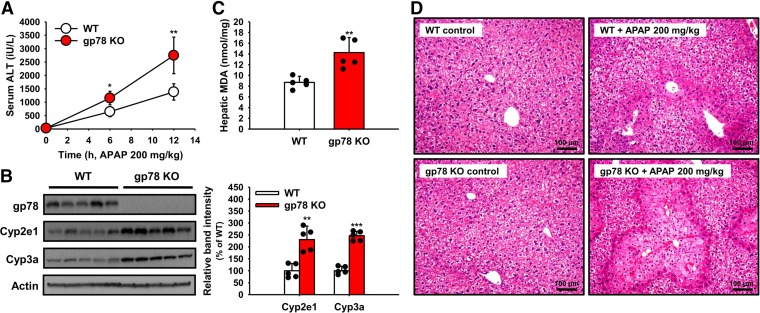
The hepatic endoplasmic reticulum (ER)-anchored monotopic proteins, cytochromes P450 (P450s), are enzymes that metabolize endobiotics (physiologically active steroids and fatty acids), as well as xenobiotics including therapeutic/chemotherapeutic drugs, nutrients, carcinogens, and toxins. Alterations of hepatic P450 content through synthesis, inactivation, or proteolytic turnover influence their metabolic function. P450 proteolytic turnover occurs via ER-associated degradation (ERAD) involving ubiquitin (Ub)-dependent proteasomal degradation (UPD) as a major pathway. UPD critically involves P450 protein ubiquitination by E2/E3 Ub-ligase complexes. We have previously identified the ER-polytopic gp78/AMFR (autocrine motility factor receptor) as a relevant E3 in CYP3A4, CYP3A23, and CYP2E1 UPD. We now document that liver-conditional genetic ablation of gp78/AMFR in male mice disrupts P450 ERAD, resulting in statistically significant stabilization of Cyp2a5 and Cyp2c, in addition to that of Cyp3a and Cyp2e1. More importantly, we establish that such stabilization is of the functionally active P450 proteins, leading to corresponding statistically significant enhancement of their drug-metabolizing capacities. Our findings, with clinically relevant therapeutic drugs (nicotine, coumarin, chlorzoxazone, and acetaminophen) and the prodrug (tamoxifen) as P450 substrates, reveal that P450 ERAD disruption could influence therapeutic drug response and/or toxicity, warranting serious consideration as a potential source of clinically relevant drug-drug interactions (DDIs). Because gp78/AMFR is not only an E3 Ub-ligase, but also a cell-surface prometastatic oncogene that is upregulated in various malignant cancers, our finding that hepatic gp78/AMFR knockout can enhance P450-dependent bioactivation of relevant cancer chemotherapeutic prodrugs is of therapeutic relevance and noteworthy in prospective drug design and development. SIGNIFICANCE STATEMENT: The cell-surface and ER transmembrane protein gp78/AMFR, a receptor for the prometastatic autocrine motility factor (AMF), as well as an E3 ubiquitin-ligase involved in the ER-associated degradation (ERAD) of not only the tumor metastatic suppressor KAI1 but also of hepatic cytochromes P450, is upregulated in various human cancers, enhancing their invasiveness, metastatic potential, and poor prognosis. Liver-specific gp78/AMFR genetic ablation results in functional protein stabilization of several hepatic P450s and consequently enhanced drug and prodrug metabolism, a feature that could be therapeutically exploited in the bioactivation of chemotherapeutic prodrugs through design and development of novel short-term gp78/AMFR chemical inhibitors.


Figures

Fig. 1.
Fig. 1.
Strategy for generating the liver-conditional gp78/AMFR-KO mouse model and corresponding validation. (A) Conditional gene trap (cgt) strategy to develop gp78-floxed (gp78f) mice and, subsequently, liver-conditional gp78-KO mice (gp78). Arrows indicate the sites of the genotyping primers employed. (B and C) PCR genotype analyses of genomic DNA isolated via tail-clipping of mice at various stages of the strategy. See Materials and Methods for experimental details. The primer pairs for each genotyping product and the corresponding amplicon size are indicated. flpF/flpR primers used to verify the amplicon obtained upon Flpe recombinase in WT (+/+); cgt/+, heterozygous with the cgt-cassette insert; and cgt/cgt, homozygous with the cgt-cassette insert. Amplicons verifying WT gp78 (+/+), Alb/Cre, heterozygous gp78-KO (+/−), and Alb-Cre and homozygous gp78-KO (−/−), each Alb-Cre carrying an Alb-Cre allele upon mating with Alb-Cre/Alb-Cre mice. (D) IB analyses of liver and brain lysates from WT and KO mice with a rabbit anti-mouse gp78-antibody, verifying the liver-specific gp78 KO.
Fig. 2.
Fig. 2.
IB analyses of constitutive hepatic P450s from WT and gp78-KO mice. (A) IB analyses of a representative mouse sample. (B) Densitometric quantification of the approx. 50–55 kDa P450 band from hepatocytes freshly isolated and uncultured from three individual WT and gp78-KO mice. See Materials and Methods for details. Values (mean ± S.D.) of three individual experiments, each employing two culture plates (technical replicates) of hepatocytes isolated from each of the three mice. Statistical significance determined by the Student’s t test, *,***P < 0.05, and 0.001 vs. WT, respectively.
Fig. 3.
Fig. 3.
IB analyses of hepatic P450s from cultured WT and gp78-KO mouse hepatocytes. (A) IB analyses of a representative mouse sample. (B) Densitometric quantification of the approx. 50- to 55-kDa P450 band from hepatocytes isolated from three individual WT and gp78-KO mice, cultured and pretreated with P450-inducers. See Materials and Methods for details. Values (mean ± S.D.) of three individual experiments, each employing two culture plates (technical replicates) of hepatocytes isolated from each of the three mice. Statistical significance determined by the Student’s t test, *,**,***P < 0.05, 0.01, and 0.001 vs. WT, respectively.
Fig. 4.
Fig. 4.
P450 functional screening using diagnostic fluorescent probes. Hepatocytes from three WT and gp78-KO mice were cultured separately, pretreated with P450-inducers, and then incubated with individual diagnostic functional probes at time 0 hour. See Materials and Methods for details. Values (mean ± S.D.) of three individual experiments each employing two culture plates (technical replicates) of hepatocytes isolated from each of the three mice. Statistical significance determined by the Student’s t test, *,**,***P < 0.05, 0.01, and 0.001 vs. WT, respectively.
Fig. 5.
Fig. 5.
Relative P450 mRNA expression in cultured WT and gp78-KO mouse hepatocytes. Total RNA was extracted on day 4 from cultured hepatocytes, untreated or pretreated with P450 inducers for 3 days. Hepatic P450 mRNA expression was determined by qRT-PCR analyses as detailed in Materials and Methods. Values (mean ± S.D.) are derived from three individual cultures pretreated with P450 inducers as detailed. Statistical significance determined by the Student’s t test, *P < 0.05 vs. WT. GAPDH mRNA Ct levels (mean ± S.D.) between P450-inducer pretreated WT and gp78-KO cultured hepatocytes were as follows: βNF: 100 ± 1.92 (WT)/101.49 ± 1.75 (gp78 KO); PB: 100 ± 1.67 (WT)/100.33 ± 1.61 (gp78 KO); INH: 100 ± 1.99 (WT)/99.72 ± 1.66 (gp78 KO); DEX: 100 ± 2.19 (WT)/102.85 ± 3.94 (gp78 KO). No statistically significant differences were noted by the Student’s t test in GAPDH Ct values between WT and gp78-KO cultured hepatocytes pretreated with each of the four P450 inducers. Ct, threshold cycle.
Fig. 6.
Fig. 6.
Hepatic Cyp2a5 UPD and ALD: a major role of gp78 in Cyp2a5 ubiquitination. (A) Cycloheximide-chase analyses of hepatocytes from three individual WT and gp78-KO mice were cultured, PB-pretreated for 3 days, and on day 4 treated with or without the proteasomal inhibitor bortezomib (BTZ) or the ALD-inhibitors 3-MA/NH4Cl for 0, 8, and 24 hours before cell harvesting. Cell lysates were immunoblotted for Cyp2a or gp78 with actin as a loading control. Densitometric quantification (mean ± S.D.) of individual cultures from three mice. Statistical significance determined by the Student’s t test, ***P < 0.001 vs. WT at 0 hour; ##, ###P < 0.01, 0.001 vs. WT+ CHX; §P < 0.05 vs. KO at 0 hour. (B) Representative Ub-immunoblotting analyses of Cyp2a-immunoprecipitates from aliquots of PB-pretreated cultured cell lysates obtained from two of the three different mice treated with or without BTZ as in (A).
Fig. 7.
Fig. 7.
Relative chlorzoxazone metabolism and APAP-elicited liver injury in cultured WT and gp78-KO mouse hepatocytes. (A) INH-pretreated hepatocytes (three individual cultures) from WT and gp78-KO mice were incubated on day 4 with chlorzoxazone for 3 hours and 6-hydroxychlorzoxazone assayed as detailed in Materials and Methods. Values (mean ± S.D.) of three individual cultures. Statistical significance determined by the Student’s t test, *P < 0.05 vs. WT. (B) WT and gp78-KO mouse hepatocyte cultures were INH-pretreated, and on day 4 incubated with APAP (1 or 5 mM) for 0–24 hours. Aliquots of media were taken at the time points indicated and assayed for ALT activity as detailed in Materials and Methods. Values (mean ± S.D.) of three individual cultures. Statistical significance determined by the Student’s t test, *P < 0.05 vs. WT, **P < 0.01 vs. WT.
Fig. 8.
Fig. 8.
Relative nicotine metabolism in cultured WT and gp78-KO mouse hepatocytes. PB-pretreated hepatocytes from WT and gp78-KO mice were cultured, and on day 4 incubated with nicotine for 0–24 hours. Aliquots of media were taken at the time points indicated and assayed as detailed in Materials and Methods. The insert in the cotinine production graph is a magnified view of the initial three time points demarcated by the blue square. 3-HC levels and 3-HC/cotinine ratios were determined at 24 hour. Values (mean ± S.D.) of three individual cultures. Statistical significance determined by the Student’s t test, *P < 0.05 vs. WT, **P < 0.01 vs. WT, ***P < 0.001 vs. WT.
Fig. 9.
Fig. 9.
Relative tamoxifen metabolism in cultured WT and gp78-KO mouse hepatocytes. WT and gp78-KO mouse hepatocyte cultures were DEX-pretreated and on day 4 incubated with tamoxifen (40 μM) for 0–8 hours. Aliquots of cell media were taken at the time points indicated and assayed as detailed in Materials and Methods. Values (mean ± S.D.) of three individual cultures. Statistical significance determined by Student’s t test, *P < 0.05 or **P < 0.01 vs. WT.
Fig. 10.
Fig. 10.
In vivo APAP-elicited liver injury in WT and gp78-KO mice. After an overnight fast (12 hours), mice (N = 5 in each group) were treated with APAP and their serum ALT levels determined at 0, 6, and 12 hours (A) as detailed (Materials and Methods). Mice were killed at 12 hours and their livers used for Cyp2e1 and Cyp3a IB analyses (B) and hepatic MDA levels (C) as described (Materials and Methods). The five individual values used for the MDA (mean ± S.D.) values are included in the bar graph. Statistical significance determined by the Student’s t test, *P < 0.05 or **P < 0.01 vs. WT. Liver injury upon hematoxylin and eosin staining and microscopic histologic analyses of representative control and APAP-treated WT and gp78-KO mouse livers isolated at 12 hours is shown in the right panels (D). ***P < 0.001 vs. WT.

Similar articles

Cited by

References

    1. Acharya P, Liao M, Engel JC, Correia MA. (2011) Liver cytochrome P450 3A endoplasmic reticulum-associated degradation: a major role for the p97 AAA ATPase in cytochrome P450 3A extraction into the cytosol. J Biol Chem 286:3815–3828. - PMC - PubMed
    1. Bajt ML, Knight TR, Lemasters JJ, Jaeschke H. (2004) Acetaminophen-induced oxidant stress and cell injury in cultured mouse hepatocytes: protection by N-acetyl cysteine. Toxicol Sci 80:343–349. - PubMed
    1. Ballinger CA, Connell P, Wu Y, Hu Z, Thompson LJ, Yin LY, Patterson C. (1999) Identification of CHIP, a novel tetratricopeptide repeat-containing protein that interacts with heat shock proteins and negatively regulates chaperone functions. Mol Cell Biol 19:4535–4545. - PMC - PubMed
    1. Benowitz NL, Dains KM, Dempsey D, Yu L, Jacob P., III (2010) Estimation of nicotine dose after low-level exposure using plasma and urine nicotine metabolites. Cancer Epidemiol Biomarkers Prev 19:1160–1166. - PMC - PubMed
    1. Bhushan B, Walesky C, Manley M, Gallagher T, Borude P, Edwards G, Monga SP, Apte U. (2014) Pro-regenerative signaling after acetaminophen-induced acute liver injury in mice identified using a novel incremental dose model. Am J Pathol 184:3013–3025. - PMC - PubMed

Publication types

MeSH terms