. 2019 Nov 4;218(11):3583-3596.
doi: 10.1083/jcb.201902105. Epub 2019 Sep 6.

Mammalian kinetochores count attached microtubules in a sensitive and switch-like manner

Affiliations

Mammalian kinetochores count attached microtubules in a sensitive and switch-like manner

Jonathan Kuhn et al. J Cell Biol. .

Abstract

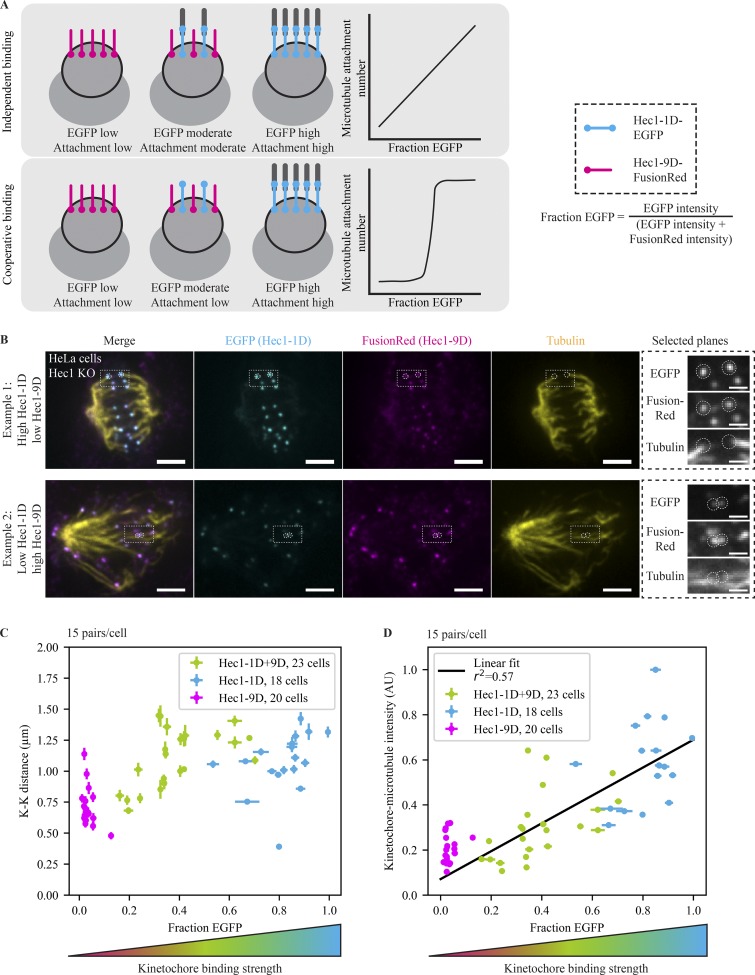
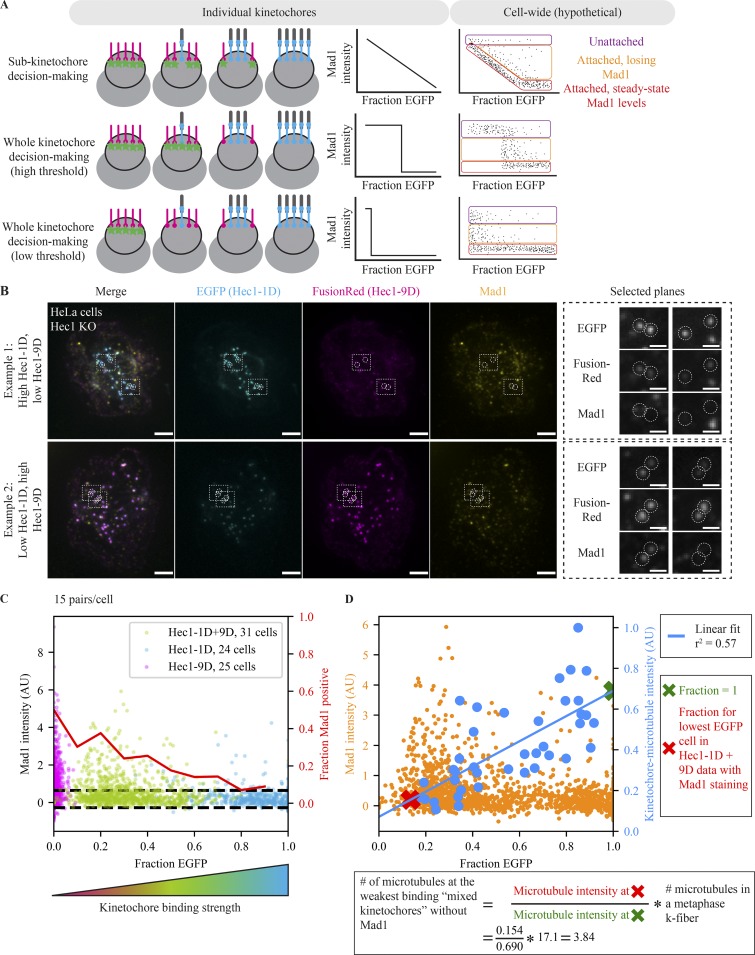
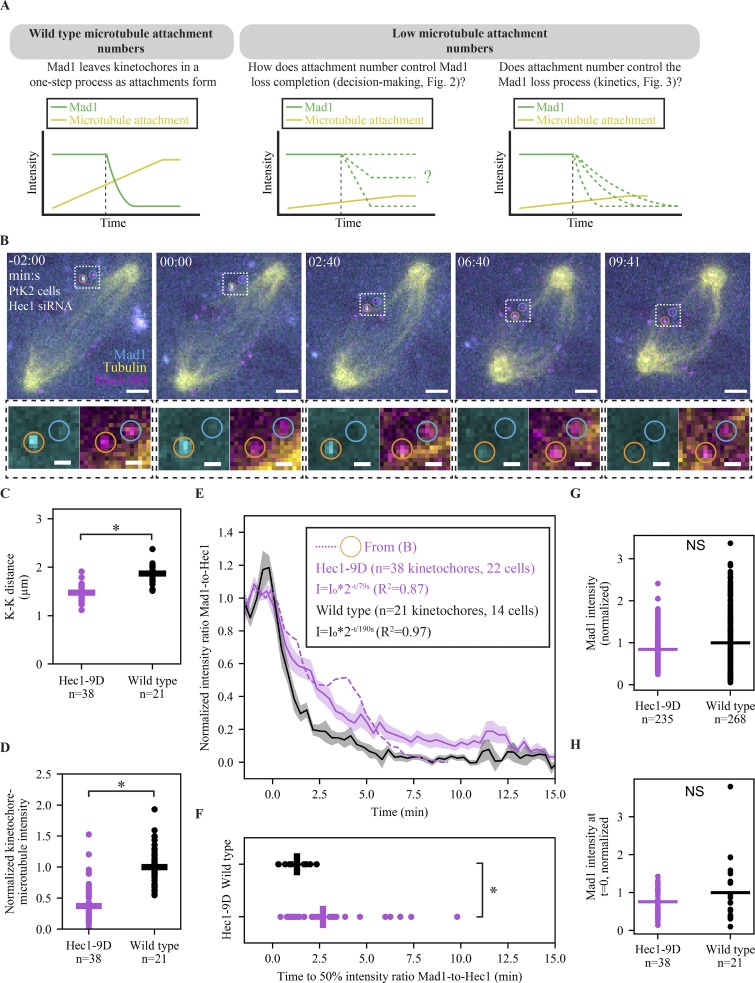
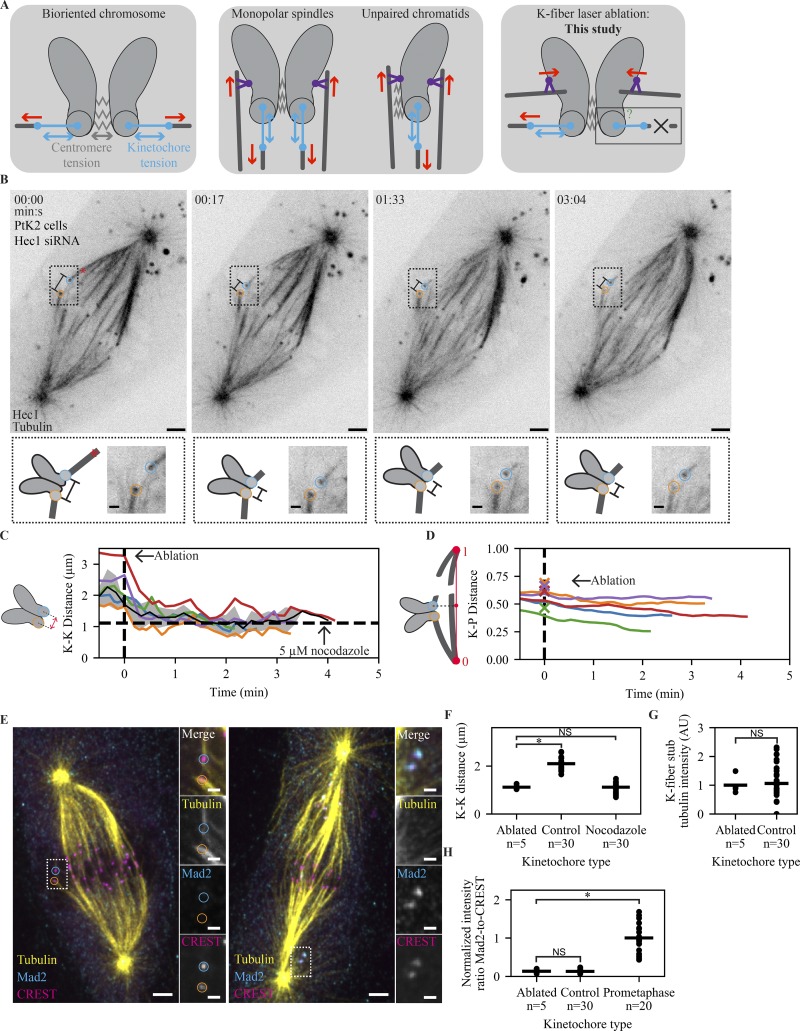
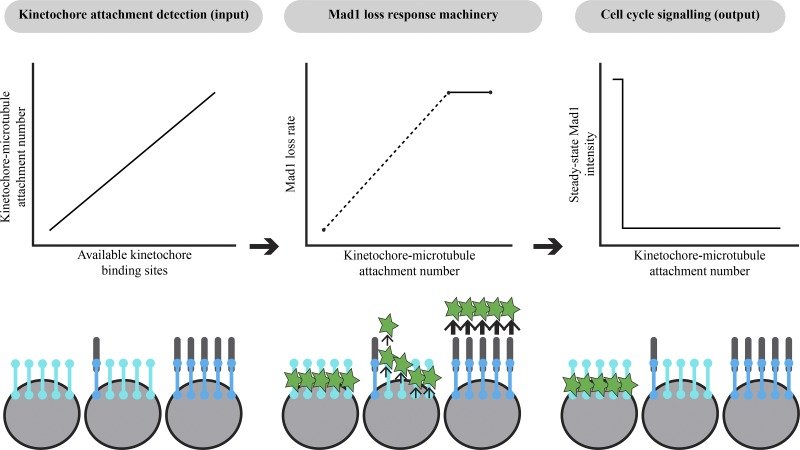
The spindle assembly checkpoint (SAC) prevents anaphase until all kinetochores attach to the spindle. Each mammalian kinetochore binds many microtubules, but how many attached microtubules are required to turn off the checkpoint, and how the kinetochore monitors microtubule numbers, are not known and are central to understanding SAC mechanisms and function. To address these questions, here we systematically tune and fix the fraction of Hec1 molecules capable of microtubule binding. We show that Hec1 molecules independently bind microtubules within single kinetochores, but that the kinetochore does not independently process attachment information from different molecules. Few attached microtubules (20% occupancy) can trigger complete Mad1 loss, and Mad1 loss is slower in this case. Finally, we show using laser ablation that individual kinetochores detect changes in microtubule binding, not in spindle forces that accompany attachment. Thus, the mammalian kinetochore responds specifically to the binding of each microtubule and counts microtubules as a single unit in a sensitive and switch-like manner. This may allow kinetochores to rapidly react to early attachments and maintain a robust SAC response despite dynamic microtubule numbers.


Figures

Figure 1.
Figure 1.
Kinetochore-microtubule occupancy scales linearly with the number of functional Hec1 subunits. (A) Schematic depicting experimental design and expected outcomes. After deleting endogenous Hec1, strong (Hec1-1D, blue) and weak (Hec1-9D, pink) microtubule-binding mutants are expressed. Cells randomly receive different fractions of functional binders and therefore have different microtubule occupancies. Depending on whether Hec1 subunits bind microtubules cooperatively or independently, microtubule attachment may change rapidly or gradually. Hec1-9D kinetochores are depicted without attached microtubules for simplicity but may have low-affinity attachments. (B) Immunofluorescence imaging (maximum-intensity projection) of microtubule attachments (tubulin), Hec1-1D intensity (anti-EGFP), and Hec1-9D intensity (anti-mKate, binds to FusionRed) in Hec1 knockout cells expressing Hec1-1D-EGFP and Hec1-9D-FusionRed. Cells were treated with 5 µM MG132 to accumulate them at a metaphase spindle steady state. The two highlighted examples were taken from the same coverslip, where the top has a high Hec1-1D to -9D ratio and the bottom a low ratio. Scale bars = 3 µm (large) and 1 µm (zoom). (C and D) Mean of cellular EGFP fraction for each cell versus mean cellular K-K distance (C) and mean cellular kinetochore microtubule intensity (D) from Hec1 knockout cells in B with mixed kinetochores (n = 345 pairs, 690 kinetochores, 23 cells; green) and cells with control Hec1-1D alone (n = 270, 540, 18; blue) and Hec1-9D alone coverslips (n = 300, 600, 20; pink; D). The relationship between microtubule attachment and amount of strong binders fits a linear relationship (r2 = 0.57) better than an exponential one (r2 = 0.51). Error bars = SEM. All data displayed were acquired at the same time for all conditions and with the data in Fig. 2.
Figure 2.
Figure 2.
The number of attached microtubules regulates steady-state Mad1 localization in a switch-like, highly sensitive manner. (A) Schematic depicting models for kinetochore signal integration and expected hypothetical outcomes. The kinetochore processes microtubule attachments either as many individual units (top) or as one single unit (switch like) with a high (middle) or low (bottom) threshold. On the cellular scale, we expect three kinetochore populations: completely unattached (purple), attached and in the process of losing Mad1 (orange), and at attached steady-state Mad1 levels (red). The relative number of kinetochores in each population is arbitrary. (B) Immunofluorescence imaging (maximum-intensity projection) of SAC activation (Mad1), Hec1-1D intensity (anti-EGFP), and Hec1-9D intensity (anti-mKate, binds to FusionRed) in Hec1 knockout cells expressing both Hec1-1D-EGFP and Hec1-9D-FusionRed. Cells were treated with 5 µM MG132 to accumulate them at a metaphase spindle steady state. The two examples are cells on the same coverslip, where the top has a high Hec1-1D to -9D ratio and the bottom a low ratio. Kinetochores in both conditions are capable of recruiting (left zoom) and losing (right zoom) Mad1. Scale bars = 3 µm (large) and 1 µm (zoom). (C) Fraction EGFP versus Mad1 intensity from mixed kinetochore cells in B (n = 930 kinetochores, 31 cells; green) and cells with control Hec1-1D (n = 720, 24; blue) and Hec1-9D (n = 750, 25; pink) alone. Red line indicates the fraction of kinetochores with Mad1 intensities 1 SD (dashed black lines) greater than average Mad1 intensity on Hec1-1D kinetochores. (D) Fraction EGFP versus Mad1 intensity (B and C) or average end-on attached microtubule numbers (Fig. 1, B–D) for Hec1-1D alone and Hec1-1D + -9D conditions. Blue line indicates linear fit for cellular average fraction EGFP versus cellular average kinetochore–microtubule intensity (r2 = 0.57, P = 10−8). Xs indicate the points along the fit used for the calculation of attached microtubule number (red, average fraction EGFP for the lowest fraction EGFP cell in mixed kinetochores in which some kinetochores are Mad1-negative; green, fraction EGFP of 1). Calculation of the number of microtubules at the weakest binding mixed kinetochores without Mad1 uses the average number of microtubules in a metaphase k-fiber from Wendell et al. (1993) (see Materials and methods). All data displayed was acquired at the same time for all conditions and with the data in Fig. 1. Alternative estimation methods lead to similar estimates (Fig. S2 B).
Figure 3.
Figure 3.
Lowering microtubule occupancy at a kinetochore slows down the process of Mad1 loss. (A) Schematic of how the number of attached microtubules could influence two different properties of Mad1 loss: the decision to complete loss and the speed of loss. (B) Time-lapse imaging (maximum-intensity projection) of representative Mad1 loss kinetics (EYFP-Mad1) and microtubule attachment (SiR-Tubulin) in a Hec1-RNAi PtK2 cell with decreased kinetochore–microtubule affinity (Hec1-9D-FusionRed). Scale bars = 3 µm (large) and 1 µm (zoom), and t = 0 indicates the start of Mad1 loss on the orange-circled kinetochore. (C) Individual (circles) and average (lines) K-K distance in WT (n = 21 pairs) and Hec1-9D (n = 38) cells. (D) Individual (circles) and average (lines) kinetochore–microtubule intensity normalized to cellular astral microtubule intensity in Hec1-9D (n = 22 cells) and WT (n = 14 cells). (E and F) Mean, SEM, and individual trace (E) of the orange-circled kinetochore in B of the Mad1-to-Hec1 intensity ratio with t = 0 being the Mad1 loss start, and distribution of times to reach a 50% intensity ratio (F) of initial Mad1-to-Hec1, in WT cells (n = 21 kinetochores) and Hec1-9D-expressing cells (n = 38). WT data taken from Kuhn and Dumont (2017) and acquired in a parallel experiment. (G and H) Individual (circles) and average (lines) kinetochore EYFP-Mad1 intensity in 5 µM nocodazole (G) or right before Mad1 loss start (H) in Hec1-9D and WT cells. *, P < 0.005, two-sided Mann–Whitney U test).
Figure 4.
Figure 4.
The mammalian SAC does not detect changes in spindle-pulling forces at individual kinetochores. (A) Schematic of different spatial arrangements used to probe the role of tension in the SAC. After biorientation, both centromere and kinetochore are under force (left). Preventing biorientation in monopolar or mitosis with an unreplicated genome spindles removes force (red) across the centromere, but force (red) can still be generated across the kinetochore through polar ejection forces generated by chromokinesins (purple; middle). By removing pulling force using laser ablation (X), force can in principle be generated neither across the centromere nor the kinetochore. (B) Time-lapse imaging of microtubule attachments (EGFP-tubulin) and kinetochores (Hec1-EGFP) in a metaphase PtK2 cell under Hec1 RNAi + partial NuMA RNAi during the mechanical isolation of the highlighted k-fiber (circles) using laser ablation (red X, t = 0). Bottom: Schematic and zoom of highlighted pair. Scale bars = 3 µm (large) and 1 µm (zoom). (C) Mean, SEM, and individual K-K distance of pairs before and after ablation (time of fixation is ∼30 s from the end of trace). Vertical dashed line marks first ablation. Horizontal dashed line marks the average K-K distance in 5 µM nocodazole (n = 30 kinetochores). Example in B is the purple trace. (D) Normalized distance along the pole-to-pole axis for disconnected kinetochores before and after ablation. Dashed line marks first ablation, and X’s indicate ablation position. Example in B is the purple trace. (E) Immunofluorescence imaging (maximum-intensity projection) of microtubule attachment (tubulin), kinetochores (CREST), and SAC activation (Mad2) at (left) the cell in B and (right) a prometaphase cell on the same dish at approximately t = 3:40. Scale bars = 3 µm (large) and 1 µm (zoom). (F–H) Individual (circles) and average (lines) K-K distance (F), k-fiber intensity (G), and SAC activation (H; Mad2/CREST, normalized to prometaphase intensity) at ablated kinetochores (n = 5), same-cell controls without ablation (n = 30), and prometaphase cells on the same dish (n = 20). There is no SAC activation and no change in attachment intensity on sister kinetochores attached to an ablated k-fiber, and ablation reduces K-K distance to a value similar to that in nocodazole (P = 0.40).
Figure 5.
Figure 5.
The mammalian kinetochore integrates attachment input signals in a sensitive and switch-like manner. Microtubules bind kinetochore attachment subunits independently rather than cooperatively, leading to a wide range of kinetochore–microtubule attachment numbers (left; Fig. 1). The speed of this response, the loss of Mad1, is sensitive to the number of microtubules attached (middle): Mad1 loss rates are slow at weakly attached kinetochores (Fig. 3) and reach a maximum at kinetochores with WT attachment numbers (Kuhn and Dumont, 2017). However, kinetochores with very low microtubule occupancy are still capable of fully removing Mad1 (Fig. 2), resulting in a decision-making process that is highly sensitive and switch-like (right). The combination of switch-like decision making and a tunable response rate is well suited to allow cells to rapidly exit mitosis while preventing errors (see Discussion).

Similar articles

Cited by

References

    1. Akiyoshi B., Sarangapani K.K., Powers A.F., Nelson C.R., Reichow S.L., Arellano-Santoyo H., Gonen T., Ranish J.A., Asbury C.L., and Biggins S.. 2010. Tension directly stabilizes reconstituted kinetochore-microtubule attachments. Nature. 468:576–579. 10.1038/nature09594 - DOI - PMC - PubMed
    1. Alushin G.M., Ramey V.H., Pasqualato S., Ball D.A., Grigorieff N., Musacchio A., and Nogales E.. 2010. The Ndc80 kinetochore complex forms oligomeric arrays along microtubules. Nature. 467:805–810. 10.1038/nature09423 - DOI - PMC - PubMed
    1. Aravamudhan P., Goldfarb A.A., and Joglekar A.P.. 2015. The kinetochore encodes a mechanical switch to disrupt spindle assembly checkpoint signalling. Nat. Cell Biol. 17:868–879. 10.1038/ncb3179 - DOI - PMC - PubMed
    1. Ballister E.R., Riegman M., and Lampson M.A.. 2014. Recruitment of Mad1 to metaphase kinetochores is sufficient to reactivate the mitotic checkpoint. J. Cell Biol. 204:901–908. 10.1083/jcb.201311113 - DOI - PMC - PubMed
    1. Barisic M., Sohm B., Mikolcevic P., Wandke C., Rauch V., Ringer T., Hess M., Bonn G., and Geley S.. 2010. Spindly/CCDC99 is required for efficient chromosome congression and mitotic checkpoint regulation. Mol. Biol. Cell. 21:1968–1981. 10.1091/mbc.e09-04-0356 - DOI - PMC - PubMed

Publication types