. 2019 Oct 25;294(43):15808-15825.
doi: 10.1074/jbc.RA119.010800. Epub 2019 Sep 6.

MicroRNA-455-3p mediates GATA3 tumor suppression in mammary epithelial cells by inhibiting TGF-β signaling

Affiliations

MicroRNA-455-3p mediates GATA3 tumor suppression in mammary epithelial cells by inhibiting TGF-β signaling

Yi Zeng et al. J Biol Chem. .

Abstract

GATA3 is a basic and essential transcription factor that regulates many pathophysiological processes and is required for the development of mammary luminal epithelial cells. Loss-of-function GATA3 alterations in breast cancer are associated with poor prognosis. Here, we sought to understand the tumor-suppressive functions GATA3 normally performs. We discovered a role for GATA3 in suppressing epithelial-to-mesenchymal transition (EMT) in breast cancer by activating miR-455-3p expression. Enforced expression of miR-455-3p alone partially prevented EMT induced by transforming growth factor β (TGF-β) both in cells and tumor xenografts by directly inhibiting key components of TGF-β signaling. Pathway and biochemical analyses showed that one miRNA-455-3p target, the TGF-β-induced protein ZEB1, recruits the Mi-2/nucleosome remodeling and deacetylase (NuRD) complex to the promotor region of miR-455 to strictly repress the GATA3-induced transcription of this microRNA. Considering that ZEB1 enhances TGF-β signaling, we delineated a double-feedback interaction between ZEB1 and miR-455-3p, in addition to the repressive effect of miR-455-3p on TGF-β signaling. Our study revealed that a feedback loop between these two axes, specifically GATA3-induced miR-455-3p expression, could repress ZEB1 and its recruitment of NuRD (MTA1) to suppress miR-455, which ultimately regulates TGF-β signaling. In conclusion, we identified that miR-455-3p plays a pivotal role in inhibiting the EMT and TGF-β signaling pathway and maintaining cell differentiation. This forms the basis of that miR-455-3p might be a promising therapeutic intervention for breast cancer.

Keywords: GATA transcription factor; GATA3; HDAC2; Smad2; ZEB1; breast cancer; epithelial-mesenchymal transition (EMT); gene regulation; miR-455-3p; microRNA (miRNA); nucleosome remodeling deacetylase (NuRD); transforming growth factor beta (TGF-beta).


Conflict of interest statement

The authors declare that they have no conflicts of interest with the contents of this article

Figures
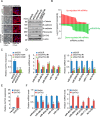
Figure 1.
Figure 1.
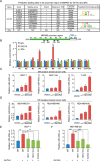
GATA3 induces the transcription of miR-455-3p. A, MCF-7 cells were transduced with short hairpin RNAs against GATA3 ORF (shGATA3 #1) or the 3′-UTR (shGATA3 #2) together with FLAG-tagged GATA3; morphological alterations in these cells were examined by phase-contrast microscopy (left) and F-actin staining (middle). DAPI staining was used to detect nuclei (blue) and rhodamine-conjugated phalloidin for actin polymers (red). The epithelial and mesenchymal markers were detected by Western blotting (right). B, microarray analysis identified 44 up-regulated and 48 down-regulated miRNAs (-fold change > 2) upon knockdown of GATA3 in MCF-7 cells. C, the knockdown efficiency of GATA3 was verified by qPCR. D, verification of the microarray results by qPCR analysis of the indicated miRNAs in GATA3-depleted MCF-7 cells. E, the overexpression level of GATA3 was verified by qPCR. F, verification of the microarray results by qPCR analysis of the indicated miRNAs in MDA-MB-231 cells overexpressed with GATA3. C–F, the miRNA levels were normalized to those of U6. Error bars, S.D. of three independent experiments (*, p < 0.05; **, p < 0.01, two-tailed unpaired t test).
Figure 2.
Figure 2.
GATA3 promotes miR-455-3p transcription independent of ERα. A, the online analysis tool JASPAR was used to predict the potential binding sites of GATA3 and ERα in the promoter region (−2050 to +500) of MIR455. B, primer pairs including #1 to #10 were synthesized to cover the promoter region of MIR455 as indicated. qChIP-based promoter-walk was performed using MCF-7 cells, and the enrichment of GATA3 was mapped to two regions of the MIR455 promoter. Error bars, S.D. of three independent experiments *, p < 0.05; **, p < 0.01, two-tailed unpaired t test). C and D, ER-positive breast cancer cells (MCF-7, MCF 10A, and T-47D) (C) or ER-negative breast cancer cells (MDA-MB-231, MDA-MB-468, and MDA-MB-436) (D) were co-transfected with an miR-455-Luc reporter and FLAG (vector) or increasing amounts of FLAG-GATA3. Firefly luciferase activities were normalized to Renilla luciferase activities and plotted relative to the control. E and F, ER-positive MCF-7 breast cancer cells (E) and ER-negative MDA-MB-231 breast cancer cells (F) were co-transfected with a miR-455-Luc reporter with GATA3-binding sites deleted and FLAG-GATA3. The nonmutated (WT) reporter was used as the control. Firefly luciferase activities were normalized to Renilla luciferase activities and plotted relative to control levels. Error bars, S.D. of three independent experiments (*, p < 0.05; **, p < 0.01, two-tailed unpaired t test).
Figure 3.
Figure 3.
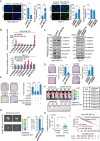
miR-455-3p inhibits the proliferation and metastasis of breast cancer cells. A, EdU cell proliferation assays using MDA-MB-231 cells transfected with control or miR-455-3p mimics and MCF-7 cells transfected with control inhibitor or miR-455-3p inhibitors. B and C, qPCR and Western blotting were performed to examine the expression levels of epithelial or mesenchymal markers in MDA-MB-231 cells overexpressing miR-455-3p or MCF-7 cells transfected with miR-455-3p inhibitors. D, transwell invasion assays of MDA-MB-231 cells transfected with miR-455-3p mimics or inhibitors. The invaded cells were stained and counted as shown. E, GATA3 activated the expression of miR-455-3p to inhibit the invasiveness of breast cancer cells. MDA-MB-231 cells were transiently transfected with expression vectors or miRNA inhibitors as indicated before performing transwell assays. In each experiment, at least six microscopic fields with a ×40 magnification were randomly selected for cell counting. Representative photographs are shown on the left, and statistical analysis is presented on the right. F and G, MDA-MB-231-Luc-D3H2LN cells were infected with lentiviruses harboring plmiR-NC or plmiR-455-3p and inoculated orthotopically into the abdominal mammary fat pad of 6-week-old female SCID mice (n = 6). Primary tumors were quantified from the region of interest (ROI) by performing bioluminescence imaging 6 weeks after initial implantation. Representative in vivo bioluminescent images are shown (F), and tumor specimens were examined by in vitro bioluminescent measurements (G). All scale bars, 1 cm. H, analysis of public dataset GSE68085 for the expression of miR-455-3p, based on a two-tailed unpaired t test. I, Kaplan–Meier survival analysis of the relationship between survival time and miR-455-3p signature in breast cancer using an online tool (http://kmplot.com/analysis/). Each bar (A, B, D, E, G, and H) represents the mean ± S.D. (error bars). *, p < 0.05; **, p < 0.01; ***, p < 0.001, two-tailed unpaired t test.
Figure 4.
Figure 4.
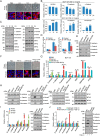
miR-455-3p is associated with the TGF-β signaling pathway. A, pathway analysis of the potential target genes of miR-455-3p arranged into functional groups. B, volcano plot of RNA-Seq data comparing miR-455-3p versus control-treated MCF-7 cells and showing 143 and 333 genes significantly up- and down-regulated, respectively, with a -fold change higher than 1.5 and probability > 0.8. C, scatter plot of the top 10 enriched Kyoto Encyclopedia of Genes and Genomes (KEGG) pathways comprising the up-regulated or down-regulated genes regulated by miR-455-3p. The RichFactor is the ratio of the number of differentially expressed genes annotated in a pathway term to the number of all genes annotated in that pathway term. A greater RichFactor indicates greater intensity. The Q-value is the corrected p value ranging from 0 to 1, and a lower Q-value indicates greater intensity. D and E, GSEA analysis of RNA-Seq data. F, qPCR analysis of indicated mRNAs in cells treated with control or miR-455-3p mimics. Error bars, S.D. of three independent experiments (*, p < 0.05; **, p < 0.01, two-tailed unpaired t test).
Figure 5.
Figure 5.
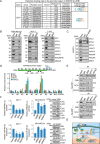
Smad2, ZEB1, and HDAC2 are downstream targets of miR-455-3p. A, the intersection of the Venn diagram (left) displays potential targets of miR-455-3p predicted by miRDB, DIANA, miRANDA, TargetScan, and miWalk algorithms with high-confidence scores. Of these, 212 common targets that are involved in the TGF-β signaling pathway or cell cycle are shown in the table (right). B, sequence alignment of Smad2, ZEB1, and HDAC2 3′-UTRs among human (H. Sapiens), pig (S. scrofa), dog (C. familiaris), and rabbit (O. cuniculus). Mutations generated within the 3′-UTRs of Smad2, ZEB1, or HDAC2 are shown in red. C, WT and mutant (mut) 3′-UTRs of Smad2 (bases 1–330 of the 3′-UTR), ZEB1 (bases 1074 to 3230 of the 3′-UTR), and HDAC2 (bases 1–500 of the 3′-UTR) were cloned into pMIR-Reporter vectors, and luciferase reporter assays were used to identify binding between miR-455-3p sites and indicated 3′-UTRs. After treatment with negative control miR, miR-455-3p mimics (miR-455-3p), or miR-455-3p inhibitors, HEK 293T cells were transfected with WT or the indicated mutant 3′-UTR luciferase reporters and a plasmid encoding Renilla luciferase. Normalized luciferase activity in the control group was set as the relative luciferase activity. Error bars, S.D. of three independent experiments (*, p < 0.05, two-tailed unpaired t test). D, miR-455-3p represses the expression of Smad2, ZEB1, and HDAC2 at the protein level. MDA-MB-231 and MCF-7 cells were transfected with control miR, miR-455-3p mimics, or miR-455-3p inhibitors for 48 h and subjected to Western blot analysis. E, Western blot analysis of Smad2, ZEB1, and HDAC2 protein levels in GATA3-depleted MCF-7 and GATA3-overexpressing MDA-MB-231 cells.
Figure 6.
Figure 6.
miR-455-3p plays an important role in EMT induced by TGF-β. A, phase-contrast images and F-actin staining of MCF 10A cells undergoing EMT after serum starvation (1% serum for 6 h) and TGF-β1 (5 ng/ml) treatment for the indicated times. DAPI staining was used to detect nuclei (blue), and rhodamine-conjugated phalloidin was used for actin polymers (red). B, qPCR analysis of changes in the expression of epithelial and mesenchymal markers or GATA3 in MCF 10A cells treated with TGF-β1. C, Western blot analysis of changes in the expression of indicated proteins in MCF 10A cells treated with TGF-β1 (5 ng/ml). D, relative luciferase activity from p3TP-Lux or ARE-Luc reporters was measured in MCF 10A cells treated with control or miR-455-3p mimics, with or without TGF-β1 stimulation. E, MCF 10A cells were treated with control, miR-455-3p mimics, DMSO, or SB-431542 (MedChemExpress) with TGF-β1 (5 ng/ml) stimulation. Western blotting assays were performed to detect changes in the expression of epithelial and mesenchymal markers. F, MCF 10A cells were treated with miR-455-3p mimics or control with/without TGF-β1 (5 ng/ml) stimulation. Morphological alterations were observed by phase-contrast microscopy and based on F-actin staining. DAPI staining was used to detect nuclei (blue) and rhodamine-conjugated phalloidin was used for actin polymers (red). G, qPCR analysis of changes in the expression of epithelial and mesenchymal markers in MCF 10A cells treated with miR-455-3p mimics or control, with/without TGF-β1 stimulation. H, Western blot analysis of changes in the expression of indicated proteins in MCF 10A cells treated with miR-455-3p mimics or control, with/without TGF-β1 (5 ng/ml) stimulation. I, qPCR and Western blotting were performed to examine the expression levels of epithelial or mesenchymal markers in MCF-7 cells overexpressing Smad2 or Smad3. J, expression of the indicated epithelial or mesenchymal markers was measured by qPCR (left) or Western blotting (right) in TGF-β1–treated MCF 10A cells with Smad2 or Smad3 depletion. NC, negative control. Error bars (B, D, G, I, and J), S.D. of three independent experiments (*, p < 0.05; **, p < 0.01; ***, p < 0.001, two-tailed unpaired t test).
Figure 7.
Figure 7.
Reciprocal Regulation of the ZEB1/NuRD complex and miR-455-3p. A, the online analysis tool JASPAR was used to predict the potential binding sites of ZEB1 in the promoter region (−2050 to +500) of MIR455. B, association between ZEB1 and NuRD complex members including Mi-2, MTA1, MTA2, MTA3, HDAC1, HDAC2, RbAp46/48, and MBD2/3 in MDA-MB-231, MCF-7, and T-47D cells. Whole cell lysates were immunoprecipitated (IP) with an antibody against ZEB1, and immunocomplexes were immunoblotted (IB) using an antibody against subunits of the NuRD complex as indicated. C, GST pulldown assays with GST-fused ZEB1 and in vitro transcribed/translated components of the NuRD complex, as indicated. D, qChIP-based promoter-walk in MDA-MB-231 cells to map ZEB1, MTA1, and HDAC2 enrichment to two regions of the MIR455 promoter. Error bars, S.D. of three independent experiments (*, p < 0.05; **, p < 0.01, two-tailed unpaired t test). E, ZEB1, MTA1, and HDAC2 complexes were found to exist in the same protein complex at the #4 (left) and #7 (right) regions of the MIR455 promoter. ChIP and re-ChIP experiments were performed in MDA-MB-231 cells with the indicated antibodies. F, luciferase activities were measured in MCF-7 and MDA-MB-231 cells to examine the effect of ZEB1, MTA1, and HDAC2 on the transcriptional activity of the MIR455 promoter. Firefly luciferase activities were normalized to Renilla luciferase activities and plotted relative to control levels (top). The expression of the miR-455-3p was measured by qPCR in MCF-7 cells overexpressing ZEB1, MTA1, or HDAC2 and MDA-MB-231 cells with ZEB1, MTA1, or HDAC2 depletion (bottom). Error bars, S.D. of three independent experiments (*, p < 0.05; **, p < 0.01, two-tailed unpaired t test). G, graphic model as discussed under “Results.” A feedback loop between GATA3 and the ZEB1-nucleated repression program is involved in regulating the expression of miR-455-3p to control EMT and the metastasis of breast cancer cells.

Similar articles

Cited by

References

    1. Ko L. J., and Engel J. D. (1993) DNA-binding specificities of the GATA transcription factor family. Mol. Cell. Biol. 13, 4011–4022 10.1128/MCB.13.7.4011 - DOI - PMC - PubMed
    1. Merika M., and Orkin S. H. (1993) DNA-binding specificity of GATA family transcription factors. Mol. Cell. Biol. 13, 3999–4010 10.1128/MCB.13.7.3999 - DOI - PMC - PubMed
    1. Kouros-Mehr H., Bechis S. K., Slorach E. M., Littlepage L. E., Egeblad M., Ewald A. J., Pai S. Y., Ho I. C., and Werb Z. (2008) GATA-3 links tumor differentiation and dissemination in a luminal breast cancer model. Cancer Cell 13, 141–152 10.1016/j.ccr.2008.01.011 - DOI - PMC - PubMed
    1. Asselin-Labat M. L., Sutherland K. D., Barker H., Thomas R., Shackleton M., Forrest N. C., Hartley L., Robb L., Grosveld F. G., van der Wees J., Lindeman G. J., and Visvader J. E. (2007) Gata-3 is an essential regulator of mammary-gland morphogenesis and luminal-cell differentiation. Nat. Cell Biol. 9, 201–209 10.1038/ncb1530 - DOI - PubMed
    1. Usary J., Llaca V., Karaca G., Presswala S., Karaca M., He X., Langerød A., Kåresen R., Oh D. S., Dressler L. G., Lønning P. E., Strausberg R. L., Chanock S., Børresen-Dale A. L., and Perou C. M. (2004) Mutation of GATA3 in human breast tumors. Oncogene 23, 7669–7678 10.1038/sj.onc.1207966 - DOI - PubMed

Publication types

MeSH terms