. 2019 Oct;213(2):651-663.
doi: 10.1534/genetics.119.302419. Epub 2019 Sep 6.

Interpreting Coronary Artery Disease Risk Through Gene-Environment Interactions in Gene Regulation

Affiliations

Interpreting Coronary Artery Disease Risk Through Gene-Environment Interactions in Gene Regulation

Anthony S Findley et al. Genetics. 2019 Oct.

Abstract

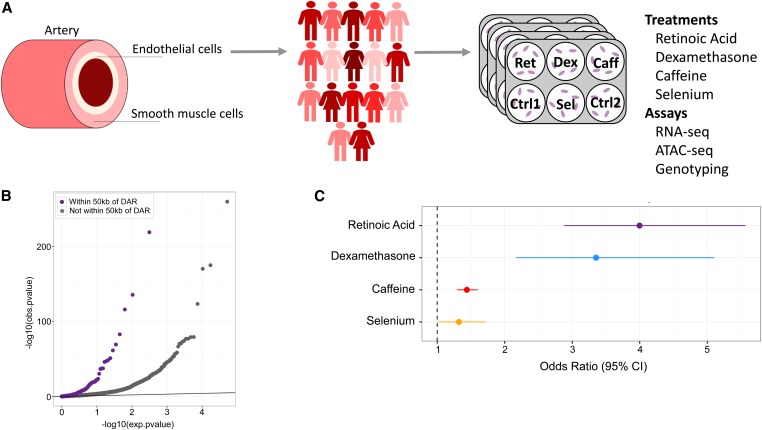
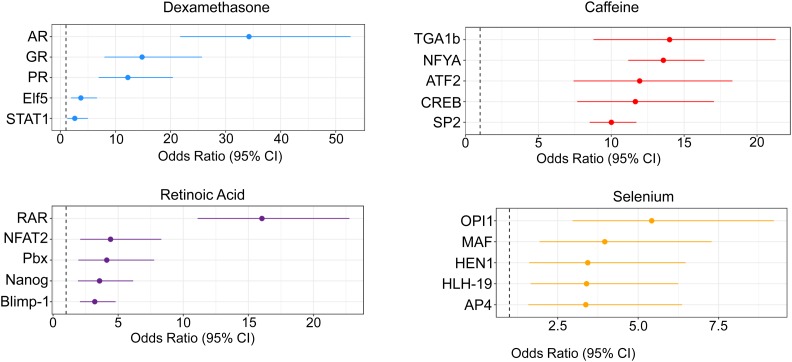
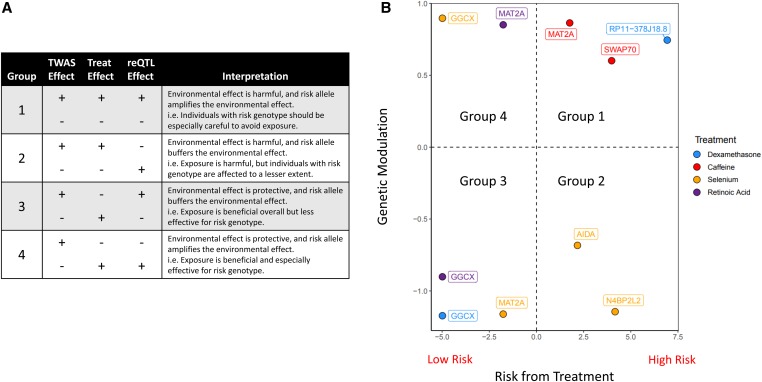
GWAS and eQTL studies identified thousands of genetic variants associated with complex traits and gene expression. Despite the important role of environmental exposures in complex traits, only a limited number of environmental factors were measured in these studies. Measuring molecular phenotypes in tightly controlled cellular environments provides a more tractable setting to study gene-environment interactions in the absence of other confounding variables. We performed RNA-seq and ATAC-seq in endothelial cells exposed to retinoic acid, dexamethasone, caffeine, and selenium to model genetic and environmental effects on gene regulation in the vascular endothelium-a common site of pathology in cardiovascular disease. We found that genes near regions of differentially accessible chromatin were more likely to be differentially expressed [OR = (3.41, 6.52), [Formula: see text]]. Furthermore, we confirmed that environment-specific changes in transcription factor binding are a key mechanism for cellular response to environmental stimuli. Single nucleotide polymorphisms (SNPs) in these transcription response factor footprints for dexamethasone, caffeine, and retinoic acid were enriched in GTEx eQTLs from artery tissues, indicating that these environmental conditions are latently present in GTEx samples. Additionally, SNPs in footprints for response factors in caffeine are enriched in colocalized eQTLs for coronary artery disease (CAD), suggesting a role for caffeine in CAD risk. By combining GWAS, eQTLs, and response genes, we annotated environmental components that can increase or decrease disease risk through changes in gene expression in 43 genes. Interestingly, each treatment may amplify or buffer genetic risk for CAD, depending on the particular SNP or gene considered.

Keywords: TWAS; gene expression response; gene regulation; genetic variation; transcription factor.


Figures

Figure 1
Figure 1
Changes in gene expression and chromatin accessibility in HUVECs treated with dexamethasone, retinoic acid, caffeine, and selenium. (A) Diagram of artery layers and study design. HUVECs were treated separately with four compounds and vehicle controls prior to RNA- and ATAC-seq (Materials and Methods). (B) QQ-plot of P-values from DESeq2 analysis of gene expression in response to retinoic acid. The purple dots represent genes within 50 kb of a DAR, while the gray dots represent genes not within 50 kb of a DAR. (C) Enrichment of DE genes within 50 kb of a DAR. Odds ratio was estimated using Fisher’s exact test, and for all treatments P<2.2×10¹⁶.
Figure 2
Figure 2
Shared DE genes and DARs across treatments. (A) DE gene sharing. Vertical bars indicate the number of genes differentially expressed in each group of treatments. Inset heatmap depicts the Spearman correlation of the logFC of all DE genes between treatments. (B) DAR sharing. Vertical bars indicate the number of DARs in each group of treatments. Inset heatmap depicts the Spearman correlation of the logFC of all DARs between treatments.
Figure 3
Figure 3
Identification of response factors. Topmost enriched transcription factor footprints in DARs in each condition. For selenium, the top factors are enriched in regions of closing chromatin. For all other treatments, the top factors are enriched in regions of opening chromatin.
Figure 4
Figure 4
Latent environments in GTEx and CAD risk. (A) Enrichment of GTEx eQTLs in SNPs within response factor footprints for each treatment. (B) Enrichment of coronary artery disease risk loci in SNPs within response factor footprints for each treatment. (C) For the genes shown in (D), number of concordant (treatment changes gene expression in the same direction as TWAS risk) and discordant (vice versa) gene/treatment pairs. (D) Comparison of logFC of gene expression vs. CAD TWAS z-score. A positive logFC indicates that the treatment increases gene expression. A positive TWAS value indicates that increased expression of the gene is associated with CAD risk.
Figure 5
Figure 5
reQTLs. (A) Boxplot depicting logFC for selenium reQTL for MAT2A (B) Same reQTL as in (A), but with trendlines representing gene expression in the treatment and control conditions. (C) All reQTLs. Colors indicate gene expression in the treatment condition (blue, dexamethasone; red, caffeine; orange, selenium; purple, caffeine; black, control).
Figure 6
Figure 6
reQTLs modulate environmental effects on complex traits. (A) Table relating TWAS, gene expression, and reQTL effects. (B) Risk associated with treatment vs. genetic modulation by reQTLs. The risk associated with treatment represents the TWAS effect multiplied by the sign of the logFC of the treatment. Positive values indicate that the treatment amplifies CAD risk. Genetic modulation represents the reQTL effect multiplied by the sign of the logFC of the treatment. Positive values indicate that the risk allele amplifies the treatment effect.

References

    1. 1000 Genomes Project Consortium, Auton, A., L. D. Brooks, R. M. Durbin, E. P. Garrison, et al., 2015. A global reference for human genetic variation. Nature 526: 68–74. 10.1038/nature15393 - DOI - PMC - PubMed
    1. Aguet, F., K. G. Ardlie, B. B. Cummings, E. T. Gelfand, G. Getz et al., 2017. Genetic effects on gene expression across human tissues. Nature 550: 204–213 [corrigenda: Nature 553: 530 (2018)]. 10.1038/nature24277 - DOI - PMC - PubMed
    1. Alasoo, K., J. Rodrigues, S. Mukhopadhyay, A. J. Knights, A. L. Mann et al., 2018. Shared genetic effects on chromatin and gene expression indicate a role for enhancer priming in immune response. Nat. Genet. 50: 424–431. 10.1038/s41588-018-0046-7 - DOI - PMC - PubMed
    1. Barbeira, A. N., S. P. Dickinson, R. Bonazzola, J. Zheng, H. E. Wheeler et al., 2018. Exploring the phenotypic consequences of tissue specific gene expression variation inferred from GWAS summary statistics. Nat. Commun. 9: 1825 10.1038/s41467-018-03621-1 - DOI - PMC - PubMed
    1. Benjamini, Y., and Y. Hochberg, 1995. Controlling the false discovery rate: a practical and powerful approach to multiple testing. J. R. Stat. Soc. B 57: 289–300.

Publication types