. 2019 Nov 4;216(11):2669-2687.
doi: 10.1084/jem.20180371. Epub 2019 Sep 6.

Cytosolic PCNA interacts with p47phox and controls NADPH oxidase NOX2 activation in neutrophils

Affiliations

Cytosolic PCNA interacts with p47phox and controls NADPH oxidase NOX2 activation in neutrophils

Delphine Ohayon et al. J Exp Med. .

Erratum in

  • Correction: Cytosolic PCNA interacts with p47phox and controls NADPH oxidase NOX2 activation in neutrophils.
    Ohayon D, De Chiara A, My-Chan Dang P, Thieblemont N, Chatfield S, Marzaioli V, Burgener SS, Mocek J, Candalh C, Pintard C, Tacnet-Delorme P, Renault G, Lagoutte I, Favier M, Walker F, Hurtado-Nedelec M, Desplancq D, Weiss E, Benarafa C, Housset D, Marie JC, Frachet P, El-Benna J, Witko-Sarsat V. Ohayon D, et al. J Exp Med. 2019 Dec 2;216(12):2900. doi: 10.1084/jem.2018037111082019c. Epub 2019 Nov 15. J Exp Med. 2019. PMID: 31732507 Free PMC article. No abstract available.

Abstract

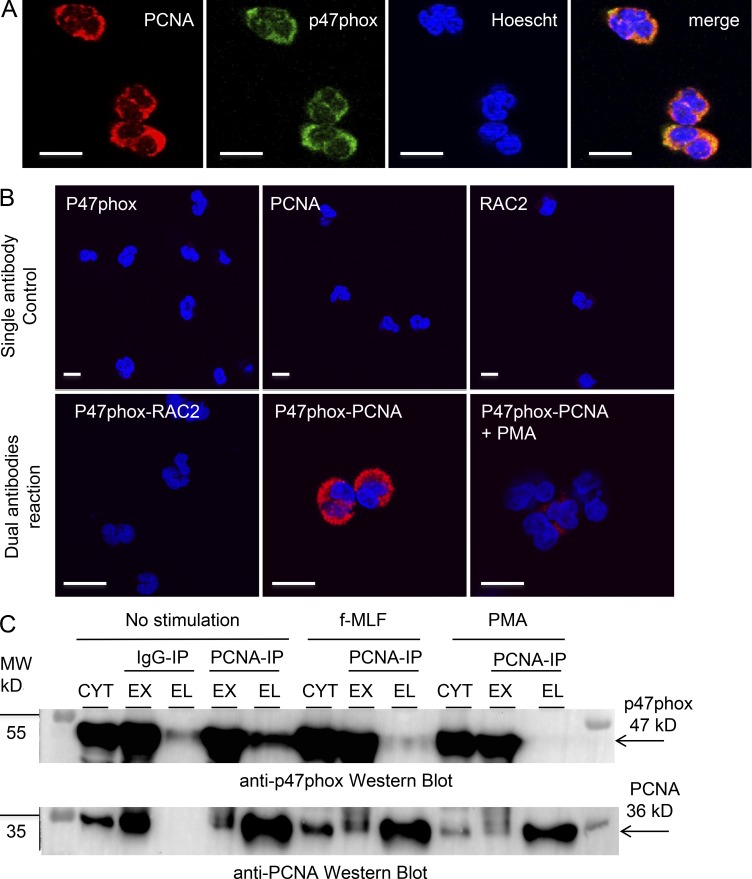
Neutrophils produce high levels of reactive oxygen species (ROS) by NADPH oxidase that are crucial for host defense but can lead to tissue injury when produced in excess. We previously described that proliferating cell nuclear antigen (PCNA), a nuclear scaffolding protein pivotal in DNA synthesis, controls neutrophil survival through its cytosolic association with procaspases. We herein showed that PCNA associated with p47phox, a key subunit of NADPH oxidase, and that this association regulated ROS production. Surface plasmon resonance and crystallography techniques demonstrated that the interdomain-connecting loop of PCNA interacted directly with the phox homology (PX) domain of the p47phox. PCNA inhibition by competing peptides or by T2AA, a small-molecule PCNA inhibitor, decreased NADPH oxidase activation in vitro. Furthermore, T2AA provided a therapeutic benefit in mice during trinitro-benzene-sulfonic acid (TNBS)-induced colitis by decreasing oxidative stress, accelerating mucosal repair, and promoting the resolution of inflammation. Our data suggest that targeting PCNA in inflammatory neutrophils holds promise as a multifaceted antiinflammatory strategy.


Figures

None
Graphical abstract
Figure 1.
Figure 1.
Molecular investigation of the binding between p47phox and PCNA. (A) SPR analysis of the interaction of p47phox (nanomoles) over immobilized PCNA. Arrows and stars indicate the injection start and end points for each p47phox concentration. Fit obtained with a statistic χ2 value 0.24 is shown as dotted line (response units). (B) The phosphoinositide PIP3,4,5 inhibits p47phox–PCNA interaction. P47phox was incubated with PIP3,4,5 at various concentrations before injection on PCNA. Binding was expressed as percentage of p47phox binding measured without PIP3,4,5. (C) SPR measurements of p47phox PX domain interaction on PCNA. Data represent overlays of sensograms resulting from injection of p47phox-PX domain at different concentrations (micromoles). Fits with a statistic χ2 value 1.5 are shown as dotted lines (response units). (D) Putative PIP-box localization within the p47phox PX domain, shown in purple. PIP-boxes 46–67, 63–90, 83–110, and 106–127 are depicted in green, blue, yellow, and red, respectively. The helix turn structurally similar to p21 PIP-box is depicted in silver. (E) Comparative binding of p21, p47phox-46-67, p47phox-63-90, p47phox-83-110, and p47phox-106-127 peptides on PCNA. (F) P21 peptide and p47phox-106-127 interfere with p47phox–PCNA association measured by SPR. The p21 peptides and p47phox-106-127 at various concentrations were coinjected with p47phox over PCNA as in B. Results are expressed as the percentage of p47phox binding measured without competing peptide. SPR experiments were performed three times with identical results on either a Biacore 3000 (C–E) or a Biacore T200 (A and B) apparatus. Kinetic values determinations for p47/PCNA and p47-PX domain/PCNA interactions are reported in Table 2.
Figure 2.
Figure 2.
Electron density map of PCNA crystals associated with the p47phox-106-127 peptide and molecular modeling of the complex PCNA-p47phox PX domain. (A) Diffraction pattern of PCNA crystals soaked in p47phox-106-127 peptide solution and snapshot of the frozen crystal. This experiment was performed three times with identical results. (B) Residual (FobsFcalc) electron density map from 3.23-Å-resolution crystallographic data. The three highest peaks of the residual (FobsFcalc) electron density map (green) are located where PIP-box–containing peptides interact with PCNA. The p21-139-160 peptide from PCNA-p21-139-160 peptide complex structure (PDB entry 1AXC) in cyan with the four main residues of the PIP-box highlighted in red. (C and D) Two putative models of PCNA-p47phox-PX domain complex based on the crystal structures of human PCNA (blue) the structure of p21-139-160 peptide (cyan) bound to PCNA and the p47phox PX domain (purple) with the residues 106–127 (gold). Predicted PIP-box residues are depicted in red. (C) Model based on the putative PIP-box of the p47phox-106-127 peptide whose conformation has been modified to fit the p21 peptide structure. (D) Model based on the structural homology between the helix turn of p47phox-122-126 and of the p21-PIP-box.
Figure 3.
Figure 3.
PCNA controls ROS production in differentiated PLB985 cells. (A) Representative experiment out of 10 showing the detection of cytosolic PCNA by immunofluorescence in DMF-differentiated PLB985 cells. The scale bars correspond to 10 µm, magnification 63×. (B) Kinetic analysis of luminol-CL in DMF-differentiated PLB985 cells transfected with a control (pCT) or with a PCNA-coding plasmid stimulated or not (resting) with PMA or OZ. (C) CL peaks corresponding to B were expressed as mean ± SEM of four independent experiments performed in duplicate. (D) FACS plots of DCF-mediated fluorescence in PLB985-overexpressing PCNA or a nuclear form of PCNA (PCNA-NLS) versus control (pCT). Representative experiment before (–) and after (+) PMA out of four sets of independent experiments. (E) Quantification of DCF-MFI. Data are mean ± SEM (n = 10 for PCNA WT and CT, n = 4 for PCNA NLS). (F–H) Effect of PCNA siRNA on NADPH oxidase activation. (F) Western blot analysis of PCNA and actin expression after siRNA-PCNA treatment compared with siRNA-CT (upper panels) and quantification of PCNA/β-actin ratio expressed as mean ± SEM of four independent experiments performed in duplicate (lower panel). **, P < 0.01, Mann–Whitney U test. (G) Kinetic analysis of luminol-CL of DMF-differentiated PLB985 cells stimulated with PMA or OZ compared with resting. (H) CL peaks corresponding to G expressed as mean ± SEM of four independent experiments performed in duplicate. (I–K) Effect of p21/Waf1 expression on NADPH oxidase activation. (I) Western blot analysis of p21/waf1, PCNA, and actin expression (upper panel) and quantification of PCNA/β-actin ratio expressed as mean ± SEM of three independent experiments performed in duplicate (lower panel). *, P < 0.01, Mann–Whitney U test. (J) Kinetic analysis of luminol-CL of DMF-differentiated PLB985 cells transfected with a p21/waf1-coding plasmid or a control plasmid (pCT) and stimulated with PMA or OZ. (K) CL peaks corresponding to J expressed as mean ± SEM of eight independent experiments performed in duplicate. ANOVA test was performed (C, E, H, and K): *, P < 0.05; **, P < 0.01; ***, P < 0.001.
Figure 4.
Figure 4.
Inhibition of NADPH oxidase activation by targeting the interdomain-connecting loop of PCNA. (A–C) Effect of PCNA inhibitors on NADPH oxidase activation in a cell-free system. (A) Typical experiment representative of three independent experiments performed in different blood donors showing superoxide anion production by cytosols and membranes purified from human neutrophils and stimulated by the addition of Li-SDS (S). No superoxide anion was observed in resting (R) or in the presence of SOD or DPI. Results are expressed as nanomoles of O2/min/7 × 106 cell membrane equivalent. (B and C) Effect of p21-peptide (B) or T2AA (C) on superoxide anion production in the cell-free system described in A. Results are ratio of superoxide anion production to untreated positive control. Data are mean ± SEM for p21-peptide (n = 3; *, P < 0.05, paired Student’s t test) and for T2AA (n = 2). (D) Inhibitory effect of T2AA on NADPH oxidase activation in neutrophils stimulated with PMA (n = 4), f-MLF (n = 7), or OZ (n = 10). NADPH oxidase activation was evaluated by luminol-CL expressed as ratio to the untreated stimulated cells. The data are mean ± SEM of the indicated number of independent experiments performed in duplicate (*, P < 0.05; **, P < 0.01; ***, P < 0.001, ANOVA). (E and F) Representative kinetic analysis of luminol-CL in neutrophils stimulated with f-MLF (E) or PMA (F) compared with resting in the presence or absence of T2AA (1–10 µM). (G) Effect of T2AA on membrane translocation of PCNA and p47phox. Neutrophils pretreated with or without T2AA for 1 h were stimulated with PMA. Proteins (PCNA, p47phox, phospho-p47phox, and p22phox) contained in the membrane (memb) or the cytosolic (cyto) fractions were analyzed by Western blot. This experiment is representative of three independent experiments performed in different blood donors yielding the same results.
Figure 5.
Figure 5.
Colocalization and coimmunoprecipitation of PCNA and p47phox in human neutrophils. (A) Colocalization of PCNA and p47phox shown by indirect immunofluorescence using a polyclonal rabbit anti-PCNA and a mAb anti-p47phox, respectively. (B) Colocalization of PCNA and p47phox using the Duolink technology. The upper panels show negative controls using a single antibody. The lower panels show the fluorescence in the presence of two antibodies: p47phox and rac2; p47phox and PCNA in the absence or in the presence of PMA. Hoechst was used for nuclear staining. A and B show representative experiments of three yielding the same results. Fluorescence was analyzed by confocal microscopy. In A and B, the scale bars correspond to 10 µm, magnification 63×. (C) Western blot analysis of coimmunoprecipitation between PCNA and p47phox in cytosol (CYT) of neutrophils without stimulation or after activation with f-MLF or PMA. Unbound material in the exclusion fraction (EX) and bound immunoprecipitated proteins recovered in the elution fraction (EL) were analyzed by Western blot analysis as described in Materials and methods. This experiment is representative of three independent experiments performed in different blood donors yielding the same results. MW, molecular weight.
Figure 6.
Figure 6.
Destabilization of PCNA scaffold inhibits NADPH oxidase activity in vivo. (A–C) FACS analysis of cells in the peritoneal lavage 4 h after zymosan injection in mice treated with or without T2AA. Two independent sets of experiments were performed with a total of eight mice per group. (A) Total cell count. (B) Number of macrophages (F4/80+). (C) Number of neutrophils (Ly6G+). (D) Effect of T2AA on ex vivo neutrophil NADPH oxidase activity measured by luminol-CL in peritoneal neutrophils stimulated or not with PMA. The data are CL peaks expressed as mean ± SEM (n = 8). **, P < 0.01, ANOVA. (E and F) Inhibitory effect of T2AA on in vivo ROS production evaluated by L012-CL during zymosan-induced peritonitis. (E) Representative imaging of ROS production in individual mice. The pseudocolor heat maps represent photons/s/cm2/steradian. (F) Quantification of in vivo L012-CL in mice. The data are CL peaks expressed as mean ± SEM from five to six mice per group in two independent experiments; *, P < 0.05; ***, P < 0.001, ANOVA. (G and H) Ex vivo neutrophil NADPH oxidase activity measured by luminol-CL in neutrophils from WT or p21−/− mice isolated from the peritoneal lavage 4 h after zymosan injection stimulated or not with PMA (as in D). (G) Representative kinetic analysis of NADPH oxidase activation in neutrophils from WT compared with p21−/− mice. (H) The data are CL peaks expressed as mean ± SEM (from six mice per group in two independent experiments; *, P < 0.05, ANOVA).
Figure 7.
Figure 7.
Antiinflammatory effect of T2AA on TNBS-induced colitis. (A and B) Macroscopic changes following TNBS treatment are represented by colon weight/length ratio (A) and Wallace score (B) in the respective histograms. (C) Ameho score representative of histological lesions is shown in the histogram. The data (A–C) are mean ± SEM (**, P < 0.01; ***, P < 0.001, ANOVA) from six to eight mice per group in two independent experiments. (D) Photomicrographs are representative of H&E-stained slides (upper panels) and of MPO immunohistochemical labeling (lower panels) of paraffin-embedded colonic tissues recovered from controls, TNBS alone, and TNBS and T2AA. The scale bars correspond to 20 µm, magnification 200×. RG, regeneration; RE, reepithelization. (E) Colorimetric measurement of MDA in colon. The data are mean ± SEM (n = 6); **, P < 0.01, ANOVA. (F and G) Inhibitory effect of T2AA on in vivo ROS production measured by L012-CL in TNBS-induced colitis mice. (F) Representative imaging of ROS production in individual mice with untreated TNBS-induced colitis (right panel) or T2AA-treated TNBS-induced colitis (left panel). This representative experiment shows the pseudocolor heat map representing photons/s/cm2/steradian. (G) Quantification of in vivo L012-CL from three to four mice per group using the percentages of L012-CL variation between 24 and 48 h. The data are expressed as mean ± SEM (*, P < 0.05, nonparametric Wilcoxon test).
Figure 8.
Figure 8.
Absence of T2AA antiinflammatory effect in TNBS-induced colitis following neutrophil depletion. (A) Experimental protocol of colitis after neutrophil depletion using anti-Ly6G mAb. (B and C) Flow cytometry quantification of neutrophils in blood (left panel) and in bone marrow (right panel) in control (IgG) and neutrophil-depleted (Ly6G) mice. (C) Macroscopic changes following TNBS treatment measured by Wallace score. The data are mean ± SEM (ANOVA). (D) Representative photomicrographs of neutrophil immunostaining of colonic tissues with the neutrophil marker recovered from control (IgG) and neutrophil-depleted mice (Ly6G) treated with TNBS alone or TNBS combined with T2AA. The scale bars correspond to 20 µm, magnification 200×. (E) Quantification of neutrophil immunostaining as described in Materials and methods. In B, C, and E, the data are mean ± SEM. Two independent sets of experiments were performed with a total of eight mice per group. *, P < 0.05; **, P < 0.01; ***, P < 0.001, ANOVA.

Similar articles

Cited by

References

    1. ’t Hart B.A., Simons J.M., Knaan-Shanzer S., Bakker N.P., and Labadie R.P.. 1990. Antiarthritic activity of the newly developed neutrophil oxidative burst antagonist apocynin. Free Radic. Biol. Med. 9:127–131. 10.1016/0891-5849(90)90115-Y - DOI - PubMed
    1. Ameho C.K., Adjei A.A., Harrison E.K., Takeshita K., Morioka T., Arakaki Y., Ito E., Suzuki I., Kulkarni A.D., Kawajiri A., and Yamamoto S.. 1997. Prophylactic effect of dietary glutamine supplementation on interleukin 8 and tumour necrosis factor alpha production in trinitrobenzene sulphonic acid induced colitis. Gut. 41:487–493. 10.1136/gut.41.4.487 - DOI - PMC - PubMed
    1. Baillet A., Hograindleur M.A., El Benna J., Grichine A., Berthier S., Morel F., and Paclet M.H.. 2017. Unexpected function of the phagocyte NADPH oxidase in supporting hyperglycolysis in stimulated neutrophils: key role of 6-phosphofructo-2-kinase. FASEB J. 31:663–673. 10.1096/fj.201600720R - DOI - PubMed
    1. Boehm E.M., and Washington M.T.. 2016. R.I.P. to the PIP: PCNA-binding motif no longer considered specific: PIP motifs and other related sequences are not distinct entities and can bind multiple proteins involved in genome maintenance. BioEssays. 38:1117–1122. 10.1002/bies.201600116 - DOI - PMC - PubMed
    1. Borregaard N., Heiple J.M., Simons E.R., and Clark R.A.. 1983. Subcellular localization of the b-cytochrome component of the human neutrophil microbicidal oxidase: translocation during activation. J. Cell Biol. 97:52–61. 10.1083/jcb.97.1.52 - DOI - PMC - PubMed

Publication types

MeSH terms