. 2019 Sep 24;116(39):19513-19522.
doi: 10.1073/pnas.1903976116. Epub 2019 Sep 6.

An ensemble of cryo-EM structures of TRiC reveal its conformational landscape and subunit specificity

Affiliations

An ensemble of cryo-EM structures of TRiC reveal its conformational landscape and subunit specificity

Mingliang Jin et al. Proc Natl Acad Sci U S A. .

Abstract

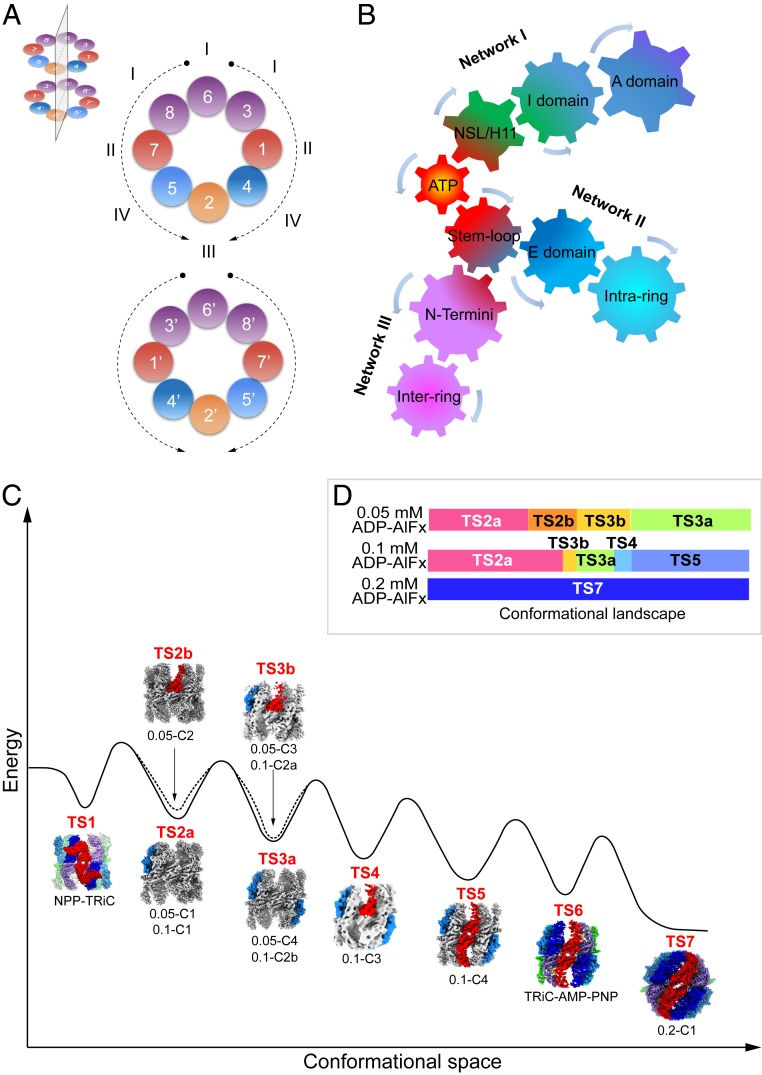
TRiC/CCT assists the folding of ∼10% of cytosolic proteins through an ATP-driven conformational cycle and is essential in maintaining protein homeostasis. Here, we determined an ensemble of cryo-electron microscopy (cryo-EM) structures of yeast TRiC at various nucleotide concentrations, with 4 open-state maps resolved at near-atomic resolutions, and a closed-state map at atomic resolution, revealing an extra layer of an unforeseen N-terminal allosteric network. We found that, during TRiC ring closure, the CCT7 subunit moves first, responding to nucleotide binding; CCT4 is the last to bind ATP, serving as an ATP sensor; and CCT8 remains ADP-bound and is hardly involved in the ATPase-cycle in our experimental conditions; overall, yeast TRiC consumes nucleotide in a 2-ring positively coordinated manner. Our results depict a thorough picture of the TRiC conformational landscape and its allosteric transitions from the open to closed states in more structural detail and offer insights into TRiC subunit specificity in ATP consumption and ring closure, and potentially in substrate processing.

Keywords: ATPase cycle; allosteric network; chaperonin TRiC/CCT; conformational landscape; cryo-EM.


Conflict of interest statement

The authors declare no conflict of interest.

Figures

Fig. 1.
Fig. 1.
An ensemble of cryo-EM maps of TRiC in the presence of 0.05 mM ADP-AlFx, and the corresponding nucleotide statuses. (AD) Four cryo-EM maps of TRiC in distinct open conformations in the presence of 0.05 mM ADP-AlFx, with these conformational states denoted as 0.05-C1 (A), 0.05-C2 (B), 0.05-C3 (C), and 0.05-C4 (D). The cryo-EM map of NPP-TRiC (EMDB: 9540) is also shown in the small Upper Inset of A (different subunits in distinct colors and labeled). A side view (Left) and 2 end-on views (Middle and Right) are shown for each state. The CCT7 and CCT2 subunits displaying observable conformational changes (in one ring or both rings) compared with NPP-TRiC are colored dodger blue and red, respectively. (EH) Nucleotide occupancy statuses of the 4 maps. Both rings of 0.05-C1 (E), 0.05-C2 (F), 0.05-C3 (G), and 0.05-C4 (H) are shown here. Shown are a slice of the model near the nucleotide pocket region and the nucleotide densities (in red). These rendering styles were followed throughout.
Fig. 2.
Fig. 2.
TRiC shows sequential allosteric cooperativity in the presence of 0.1 mM ADP-AlFx. (AE) Five cryo-EM maps of TRiC at distinct open conformations in the presence of 0.1 mM ADP-AlFx, denoted as 0.1-C1 (A), 0.1-C2a (B), 0.1-C2b (C), 0.1-C3 (D), and 0.1-C4 (E). The CCT7 and CCT2 subunits, displaying observable conformational changes compared with NPP-TRiC, are colored dodger blue and red, respectively. Based on the number of subunits showing conformational changes, we classified the maps into 4 stages. (F and G) Nucleotide occupancy statuses of the relatively better resolved 0.1-C1 (F) and 0.1-C4 (G) maps. In 0.1-C4, only CCT4 in both rings remained completely unoccupied. (H) Visualization of the CCT4 nucleotide pocket region of the 0.1-C4 map (gold surface). Neither density for the β-hairpin motif (indicated by a red dashed line) nor for nucleotide (indicated by a black dashed line) was observed in the 0.1-C4 map. The model is in medium purple, and the nucleotide is rendered as ball-and-stick. We borrowed the model from the 0.2-C1 state (presented later), which has this portion of the map very well resolved, and both structures share overall similar conformation in the CCT4 nucleotide pocket region.
Fig. 3.
Fig. 3.
Cryo-EM maps of TRiC in the both-rings-tightly-closed conformation. (A) The atomic-resolution cryo-EM map of TRiC in the presence of 0.2 mM ADP-AlFx (0.2-C1). An end-on view (with individual subunits labeled) and 2 side views are shown. The color scheme is followed throughout. (B) Pseudoatomic model of 0.2-C1 (ribbon). (C and D) The cryo-EM maps of TRiC in the presence of 0.2 mM ATP (0.2-ATP, C) and 0.5 mM ADP-AlFx (0.5-C1, D), respectively. Both maps are in the both-rings-tightly-closed conformation similar to that of 0.2-C1.
Fig. 4.
Fig. 4.
CCT8 remains in the ADP state, distinct from all of the other subunits in the 0.2-C1 TRiC structure. (A) Portions of the 0.2-C1 map in the nucleotide pocket region showing all of the subunits, except CCT8, bound with ADP-AlFx (stick model) and a magnesium ion (green ball), as well as a water molecule (red ball) in an attacking position, suggesting that these subunits are in the ATP-hydrolysis transition state. However, CCT8 remains bound to ADP, without AlFx or the attacking water molecule, indicating that this subunit is still in the ADP state. The TRiC subunits here are shown following their sequential order within a ring as visualized from the top of the complex. (B) NADH coupled enzymatic assays revealed a lower ATPase activity of the CCT8 monomer than those of the CCT5 monomer and WT TRiC. The ATPase rates (denoted by velocity [V], with the unit of “mole ATP/[mole TRiC • min]”) determined by fitting the liner part of the ATP hydrolysis reaction curve are also provided. The significant difference analysis (Right) also suggests that the CCT8 monomer shows a significantly lower ATPase activity compared to the CCT5 monomer and TRiC complex, with the statistical significance ***P < 0.001 and ****P < 0.0001, respectively.
Fig. 5.
Fig. 5.
The N termini of TRiC subunits may play an essential role in intra- and inter-ring allosteric cooperativity. (A) The locations of the resolved N termini (in color) in the 0.2-C1 TRiC structure. The visualization angle and region are illustrated in the Inset. (B) Magnified view of the interaction between helix H1 of CCT3 and the N terminus of CCT6: specifically, its small 1-turn α-helix before its N-terminal β-sheet. (C) Magnified view of the resolved N-terminal extension of CCT5. (D) Magnified view of the CCT4 N terminus, observed to be bent and extended toward the outside of the ring. The image here is viewed from outside of the TRiC structure. (E) An inter-ring interacting network formed by the N termini of CCT7 and CCT8 from the cis-ring, and the N and C termini of CCT6′ and the stem loop of CCT3′ from the trans-ring. Shown is the model and the surface rendering of the model. The visualization angle and direction are indicated in the Inset. The CCT7 N-terminal tail extends around the E domain of the neighboring CCT8, and to contact the N terminus of the trans-ring CCT6′ (white dashed oval line). The N terminus of CCT8 bends across the interface between the 2 rings, to bundle together with the N and C termini of the trans-ring CCT6′ and to form a contact with the stem loop of the trans-ring CCT3′ (black dashed oval line). A magnified view of the hydrophobic interaction between the N termini of CCT7 and CCT8 is shown on the right. (F) The growth rates of the CCT4-NTD and CCT7-NTD yeast strains were measured to be lower than that of the WT TRiC strain (control). (G) Statistical analyses for doubling time were performed using a 1-way ANOVA, demonstrating the growth defect due to the truncations in the N-terminal tail of CCT4 and CCT7, respectively. The significant difference, ****P < 0.0001, was indicated.
Fig. 6.
Fig. 6.
Domain-wise conformational transitions of TRiC from open to closed states, revealing an asymmetric chamber closure mechanism of TRiC. (A) Decomposition of the conformational changes of CCT3 from open 0.1-C4 (gray) to closed 0.2-C1 (colored) state into 3 portions corresponding to the 3 domains. The A domain is shown in red, I domain in yellow, and E domain in sky blue. The rotation axis and angle for each domain are labeled. (B) Rotational angle summation of the 3 domains for each individual subunit, indicating an asymmetric chamber closure of TRiC. (C) Magnified view of the conformational transitions of the key structural elements in the nucleotide pocket of CCT3 from the open 0.1-C4 (gray) to the closed 0.2-C1 (colored) state. Locations of NSL, H11, stem loop, attacking water molecule, and key residues are shown in the Left. The depiction of the active site (Right) illustrates the attacking water nucleophile being held and polarized by hydrogen bonds to the side chains of Asp60 and Asp398, and Lys162 moving to a proximity position to sense the existence of the γ-phosphate (represented by the AlF3 group in our structure).
Fig. 7.
Fig. 7.
ATP consumption and allosteric regulation mechanisms of TRiC and the conformational landscape of TRiC during ring closure. (A) Ordering of TRiC subunit nucleotide binding. The 8 subunits of TRiC can be categorized into 4 classes, arranged symmetrically about a mirror plane located in the position illustrated in the Inset. (B) Diagram illustrating the proposed 3 sets of gears forming the allosteric networks of TRiC, from interactions within a subunit (Network I) to that of intra-ring (Network II) and inter-ring (Network III) allosteric networks. (C) Hypothetical energy landscape of TRiC, illustrating its conformational transitions during the ring closure process from TS1 to TS7 state. For TS2a, TS2b, TS3a, and TS3b, there are 2 maps in a similar conformation; thus, the names for both maps are listed underneath a representative better resolved map. (D) The conformational landscape of TRiC in the 0.05 mM, 0.1 mM, and 0.2 mM ADP-AlFx conditions.

Similar articles

Cited by

References

    1. Tam S., et al. , The chaperonin TRiC blocks a huntingtin sequence element that promotes the conformational switch to aggregation. Nat. Struct. Mol. Biol. 16, 1279–1285 (2009). - PMC - PubMed
    1. Khabirova E., et al. , The TRiC/CCT chaperone is implicated in Alzheimer’s disease based on patient GWAS and an RNAi screen in Aβ-expressing Caenorhabditis elegans. PLoS One 9, e102985 (2014). - PMC - PubMed
    1. Pereira J. H., et al. , Mechanism of nucleotide sensing in group II chaperonins. EMBO J. 31, 731–740 (2012). - PMC - PubMed
    1. Llorca O., et al. , Eukaryotic chaperonin CCT stabilizes actin and tubulin folding intermediates in open quasi-native conformations. EMBO J. 19, 5971–5979 (2000). - PMC - PubMed
    1. Llorca O., et al. , Eukaryotic type II chaperonin CCT interacts with actin through specific subunits. Nature 402, 693–696 (1999). - PubMed

Publication types

MeSH terms

LinkOut - more resources