. 2019 Sep 6;10(1):4053.
doi: 10.1038/s41467-019-12023-w.

Similarities and differences in patterns of germline mutation between mice and humans

Affiliations

Similarities and differences in patterns of germline mutation between mice and humans

Sarah J Lindsay et al. Nat Commun. .

Abstract

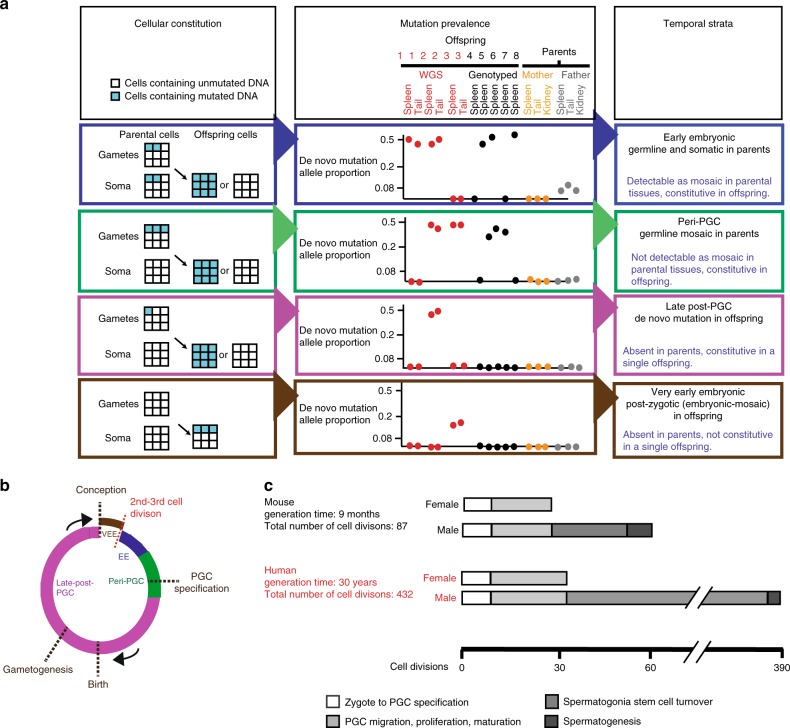
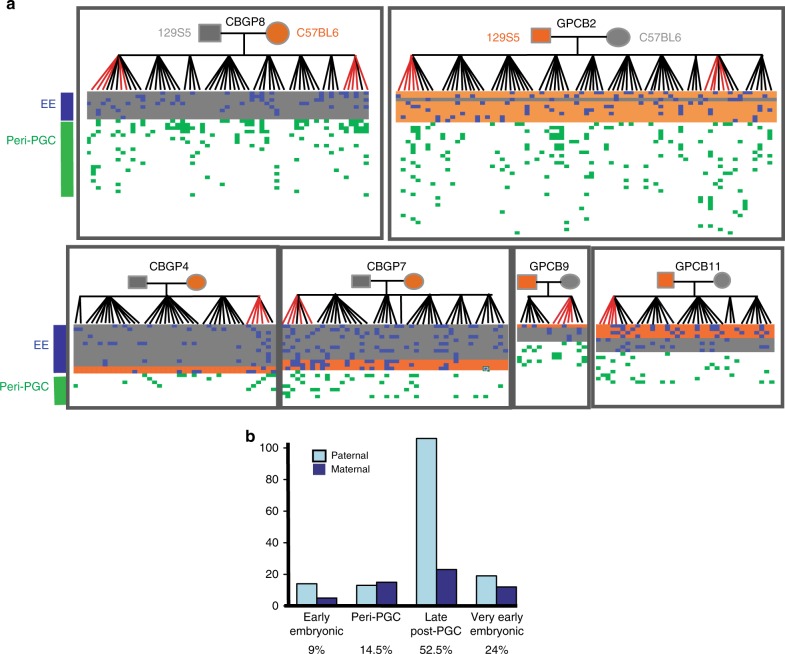
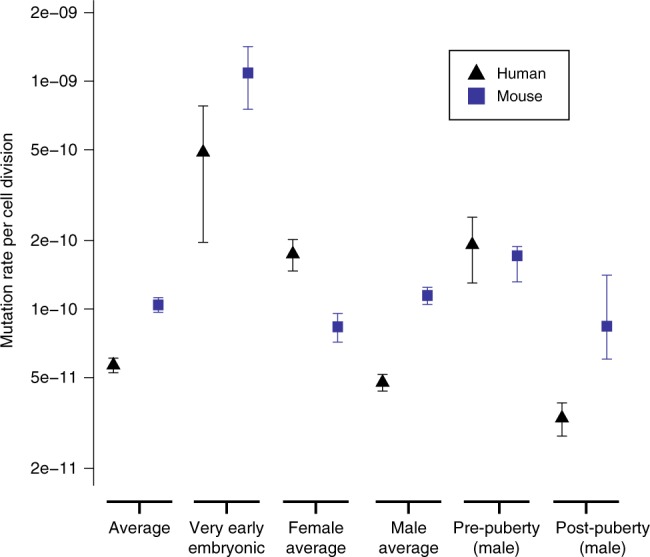
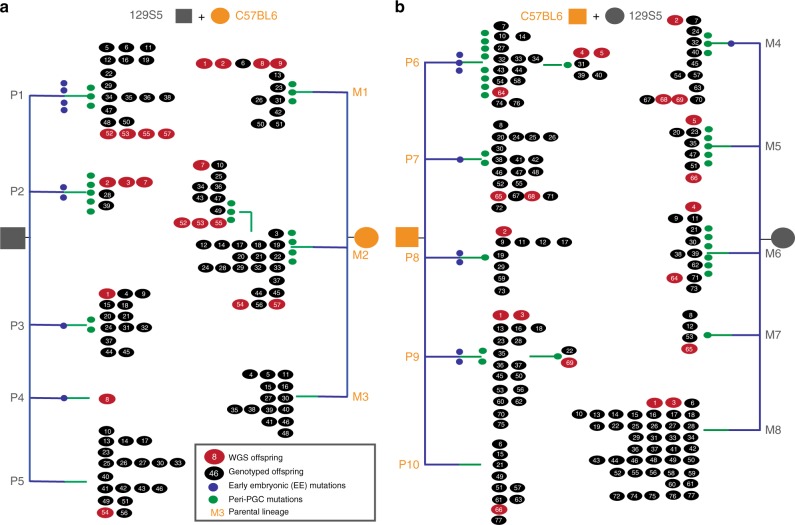
Whole genome sequencing (WGS) studies have estimated the human germline mutation rate per basepair per generation (~1.2 × 10⁻⁸) to be higher than in mice (3.5-5.4 × 10⁻⁹). In humans, most germline mutations are paternal in origin and numbers of mutations per offspring increase with paternal and maternal age. Here we estimate germline mutation rates and spectra in six multi-sibling mouse pedigrees and compare to three multi-sibling human pedigrees. In both species we observe a paternal mutation bias, a parental age effect, and a highly mutagenic first cell division contributing to the embryo. We also observe differences between species in mutation spectra, in mutation rates per cell division, and in the parental bias of mutations in early embryogenesis. These differences between species likely result from both species-specific differences in cellular genealogies of the germline, as well as biological differences within the same stage of embryogenesis or gametogenesis.


Conflict of interest statement

The authors declare no competing interests.

Figures

Fig. 1
Fig. 1
Mouse pedigree sequencing and genotyping strategy. Six reciprocal crosses were established and successively mated, generating six pedigrees comprising between 41 and 77 offspring. The pedigrees shown here only include the sequenced and genotyped individuals. Three tissues (spleen, kidney and tail) were collected from all mice. Whole-genome sequencing (WGS) was performed on spleen-derived DNA for five or ten pups within each pedigree (shown in red). Candidate DNMs were identified and validated using deeper targeted sequencing of 1–3 tissues per individual across the offspring shown. The naming conventions and differences between data collection and analysis are shown. Not all offspring from each pedigree were genotyped
Fig. 2
Fig. 2
Temporal strata of observed mutations. a (Left) Four classes of mutations distinguished by the proportion of cells carrying the mutation within parental and offspring tissues. Multiple tissues were used to verify consistency of VAF. (Middle) Illustrative examples of variant allele fraction observed among the sequenced samples for each class. (Right) Temporal strata to which these mutations are assigned. b Four temporal strata mapped onto the generational cycle of the germline: EE, peri-PGC and late post-PGC mutations were detected in parents, VEE mutations were detected in offspring. c Cell divisions occurring in the different stages of the mice and human germlines during an average generation
Fig. 3
Fig. 3
Timing of mutations in six mouse pedigrees. a Validated de novo mutations in six mouse pedigrees. Offspring are shown vertically, and DNMs are shown horizontally, coloured according to temporal strata. Early embryonic DNMs are shaded according to the parental origin (grey/orange). Late post-PGC and VEE mutations are only observed in one individual and are listed in Supplementary Table 1 and Supplementary Data 1. b The number of DNMs assigned to the paternal or maternal haplotype (‘Methods’) in each temporal strata, with the total contribution of mutations in each strata to the overall rate shown at the bottom of the graph
Fig. 4
Fig. 4
Mutational spectra and paternal age effect of DNMs in mice. a Comparison of mutational spectra in mice and humans using a catalogue of compiled DNMs in humans. Error bars are 95% confidence intervals. Stars show significance (p < 0.05) after correction for multiple testing. The mouse data were derived from DNMs in 40 offspring from six pedigrees and the human data from 6570 DNMs from 109 trios. b Comparison of mutational spectra in VEE+EE mutations compared to peri-PGC+late post-PGC mutations in mice. Effect of parental age on number of DNMs in individuals before (c) and after (d) removal of VEE mutations arising in offspring. The size of the plotting symbol indicates the number of individuals sharing the same number of mutations. p Values indicate the significance of the regression coefficients. The grey shading indicates the confidence limits on the regression. The mouse DNMs were derived from 40 offspring in six pedigrees
Fig. 5
Fig. 5
Estimation of mutation rates per haploid base per cell division. Mean per-generation mutation rates for SNVs were calculated for mice and from humans using all the data from this study and Rahbari et al. and Kong et al.. The 95% confidence intervals were calculated assuming that DNMs are Poisson distributed, except for the pre- and post-puberty stages, which were derived from the linear models fitted for the paternal age effects, and VEE mutations, which assume quasi-Poisson distribution to allow for over-dispersion. See ‘Methods’ for further information. The accuracy of the estimates shown here (aside from VEE mutations) rely upon the proposed cellular demographies by Drost and Lee
Fig. 6
Fig. 6
Genealogies of maternal and paternal cell lineages delineated by early embryonic and peri-PGC mutations. Parental embryonic lineages reconstructed for each pedigree in the two largest pedigrees (CBGP8 (a) /GPCB2(b)), as paternal (P) or maternal (M), with each lineage numbered. Mutations delineating the lineages are colour-coded according to their temporal strata as listed in Supplementary Data 1. WGS and genotyped offspring are shown as red and black numbered circles, respectively. Offspring are numbered and ordered according to litter; for example, in lineage P2, individuals 2, 3 and 7 belong to the same litter, whereas numbers 28 and 39 arose in separate, later litters. Lineages P5, M3, M8 and P10 represent offspring without shared mutations and may contain several uncharacterised lineages. Minimal lineages for the four smaller pedigrees can be found in Supplementary Fig. 5

References

    1. Kong A, et al. Rate of de novo mutations and the importance of father’s age to disease risk. Nature. 2012;488:471–475. doi: 10.1038/nature11396. - DOI - PMC - PubMed
    1. Jónsson H, et al. Parental influence on human germline de novo mutations in 1,548 trios from Iceland. Nature. 2017;549:519–522. doi: 10.1038/nature24018. - DOI - PubMed
    1. Rahbari RR, et al. Timing, rates and spectra of human germline mutation. Nat. Genet. 2016;48:126–133. doi: 10.1038/ng.3469. - DOI - PMC - PubMed
    1. Goldmann JM, et al. Parent-of-origin-specific signatures of de novo mutations. Nat. Genet. 2016;8:935–939. doi: 10.1038/ng.3597. - DOI - PubMed
    1. Wong WS, et al. New observations on maternal age effect on germline de novo mutations. Nat. Commun. 2016;7:10486. doi: 10.1038/ncomms10486. - DOI - PMC - PubMed

Publication types