. 2019 Sep 6;10(1):4040.
doi: 10.1038/s41467-019-12064-1.

Typhoid toxin exhausts the RPA response to DNA replication stress driving senescence and Salmonella infection

Affiliations

Typhoid toxin exhausts the RPA response to DNA replication stress driving senescence and Salmonella infection

Angela E M Ibler et al. Nat Commun. .

Abstract

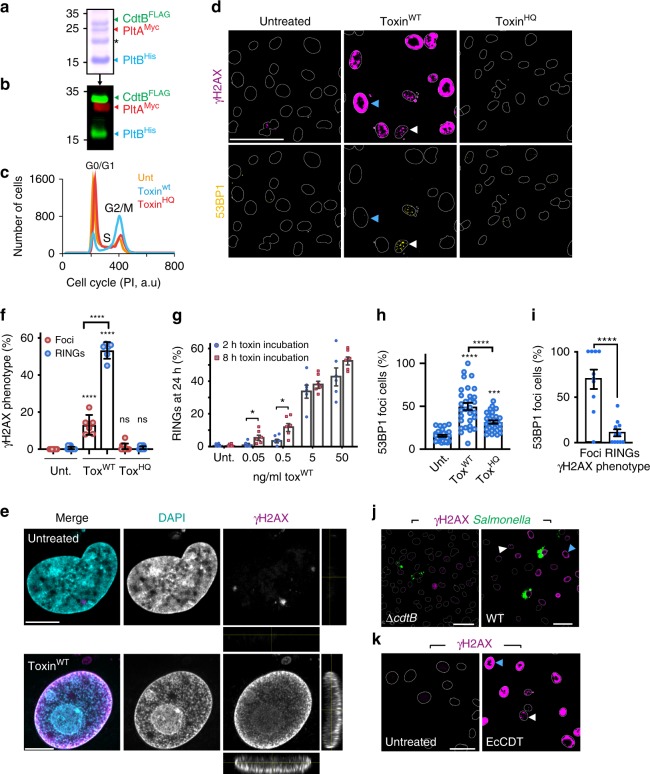
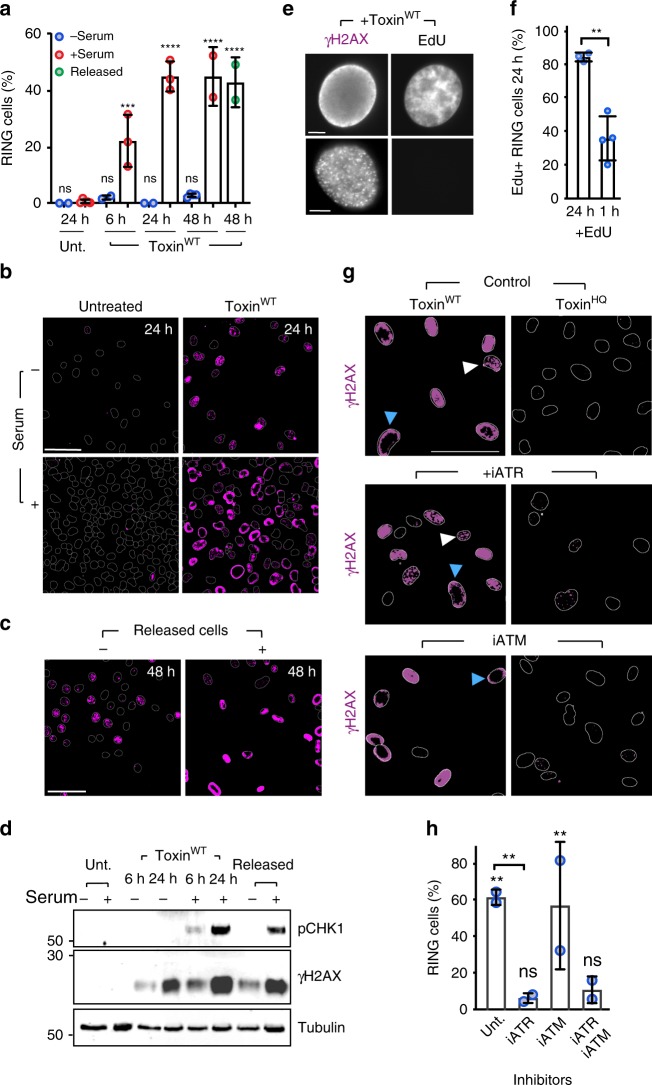
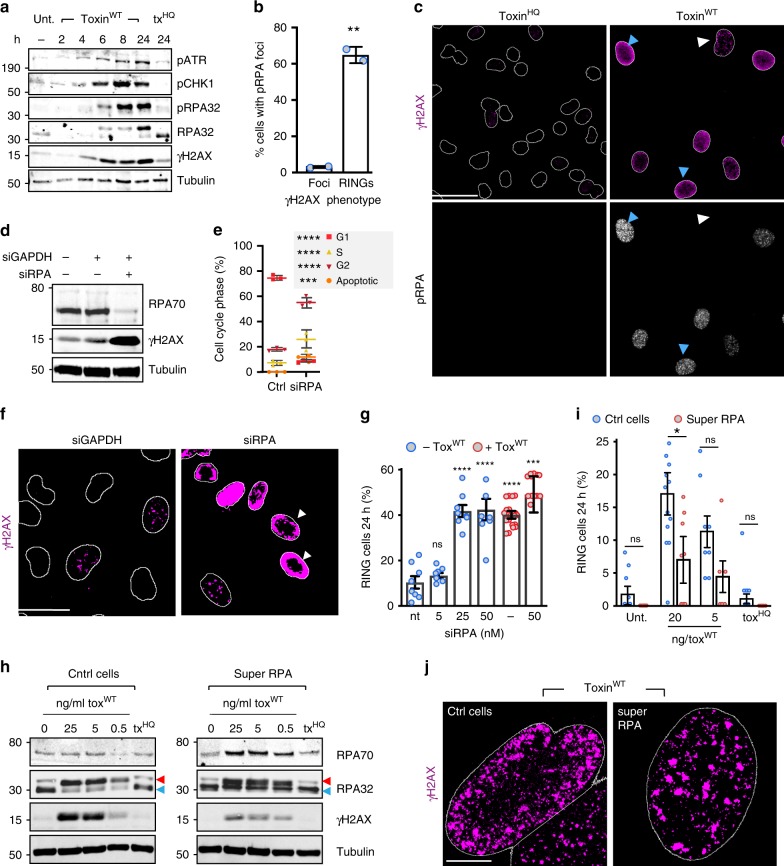
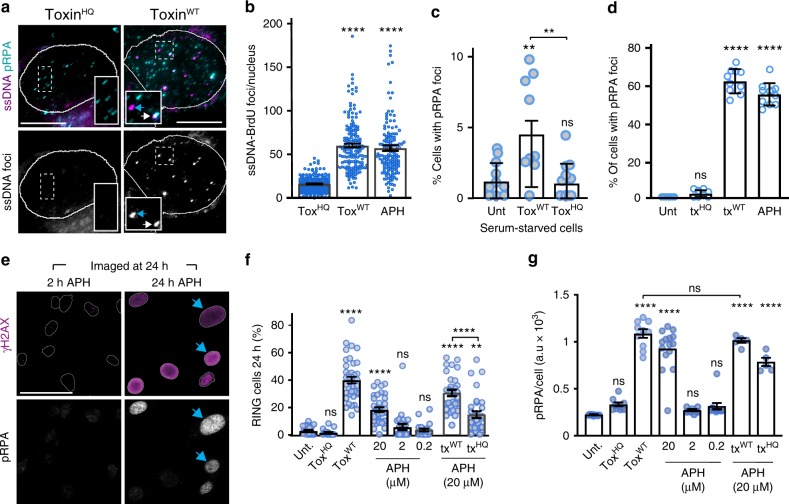
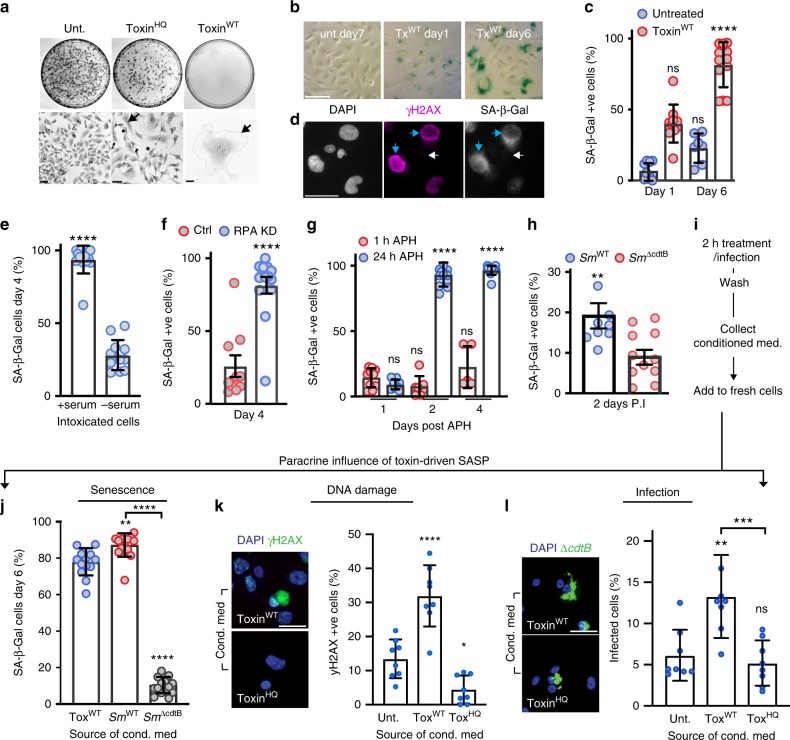
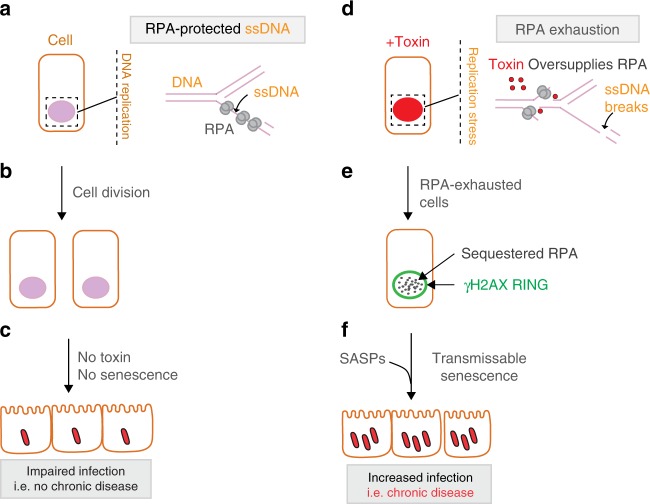
Salmonella Typhi activates the host DNA damage response through the typhoid toxin, facilitating typhoid symptoms and chronic infections. Here we reveal a non-canonical DNA damage response, which we call RING (response induced by a genotoxin), characterized by accumulation of phosphorylated histone H2AX (γH2AX) at the nuclear periphery. RING is the result of persistent DNA damage mediated by toxin nuclease activity and is characterized by hyperphosphorylation of RPA, a sensor of single-stranded DNA (ssDNA) and DNA replication stress. The toxin overloads the RPA pathway with ssDNA substrate, causing RPA exhaustion and senescence. Senescence is also induced by canonical γΗ2ΑΧ foci revealing distinct mechanisms. Senescence is transmitted to non-intoxicated bystander cells by an unidentified senescence-associated secreted factor that enhances Salmonella infections. Thus, our work uncovers a mechanism by which genotoxic Salmonella exhausts the RPA response by inducing ssDNA formation, driving host cell senescence and facilitating infection.


Conflict of interest statement

The authors declare no competing interests.

Figures

Fig. 1
Fig. 1
Non-canonical DNA damage response induced by a bacterial genotoxin. a Recombinant typhoid toxin comprising epitope-tagged CdtBFLAG, PltAMyc and PltBHis (asterisk marks E.coli contaminant). MW in kDa left. b Toxin immunoblotted with anti-FLAG (CdtBFLAG, green), -Myc (PltAMyc, red), or -His antibodies (PltBHis, green). MW in kDa left. HT1080s treated with 5 ng/ml wild-type toxin (toxinWT) or catalytically inactive toxinHQ for 2 h before analysis at 24 h as follows: c Representative cell-cycle arrest induced by toxinWT. Propidium iodide (PI) used as DNA marker and fluorochrome (a.u, arbitrary units). Cell-cycle phases indicated. d Representative image of γH2AX (magenta) and 53BP1 (yellow) with outlines of DAPI-stained nuclei. Scale bars 50 μm. e Representative confocal microscopy of γH2AX RING (magenta) and DAPI-stained nuclei (cyan). Side-panels show z-sections. Scale bars 5 μm. f Proportion of cells with γH2AX RINGs and foci. Coloured circles indicate means from technical replicates (2 biological replicates, ~2000 nuclei/variable). Error bars Standard Deviation (SD). g ToxinWT-induced γH2AX RINGs. Incubation times and concentrations indicated. Six technical replicates, ~360 nuclei/variable (one biological replicate). Error bars Standard Error of the Mean (SEM). h Proportion of cells with 53BP1 foci. Coloured circles indicate means from fields of view (3 biological replicates, ~2200 nuclei/variable). Error bars SEM. i Proportion of 53BP1-positive cells with γH2AX RINGs and foci. Coloured circles indicate means from technical replicates (two biological replicates, 450 nuclei/variable). Error bars SEM. j Representative image of γH2AX RINGs (magenta) in infected cells. Salmonella Typhi (green) encoding the toxin (WT) or toxin null mutant (ΔcdtB) at 24 h shown with outlines of DAPI-stained nuclei. Scale bars 50 μm. k Representative image of γH2AX RINGs (magenta) in EcCDT-treated cells shown with outlines of DAPI-stained nuclei. Scale bars 25 μm. In representative images d, j, k arrows indicate DNA damage RINGs (blue) and foci (white). Statistical significance (**** = P < 0.0001, *** = P < 0.0002, ** = P < 0.0021, * = P < 0.0332, ns denotes non-significant = P > = 0.05) calculated using an unpaired two-sided t test (g, i), or relative to corresponding control using one-way ANOVA and Tukey’s multiple comparison test (f, h). Source data provided as a Source Data file
Fig. 2
Fig. 2
RINGs are triggered during S-phase of the cell cycle. a Proportion of toxin-induced γH2AX RINGs in non replicating (− serum, blue circle) or replicating (+ serum, red circle) HT1080 cells. Untreated control cells are shown. Serum-starved cells were incubated with serum from 24 h as indicated (released, green circle). Coloured circles indicate means from at least two biological replicates (2000 nuclei per variable). b Representative image of γH2AX RINGs ± serum at 24 h. γH2AX labelled in magenta. Outlines of DAPI-stained nuclei shown. Scale bars 50 μm. c Representative image of γH2AX RINGs in released cells. Labelled as B. Scale bars 50 μm. d Representative immunoblot of toxin-induced phosphorylation of CHK1 (pCHK1) and H2AX (γH2AX) ± serum at 6 or 24, or 48 h (released). MW in kDa left. e Representative image of EdU-labelled DNA in γH2AX RING or foci cells at 24 h. EdU incubated for 24 h. Scale bars 5 μm. f Proportion of γH2AX RING cells with EdU-labelled DNA at 24 h. EdU incubated for 24 h or 1 h before fixation. Circles indicate means from at least three biological replicates (>220 nuclei per condition). g Representative image of γH2AX RINGs (blue arrow) or foci (white arrow) in the presence of DMSO (control), ATR inhibitor (iATR), or ATM inhibitor (iATM) shown with outlines of DAPI-stained nuclei. ToxinHQ used as negative control. Scale bars 50 μm. h Proportion of γH2AX RINGs in presence of ATR/ATM inhibitors at 24 h. Control toxinHQ-treated cells are shown. Circles indicate means from two biological replicates (470 nuclei per variable). Statistical significance (**** = P < 0.0001, *** = P < 0.0002, ** = P < 0.0021, * = P < 0.0332, ns = P > = 0.05) was calculated relative to corresponding control (unt, +serum in a; toxinHQ in h) using one-way ANOVA and a Tukey’s multiple comparison test (a, h), or between samples using an unpaired two-sided t test (f). Error bars SD. Source data are provided as a Source Data file
Fig. 3
Fig. 3
RINGs mark RPA exhaustion induced by the typhoid toxin. a Representative immunoblot of HT1080 cells intoxicated with toxinWT or toxinHQ (txHQ) for 2 h before analysis with indicated antibodies at time-points marked in hours (hr). MW in kDa left. b Proportion of intoxicated cells with γH2AX RINGs or γH2AX foci containing RPA pT21 foci (pRPA, grayscale). γH2AX labelled in magenta. 2 biological replicates (1500 nuclei per variable). Error bars SD. c Representative image of RPA32 pT21 (pRPA) with γH2AX RINGs (blue arrow) or foci (white arrow). Scale bars 50 μm. d Representative immunoblot of RPA knockdown (siRPA) cells shown with transfection (siGAPDH) and gel loading (tubulin) controls. In all, 25 nM siRNA for 48 h. MW in kDa left. e Cell-cycle phases in RPA knockdown or siGAPDH control (ctrl) cells. Coloured symbols indicate means from 3 biological replicate (60,000 cells per variable). Error bars SD. f Representative image of γH2AX RINGs (white arrow) in RPA knockdown cells. Scale bars 25 μm. g Proportion of γH2AX RINGs in RPA knockdown cells ± toxinWT. Non-transfected control (nt). Circles indicate means from fields of view in two biological replicates (122 nuclei per variable). Error bars SEM. h Representative immunoblot of super-RPA cells ± toxinWT analysed with indicated antibodies. Hyper-phosphorylated RPA32 (red arrow), non-phosphorylated RPA32 (blue arrow). MW in kDa left. i Proportion of γH2AX RINGs in super-RPA cells ± toxinWT. Two biological replicates (2000 nuclei per variable). Error bars SEM. j Representative image of γH2AX in U2OS control cells (ctrl) or super RPA U2OS cells stably expressing recombinant RPA complex intoxicated with 5 ng/ml toxinWT. Scale bars 5 μm. In representative images c, f, g outlines of DAPI-stained nuclei are shown. Statistical significance (**** = P < 0.0001, *** = P < 0.0002, ** = P < 0.0021, * = P < 0.0332, ns = P > = 0.05) was calculated between indicated experiments using an unpaired two-sided t test (b), or calculated relative to indicated controls using one-way ANOVA (g, i) or two-way ANOVA (e) together with a Tukey’s multiple comparison test. Source data are provided as a Source Data file
Fig. 4
Fig. 4
Typhoid toxin exhausts RPA by oversupply of ssDNA substrate. a Representative image of toxin-induced RPA exhaustion. HT1080 cells intoxicated with toxinWT or toxinHQ for 2 h before polymerisation of double-stranded BrdU-labelled DNA from sites of exposed ssDNA template at 24 h (ssDNA, magenta). ssDNA-bound RPA32 pT21 (pRPA, cyan) shown with BrdU shown in grayscale for clarity (ssDNA foci). Insets of toxinWT magnify ssDNA foci unprotected by pRPA (blue arrow) or partially protected by pRPA indicated by white co-localisation staining (white arrow). Insets of toxinHQ show RPA-bound ssDNA. Scale bars 10 μm. b Proportion of BrdU-labelled ssDNA foci per nucleus in intoxicated HT1080 cells. Aphidicolin (APH) was used as positive control for ssDNA induction and toxinHQ used as a negative control. Coloured circles indicate means from fields of view. Two biological replicates (160 nuclei per variable). Error bars SEM. c Proportion of serum-starved cells with RPA32 pT21 foci (pRPA). Coloured circles indicate means from technical replicates (two biological replicates, 900 nuclei/variable). Error bars SEM. d Proportion of cells with RPA32 pT21 foci (pRPA) in presence of serum. Coloured circles indicate means from technical replicates (2 biological replicates, 900 nuclei/variable). Error bars SD. e Representative image of RPA32 pT21 (pRPA, grayscale) with γH2AX (magenta) RINGs (blue arrows) in cells treated with APH as indicated. Scale bars 50 μm. f Proportion of γH2AX RINGs in APH-treated cells ± toxinWT as indicated. Coloured circles indicate means from fields of view (two biological replicates, 600 nuclei/variable). Error bars SEM. g Mean RPA pT21 (pRPA) foci intensity in APH-treated cells ± toxinWT as indicated. Coloured circles indicate means from fields of view (two biological replicates, 600 nuclei/variable). Error bars SEM. A.U, arbitrary units. In representative images (a, e) outlines of DAPI-stained nuclei are shown. Statistical significance (**** = P < 0.0001, *** = P < 0.0002, ** = P < 0.0021, * = P < 0.0332, ns = P > = 0.05) was calculated relative to toxinHQ using one-way ANOVA and a Dunnett’s multiple comparison test (b), or relative to untreated via one-way ANOVA and a Tukey’s multiple comparison test (c, d, f, g). Source data provided as a Source Data file
Fig. 5
Fig. 5
RING-induction by the toxin drives senescence and infection. a Representative image of toxin-induced cell growth arrest and distension. HT1080s either untreated or treated with toxinWT or toxinHQ for 2 h before imaging at 7-days. Cell colonies (top panel) and high-magnification images (bottom panel). Arrows mark individual cells. Scale bars 50 μm. b Representative image of SA-β-Gal activity in intoxicated cells. Scale bars 50 μm. c Proportion of intoxicated cells with SA-β-Gal activity relative to untreated. Analysed 1700 cells/variable, error bars SD. d Representative image of toxin-induced SA-β-Gal in γH2AX RING cells at 48 h. Blue arrows indicate senescent RING cells (γH2AX in magenta/SPiDER β-Gal in grayscale) and distended nuclei (DAPI, greyscale). White arrows indicate non-senescent cells. Scale bars 50 μm. Proportion of cells with SA-β-Gal activity following (e) intoxication with toxinWT ± serum (350 cells/variable, error bars SD), f RPA knockdown (900 cells/variable, error bars SEM), g APH-treatment (900 cells/variable, error bars SD), and h infection with wild-type (SmWT) or toxin-deficient (SmΔcdtB) S.Javiana (3500 cells/variable, error bars SEM). i Experimental pipeline for j, k and l assaying toxin-induced transmissible senescence. Conditioned medium harvested from cells 24 h post-treatment, as indicated, was incubated with fresh cells for 6-days before assaying: j SA-β-Gal activity in HT1080s (1240 cells/variable, error bars SD). k γH2AX (green) positive HT1080 cell nuclei (DAPI, blue). One biological replicate, 300 cells/variable, error bars SD. Representative γH2AX images shown left. Scale bars 50 μm. l Salmonella infection of THP1s. 370 cells/variable, error bars SD. Representative images of THP1s (DAPI, blue) infected with SalmonellaΔcdtB (green), left. Scale bars 50 μm. In graphs, coloured circles indicate means from technical replicates (two biological replicates, unless indicated otherwise). Statistical significance (**** = P < 0.0001, *** = P < 0.0002, ** = P < 0.0021, * = P < 0.0332, ns = P > = 0.05) was calculated relative to control (indicated by lack of p-value) using a one-way ANOVA and a Tukey’s multiple comparison test (c, g, j, k, l), or an unpaired two-sided t test (e, f, h). Source data are provided as a Source Data file
Fig. 6
Fig. 6
Proposed Model. Left: a Control cells undergo DNA replication where RPA protects ssDNA from breakage. b Cells divide, and c no senescence is observed, which impairs Salmonella infection. Right: d The typhoid toxin causes an initial burst of DNA damage in G1 that combines with damage in S-phase to cause replication stress by oversupply of the RPA substrate ssDNA. e RPA sequestration causes DNA damage that manifests as γH2AX RINGs. f RING cells enter into a senescence-like state resulting in SASP-induced transmissible senescence that promotes Salmonella invasion into host cells. Thus, toxin manipulation of infection niches via senescence may contribute to chronic Salmonella infections, which are associated with the typhoid toxin,,

Similar articles

Cited by

References

    1. Polo SE, Jackson SP. Dynamics of DNA damage response proteins at DNA breaks: a focus on protein modifications. Genes Dev. 2011;25:409–433. doi: 10.1101/gad.2021311. - DOI - PMC - PubMed
    1. Celeste A, et al. Histone H2AX phosphorylation is dispensable for the initial recognition of DNA breaks. Nat. Cell Biol. 2003;5:675–679. doi: 10.1038/ncb1004. - DOI - PubMed
    1. Yuan J, Adamski R, Chen J. Focus on histone variant H2AX: to be or not to be. FEBS Lett. 2010;584:3717–3724. doi: 10.1016/j.febslet.2010.05.021. - DOI - PMC - PubMed
    1. Hernandez-Segura A, Nehme J, Demaria M. Hallmarks of Cellular Senescence. Trends Cell Biol. 2018;28:436–453. doi: 10.1016/j.tcb.2018.02.001. - DOI - PubMed
    1. Cimprich KA, Cortez D. ATR: an essential regulator of genome integrity. Nat. Rev. Mol. Cell Biol. 2008;9:616–627. doi: 10.1038/nrm2450. - DOI - PMC - PubMed

Publication types