. 2019 Sep 6;10(1):4042.
doi: 10.1038/s41467-019-11880-9.

SOX11 and SOX4 drive the reactivation of an embryonic gene program during murine wound repair

Affiliations

SOX11 and SOX4 drive the reactivation of an embryonic gene program during murine wound repair

Qi Miao et al. Nat Commun. .

Abstract

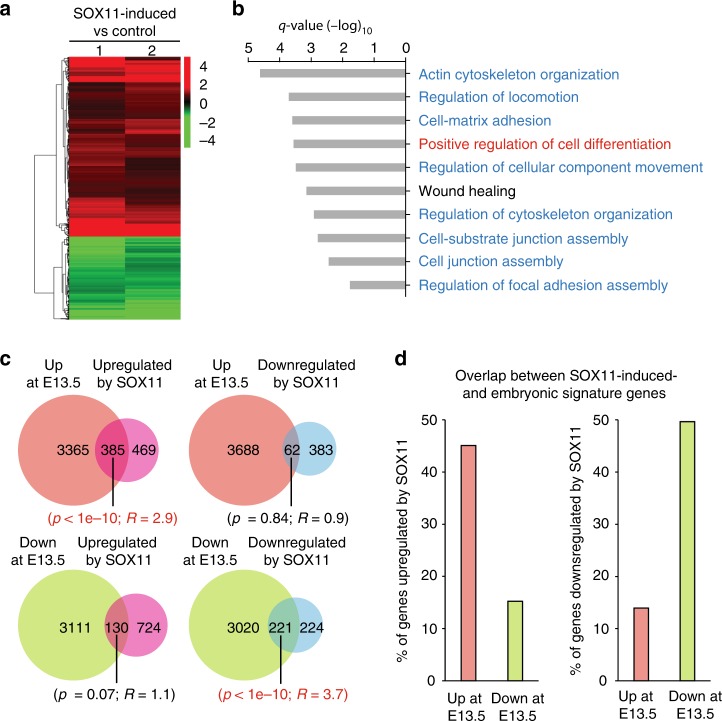
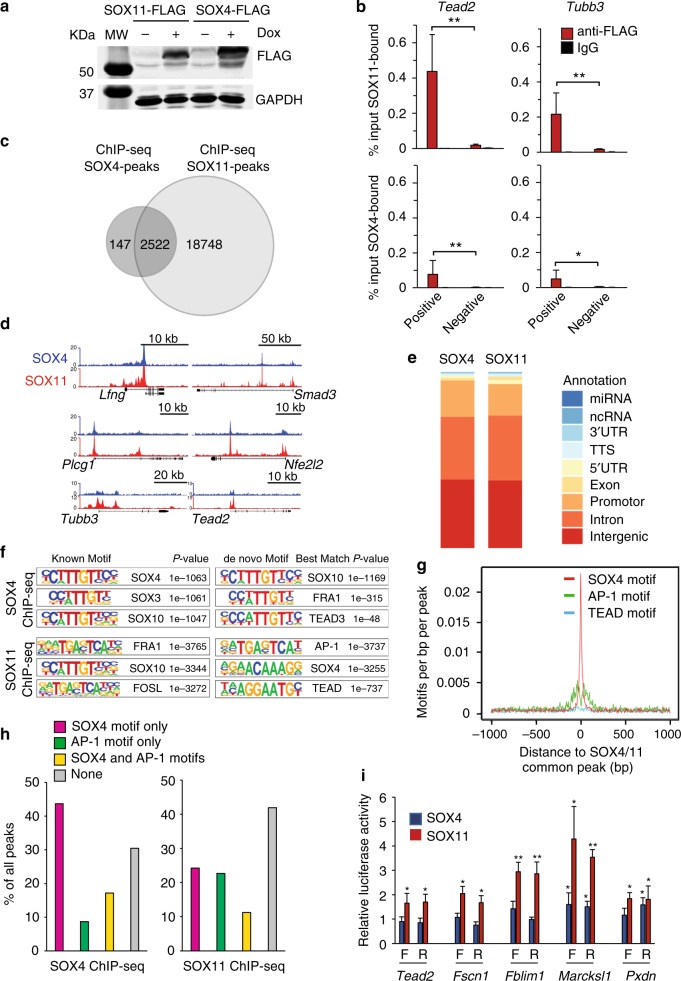
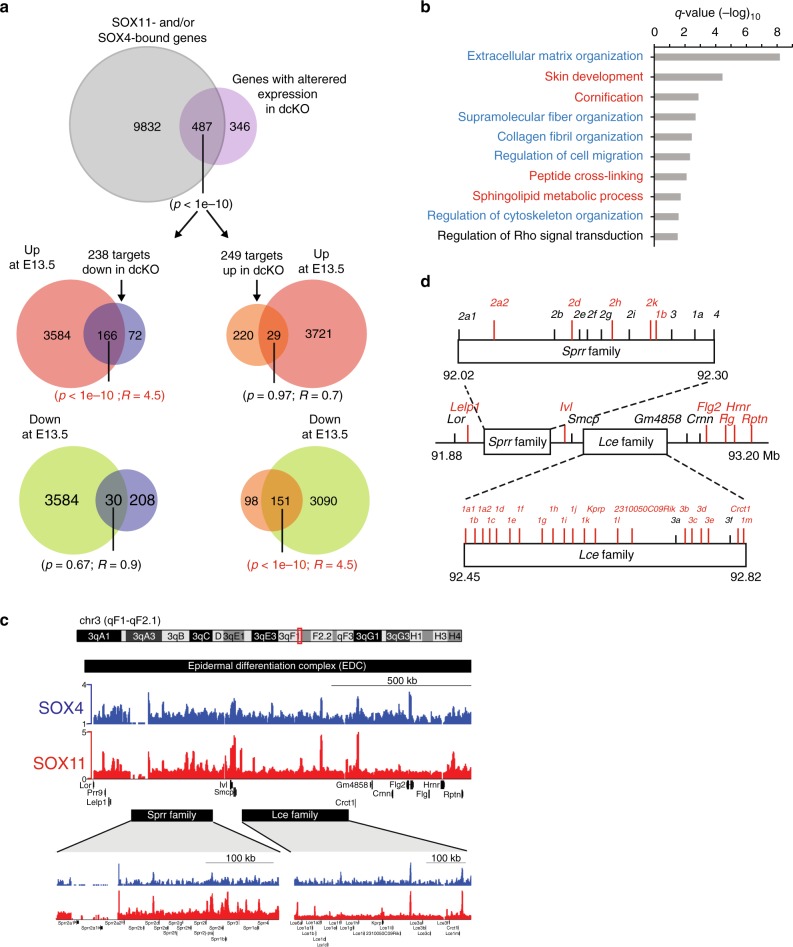
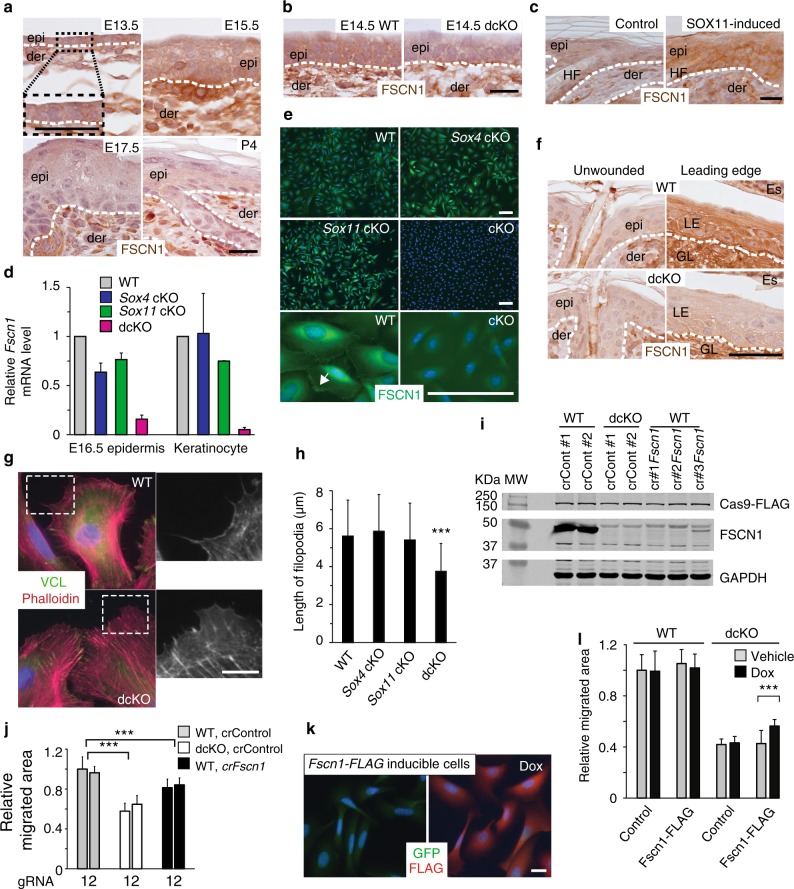
Tissue injury induces changes in cellular identity, but the underlying molecular mechanisms remain obscure. Here, we show that upon damage in a mouse model, epidermal cells at the wound edge convert to an embryonic-like state, altering particularly the cytoskeletal/extracellular matrix (ECM) components and differentiation program. We show that SOX11 and its closest relative SOX4 dictate embryonic epidermal state, regulating genes involved in epidermal development as well as cytoskeletal/ECM organization. Correspondingly, postnatal induction of SOX11 represses epidermal terminal differentiation while deficiency of Sox11 and Sox4 accelerates differentiation and dramatically impairs cell motility and re-epithelialization. Amongst the embryonic genes reactivated at the wound edge, we identify fascin actin-bundling protein 1 (FSCN1) as a critical direct target of SOX11 and SOX4 regulating cell migration. Our study identifies the reactivated embryonic gene program during wound repair and demonstrates that SOX11 and SOX4 play a central role in this process.


Conflict of interest statement

The authors declare no competing interests.

Figures

Fig. 1
Fig. 1
Embryonic genes including Sox11 are induced at the wound edge. a Heat map of clustering of differentially expressed (FDR < 0.05 and fold change > 1.5) probesets in epidermal cells at embryonic day 13.5 (E13.5) relative to epidermal basal cells at postnatal day 4 (P4), from two-color microarray data of two biological replicates of each developmental stage. b Venn diagrams depicting the overlap of embryonic epidermal signature genes (genes with a log2 fold-change in expression of ≥1.5 and FDR < 0.05 in E13.5 epidermal cells relative to P4 epidermal cell in the basal layer) with wound edge epidermal signature genes. Venn diagram hypergeometric p values and the enrichment level (R) of the overlaps are indicated. c GSEA showing enrichment of embryonic gene signature in wounded epidermis. d Top ten GO biological processes (Metascape, q values < 0.05) of intersecting genes differentially expressed in both embryonic epidermis at E13.5 and at adult wound edge. Cytoskeletal organization and motility related GO biological processes (blue) as well as embryonic morphogenesis (red) are significantly enriched. e Heat map showing relative expression of Sox family genes in E13.5 epidermal cells versus P4 basal epidermal cells. f Immunofluorescence analysis of SOX11 expression in skins at the indicated developmental stages with β-4 integrin demarking the epidermis from dermis and Hoechst 33342 dye (blue) counterstaining nuclei. g Immunohistochemical analysis of SOX11 expression in normal and 5-day post-wounded adult skin. Black arrow points to the wound edges. Epi, epidermis; der, dermis. Scale bars, 50 µm (f) 100 µm (g). Images in panels f and g are representative images seen across the skin sections of two biological replicates. Source data for panels ac are provided as a Source Data file
Fig. 2
Fig. 2
SOX11 overexpression inhibits epidermal differentiation. a Constructs used to generate transgenic mice expressing epithelial-specific Sox11 under the control of tetracycline and its derivatives. b Immunofluorescence analysis of expression of FLAG-tagged SOX11. Four-day old K14-rtTA;TRE-Sox11-FLAG mice were injected intraperitoneally with Dox for the indicated time prior to skin isolation. Dashed line demarks the border between the epidermis and dermis. c Images of embryos of specified genotypes in X-gal exclusion assay. The pregnant females were on Dox-containing diet until the embryos were collected at E18.5. d Immunofluorescence analysis of differentiation markers in postnatal epidermis expressing SOX11. After birth, the mother was on Dox-containing diet for 5 days and skin sections from K14-rtTA (control) and K14-rtTA;TRE-Sox11-FLAG pups were immunostained with the indicated antibodies. KRT5 (keratin5); KRT1 (keratin 1); LOR (loricrin); FLG (filaggrin). e Immunochemical analysis of embryonic makers in control and SOX11-FLAG expressing epidermis with the indicated antibodies. KRT18 (keratin 18); TCF7L1 (transcription factor 7 like 1); TCF7L2 (transcription factor 7 like 2). (fj) Effect of long-term SOX11 overexpression in postnatal skin. Dorsal skins from K14-rtTA (control) and K14-rtTA;TRE-Sox11-FLAG newborns were grafted in pair onto Nude mice, which were put on a diet containing Dox day 10 post grafting. n = 2. f Image of engrafted mouse 28-day post grafting with engrafted area demarcated by yellow dashed lines. g H&E staining of the sectioned pair of skins showing stunted hair follicles (*) in SOX11-induced skin. f Oil red O staining marks lipids, enriched in sebaceous glands. Immunofluorescence analysis of differentiation markers LOR (i) and FIL (j) in grafted skin. White dashed lines mark the border between epidermis and dermis. HF, hair follicles; Es, eschar; SG, sebaceous glands. Scale bars, 50 µm (b, e) 20 µm (d, ij), 100 µm (g, h). All images reflect the same result seen across the entire embedded skin section from 2 (b, c and fj) or 3 (d and e) biological replicates
Fig. 3
Fig. 3
SOX11 overexpression induces embryonic transcriptional program. a Heat map from two-color microarray analysis depicts clustering of differentially expressed (FDR < 0.05 and fold change > 1.5) probesets in K14-rtTA;TRE-Sox11 epidermis relative to control K14-rtTA epidermis at P4 after 12 h of Dox induction. Data from two biological replicates of each genotype. b Top ten GO biological processes of the differentially expressed genes in SOX11-induced epidermis. Cell organization and movement related (blue) and epidermal differentiation (red) processes are among the most significantly enriched. c High overlap of SOX11-induced signature genes and embryonic epidermal signature genes. The Venn diagrams show overlapping between E13.5 epidermal signature genes and genes changed by SOX11-induction (genes with log2-fold change > 1.5 in both microarrays). Venn diagram hypergeometric p values and the enrichment level (R) of the overlaps are indicated below each Venn diagram, with statistically significant values highlighted in red. d Percentage of genes altered by SOX11 overexpression overlapping with embryonic signature genes. Source data for panels a, c and d are provided as a Source Data file
Fig. 4
Fig. 4
Ablation of Sox11 and Sox4 induces premature epidermal differentiation (a) mRNA transcript copy number of SOXC class genes from FACS-purified E13.5 epidermal and P4 basal epidermal cells normalized to the housekeeping gene Mrpl19. Data are the mean ± SD. n= 2 biological replicates. b Images of E16.5 embryos of indicated genotypes in X-gal exclusion assay. Independent biological replicates of each genotype pair n = 3 Sox4 cKO-control pairs, 5 Sox11 cKO-control pairs, and 4 dcKO-control pairs in independent experiments. c Immunofluorescence analysis of epidermal differentiation marker expression in WT and dcKO at E16.5 (representative images from n = 3 biological replicates). FLG (filaggrin) and LOR (loricrin) are late differentiation markers expressed in termi80 (WT), 63 (Sox4 cKO), 83 (Sox11 cKO), or 88 (dcKO).nally differentiated keratinocytes in the epidermal outer layer; KRT1 (keratin 1) is an early differentiation maker expressed in cells of the intermediate epidermal layers. d BrdU incorporation analysis of WT and dcKO embryos. Pregnant mice were administered with BrdU for 4 h prior to embryo isolation. Skin sections of embryos at E16.5 were immunostained with anti-BrdU antibody. Representative sections are shown (left panel) and BrdU + cells in 13 fields were quantified (right panel). Data are the mean ± SD. n = 2 independent experiments. p = 0.51. e mRNA transcript copy numbers of SOXC class genes expressed in primary keratinocytes, normalized to the housekeeping gene Mrpl19. Cells were isolated from neonatal skins of WT and Sox4/11/12-triple knockout littermates. Data are the mean ± SD. n = 2 triple KO and 6 wild-type (WT) biological replicates. f qRT-PCR analysis of epidermal differentiation gene expression in WT, Sox11 cKO, Sox4 cKO, or dcKO primary keratinocytes. Keratinocytes were cultured in regular media or with the addition of calcium at 1.5 mM for 24 h. Data are the mean ± SD. n = 5 biological replicates. *p < 0.05, **p < 0.01, ***p < 0.001; ns, not significant (Student’s one-tailed t-test). Scale bars, 5 mm (a), 50 µm (c, d). Source data for panels a and df are provided as a Source Data file
Fig. 5
Fig. 5
Identifying downstream effectors of SOX11 and SOX4 in embryonic epidermis. a qRT-PCR analysis of isolated epidermis from Sox11 cKO, Sox4 cKO, or dcKO and their WT littermate embryos at E16.5 with two biological replicates per genotype. The values are gene expression levels in the knockouts relative to their respective wild-type controls. Data are the mean ± SD. n = 2 biological replicates. b Two-color microarray analysis was performed on E16.5 epidermis lacking either Sox11 or Sox4, or both genes, as well as on wild-type littermate, which is used as a baseline control. Heat map shows clustering of probesets with significant differential expression (FDR < 0.05 and fold change > 1.5) in dcKO, Sox11 cKO or Sox4 cKO epidermis relative to their WT littermate controls. n = 2 biological replicates. c Venn diagram showing the overlap of probesets significantly changed in dcKO, Sox11 cKO or Sox4 cKO epidermis. d Cell organization/motility (blue) and epidermal development (red) are among the top GO biological processes found in the differentially expressed genes in dcKO epidermis at E16.5 (as determined by Metascape, q values < 0.05). e Venn diagrams (Top panel) show the overlaps of genes up- or downregulated (log2-fold change ≥ 1.5 and FDR < 0.05) in E16.5 dcKO epidermis with genes up- or downregulated in E13.5 epidermal cells as compared to P4 basal epidermal cells. Hypergeometric p values and the enrichment level (R) of the overlap show statistical significance between specified groups (highlighted in red). f Graph shows the percentage of genes altered in dcKO overlapping with embryonic signature genes. Source data are provided as a Source Data file
Fig. 6
Fig. 6
Identification of direct targets of SOX11 and SOX4 by ChIP-seq profiling. a Western blot analysis of induced expression of SOX11-FLAG and SOX4-FLAG in keratinocytes. Western blotting was done on isolated GFP+ cells cultured for 24 h with or without Dox. The representative blots shown are from three independent experiments. b ChIP-qPCR verifies binding of genomic region containing known SOX4/11 binding sites in the Tead2 and Tubb3 genes to FLAG-tagged SOX11 or SOX4 protein. Primers were designed to amplify the known binding sites (positive) or neighboring regions without potential SOX consensus elements (negative). Data are the mean ± SD. n = 4 biological replicates. *p < 0.05 (Student’s one-tailed t-test). c Overlay of SOX11 and SOX4 ChIP-seq peaks identified from ChIP-seq experiment where lysates from two biological replicates of keratinocytes deficient of both Sox11 and Sox4 induced to express SOX11-FLAG or SOX4-FLAG for 24 h and the amount of specified genomic regions bound by SOX11-FLAG or SOX4-FLAG were quantified. d Representative ChIP-seq profiles of indicated genes with genomic region binding to SOX11 and SOX4. e Annotation of SOX11 and SOX4 genome-wide binding sites. f Homer motif analysis for SOX11 and SOX4 ChIP-seq. (Left) Matches to known motifs; and (Right) de novo motif enrichment with best motif matches indicated. FRA1 and FOSL2 are FOS-related members of AP-1 transcription factor complex. g SOX4, AP-1, and TEAD motif enrichment around SOX11 and SOX4 binding sites. h Ratios of SOX11 or SOX4 ChIP-seq peaks with or without SOX4 and/or AP-1 consensus binding motifs. i Genomic regions containing SOX4 and SOX11 ChIP-seq peak from Tead2, Fscn1, Fblim1, Pxdn, and Marcksl1 were cloned and placed in either forward (F) or reversed (R) orientation upstream of the luciferase reporter gene. Luciferase activity was measured and Firefly luciferase activity was normalized over Renilla luciferase activity. Graph shows normalized luciferase activity relative to vector control. n = 5 independent experiments. Data are mean ± SD. *p< 0.05, **p< 0.01 (Student’s one-tailed t-test). Source data for panels a, b, h, and j are provided as a Source Data file
Fig. 7
Fig. 7
Identification of direct targets of SOX11 and SOX4 in embryonic epidermis. a Top Venn diagram shows the overlap of SOX4/11-bound targets (ChIP-seq) and transcripts in dcKO E16.5 epidermis whose expression is changed >1.5-fold (log2-fold change) and FDR < 0.05. The bottom Venn diagrams show the overlap between the SOX11- and SOX4- directly regulated targets and the differentially expressed genes in E13.5 epidermal cells. Statistically significant p values and the enrichment level R values are highlighted in red. b GO enrichment analyses of the 487 direct targets of SOX11 and/or SOX4 in embryonic epidermal progenitors (from Fig. 7a), highlighting categories related to cell cytoskeleton and movement (blue) and epidermal development (red), as determined by Metascape, q values < 0.05. c SOX11 and SOX4 ChIP-seq tracks displaying shared SOX11- and SOX4-bound genomic regions in the EDC locus. Sprr and Lce family gene clusters are shown at higher magnification below. d Schematic representation of the epidermal differentiation cluster (EDC) on mouse chromosome 3. Late-stage differentiation EDC genes that were highly upregulated in dcKO epidermis at E16.5 are marked in red. They are also listed in Supplementary Table 2. Source data for panel a are provided as a Source Data file
Fig. 8
Fig. 8
Deficiency of Sox11 and Sox4 reduces cell migration and re-epithelialization. a Representative images of keratinocytes at the end point of the migration assay using primary keratinocytes from WT or cKO newborns. n = 3 biological replicates. b Graph quantifying relative areas the cells migrated normalized over control. Data are the mean ± SD. n = 3 biological replicates, with 16–24 fields quantified per replicate. ***p < 0.001 (Student’s two-tailed t-test). c Effect of Sox11 and Sox4 on migration of cells lacking both genes. dcKO keratinocytes were transduced to express luciferase (Luc, control), Sox11, Sox4, or both Sox11 and Sox4. Graph quantifying the relative areas the Dox-treated cells migrated normalized over vehicle controls. n = 2 biological replicates, with 12–20 fields quantified per replicate. Data are the mean ± SD. ***p < 0.001 (Student’s two-tailed t-test). d Images of a nude mouse with grafted skins and the splinted wound healing model. WT and cKO neonatal dorsal skins were grafted onto Nude mice pairwise, and splinted wound was created ten weeks post grafting (4 × 10 mm). e Representative images of epidermal tongues five days post wounding in skin of indicated genotypes. f Graph quantifying the amount of re-epithelialization in cKO skin relative to littermate wild type controls. Data are the mean ± SD. n = 4 Sox4 cKO-control pairs, 6 Sox11 cKO-control pairs, and 6 dcKO-control pairs. **p < 0.01 (Student’s two-tailed t-test). g Venn diagram (left) shows the overlapping of genes upregulated in epidermal cells at E13.5 and adult wounded edge, and downregulated in dcKO keratinocytes. The right diagram shows the overlapping of genes downregulated at the wound edge and at E13.5, and upregulated in dcKO keratinocytes. Epi, epidermis; Der, dermis; Es, eschar; LE, leading edge; GL, granulation layer; der, dermis. Scale bars, 100 µm (a), 200 µm (e). Source data for panels b, c, f, and g are provided as a Source Data file
Fig. 9
Fig. 9
Fscn1 is regulated by SOX11 and SOX4 during development and wounding (a, b) Immunohistochemical analysis of FSCN1 expression in WT skin during development (a), in dcKO skin at E14.5 (b) and skin with FLAG-SOX11 induced since birth at P5 (c). d RT-qPCR analysis of Fscn1 expression in E16.5 epidermis and primary keratinocytes with the indicated genotypes. Data are the mean ± SD. n= 3 biological replicates. e Immunofluorescence analysis of FSCN1 expression in keratinocytes of specified genotypes, with FSCN1 localized at cell edges (arrowed). f Immunohistochemical analysis of FSCN1 expression in WT and dcKO skin 5 days post wounding. g Immunofluorescence analysis of filopodia with anti-VCL (vinculin) and iFluor 647-conjugated phalloidin (to detect actin filaments). h Graph quantifying the filopodia length in keratinocytes. Data are the mean ± SD. n= 80 (WT), 63 (Sox4 cKO), 83 (Sox11 cKO), or 88 (dcKO). ***p < 0.001 (Student’s two-tailed t-test). i Western analysis of WT or dcKO keratinocytes expressing FLAG-tagged CRISPR/Cas9 and control gRNAs or gRNAs targeting Fscn1. The representative blots from two independent experiments. j Graph quantifying relative areas the cells migrated normalized over the controls (WT cells expressing control gRNAs). n= 3 biological replicates, with 12–18 fields quantified per replicate. Data are the mean ± SD. ***p < 0.001 (Student’s two-tailed t-test). k Immunofluorescence analysis of FLAG-FSCN1 expression in FACS-isolated GFP + cells from keratinocytes that were transduced to express GFP with tet-inducible FLAG-FSCN1 and with or without 24 h Dox treatment. l WT or dcKO keratinocytes were transduced to express GFP alone or GFP with FLAG-FSCN1. Graph quantifying relative areas the cells migrated normalized over the control (WT cells with empty vector without Dox). n = 3 independent experiments with 12–18 fields quantified per replicate. Data are the mean ± SD. ***p < 0.001 (Student’s two-tailed t-test). Epi epidermis, der dermis, HF hair follicles, Es eschar; LE leading edge, GL granulation layer. Scale bars, 20 µm (ac, k), 100 µm (e), 50 µm (f), 10 µm (g). Images are representative of 2 (e, k) or 3 (ac and f) biological replicates. Source data for panels d, hj and l are provided as a Source Data file

Similar articles

Cited by

References

    1. Blanpain C, Fuchs E. Epidermal stem cells of the skin. Annu Rev. Cell Dev. Biol. 2006;22:339–373. doi: 10.1146/annurev.cellbio.22.010305.104357. - DOI - PMC - PubMed
    1. Martin P. Wound healing—aiming for perfect skin regeneration. Science. 1997;276:75–81. doi: 10.1126/science.276.5309.75. - DOI - PubMed
    1. Donati G, et al. Wounding induces dedifferentiation of epidermal Gata6(+) cells and acquisition of stem cell properties. Nat. Cell Biol. 2017;19:603–613. doi: 10.1038/ncb3532. - DOI - PMC - PubMed
    1. Ge Y, et al. Stem cell lineage infidelity drives wound repair and cancer. Cell. 2017;169:636–650 e614. doi: 10.1016/j.cell.2017.03.042. - DOI - PMC - PubMed
    1. Fernandez Vallone V, et al. Trop2 marks transient gastric fetal epithelium and adult regenerating cells after epithelial damage. Development. 2016;143:1452–1463. doi: 10.1242/dev.131490. - DOI - PMC - PubMed

Publication types

MeSH terms